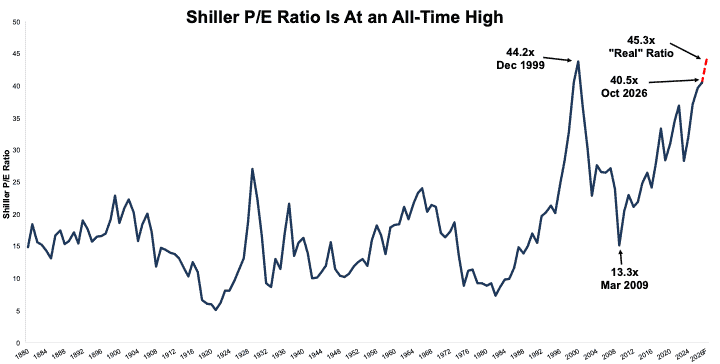
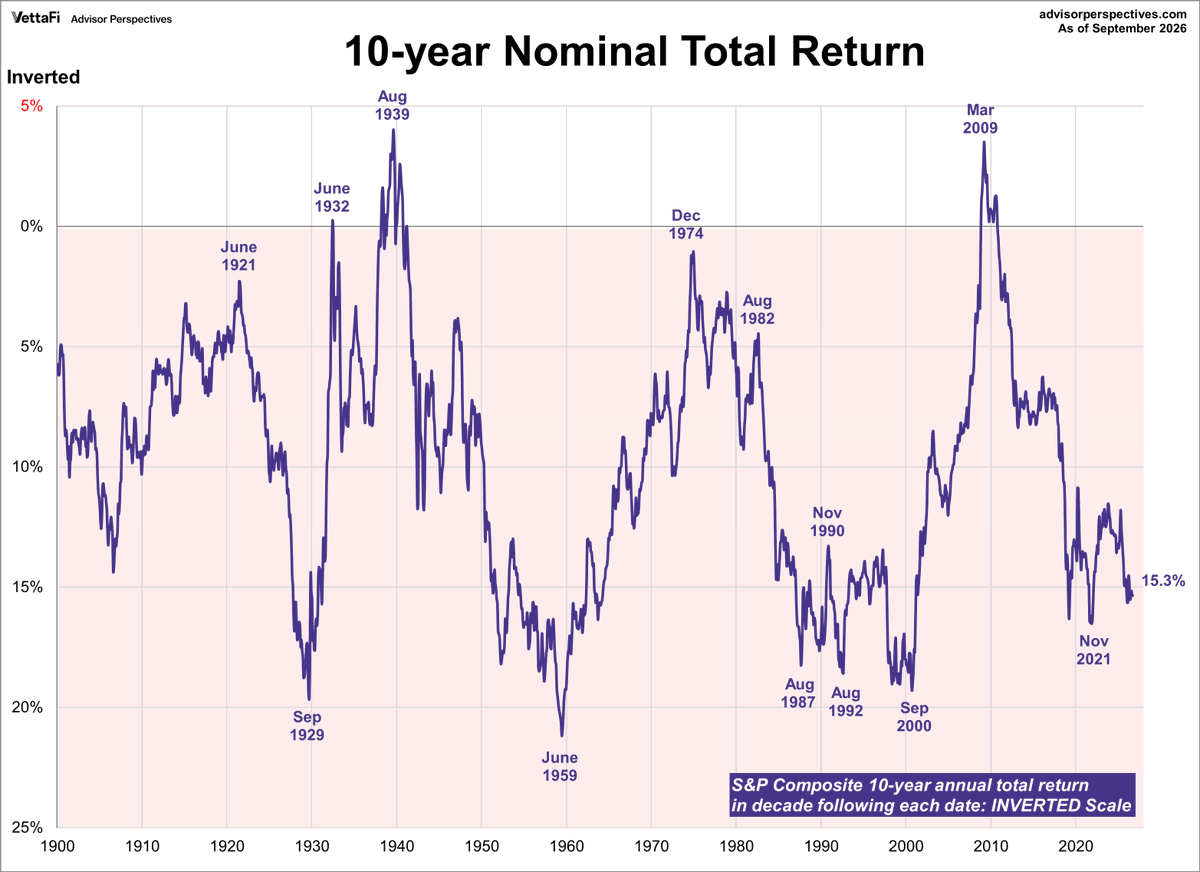
Hidden interest expense from off-balance sheet debt is over $230 billion or 9% of aggregate S&P 500 GAAP earnings. That puts the Shiller P/E ratio at an all time high of 45.3. Full report (free) here: https://t.co/HOjmEEI2Dd
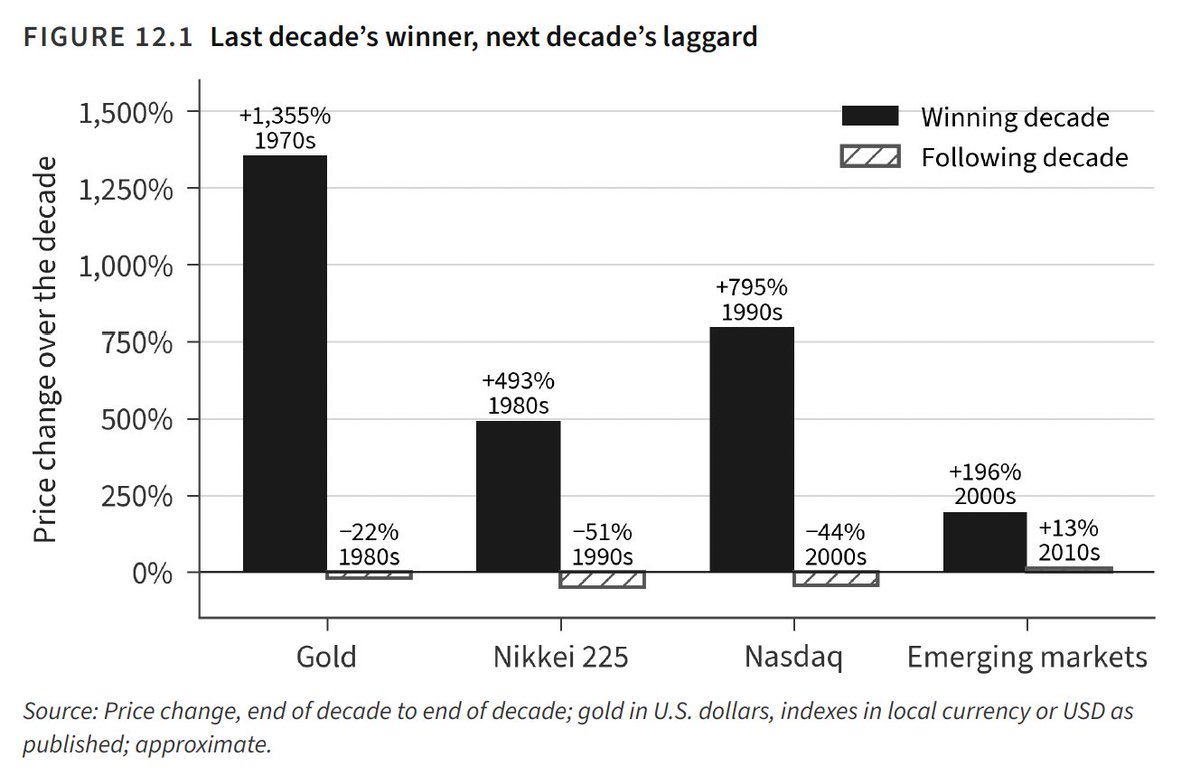
Each of the last several decades had a clear winner, an asset that rose so far and so persistently that it came to seem like the obvious place for money.
Each went on to disappoint in the decade that followed.
The pattern is consistent across very different assets:
* Gold rose more than thirteen-fold in the inflationary 1970s, then lost ground through the 1980s as inflation fell.
* Japanese stocks rose nearly six-fold in the 1980s, then lost half their value in the 1990s, beginning a slump that lasted decades.
* The Nasdaq rose roughly nine-fold in the 1990s, then fell 44 percent in the 2000s.
* Emerging market stocks nearly tripled in the 2000s, then barely moved in the 2010s.
In each case, the decade’s winner ended it with the widest following, the most confident forecasts, and the highest prices relative to its fundamentals.
From 1994 to 2000 the S&P 500 gained 49% against the equal-weight version.
From 2015 to 2026 the S&P 500 gained 44% against the equal-weight version.
Ryan Albert @terton_capital on Why South Korean Stocks Trade at a Discount And Why That Could Change
* How Shareholder Activism Could Unlock Hidden Value
* Quasars, Dutch Disease and The Enormous Concentration of Investment in AI Infrastructure
* South Korea vs. Japan: Where Are the Best Value Investing Opportunities?
* Can South Korea’s Corporate Governance Reforms Unlock Lasting Value?
*NEW EPISODE* VALUE: After Hours (S08 E34): Korea’s Hidden Value: Activism, AI & Golfzon | Ryan Albert
Why South Korean Stocks Trade at a Discount — And Why That Could Change
How Shareholder Activism Could Unlock Hidden Value
Quasars, Dutch Disease and The Enormous Concentration of Investment in AI Infrastructure
South Korea vs. Japan: Where Are the Best Value Investing Opportunities?
Can South Korea’s Corporate Governance Reforms Unlock Lasting Value?
https://t.co/92zEP8ugfP
If high-quality bonds protect against one kind of crash but not the other, what else belongs in the portfolio? Many products are sold as crash protection. The fairest test is to see what each did in the two most recent, very different stress years.
The chart repays careful reading.
* Stocks of every kind fell in both years. International stocks and real estate did not protect U.S. investors in either crash. Their case rests on long-run diversification, not crash protection. Within U.S. stocks, value shares held up far better than growth shares in 2022, but not in 2008.
* Long-term Treasuries and commodities are mirror images. Each saved the portfolio in one year and hurt it badly in the other. Holding a modest amount of both is a hedge against not knowing which engine will run.
* Gold roughly held its value in both years. It pays no income, and it can fall sharply in other periods, as it did in the early 1980s and in 2013. It is a store of value in a crisis, not a growth engine.
*Managed futures gained in both years. These funds follow price trends across stocks, bonds, currencies, and commodities, going long or short. They tend to do well in extended declines of any kind. They can also lag for years in calm, trendless markets, and their fees are higher than index funds’.
*Treasury bills gained in both years. Its cost is low returns in good times.
This week in value:
Bill Nygren’s Q3 2026 Market Commentary: A conversation with shareholders (Oakmark)
Hidden Value in South Korea (@verdadcap )
Chris Davis and Robert Hagstrom on Holding Great Businesses (ER)
Ken Fisher on Interest Rates, Global Diversification, Overblown Market Fears and More (Fisher)
Value vs. Growth Investing (Benzinga)
In hindsight, a recovery looks like a clean V or a steady climb. From the inside, it looks like a sequence of false dawns, each followed by a new scare.
Bear markets regularly produce powerful rallies that fail. Each false start drew investors back in and then punished them. That experience makes the real recovery harder to trust. By the time the true bottom arrives, many investors have been fooled twice and will not commit a third time.
$RSP (equal weight S&P 500) has beaten $SPY over four decades but has trailed through to lows in 2000, 2009, 2020 and three times since 2025 to the current low.
It's impossible to call a bottom, but when it turns value, SMID and cyclicals will outperform.