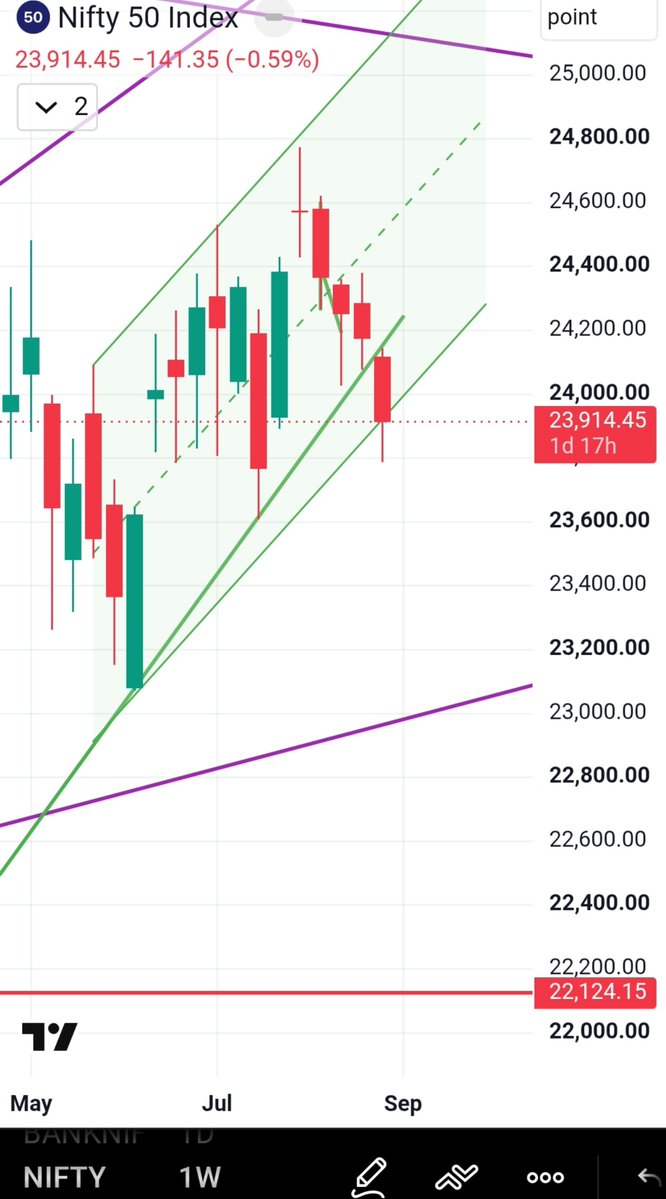
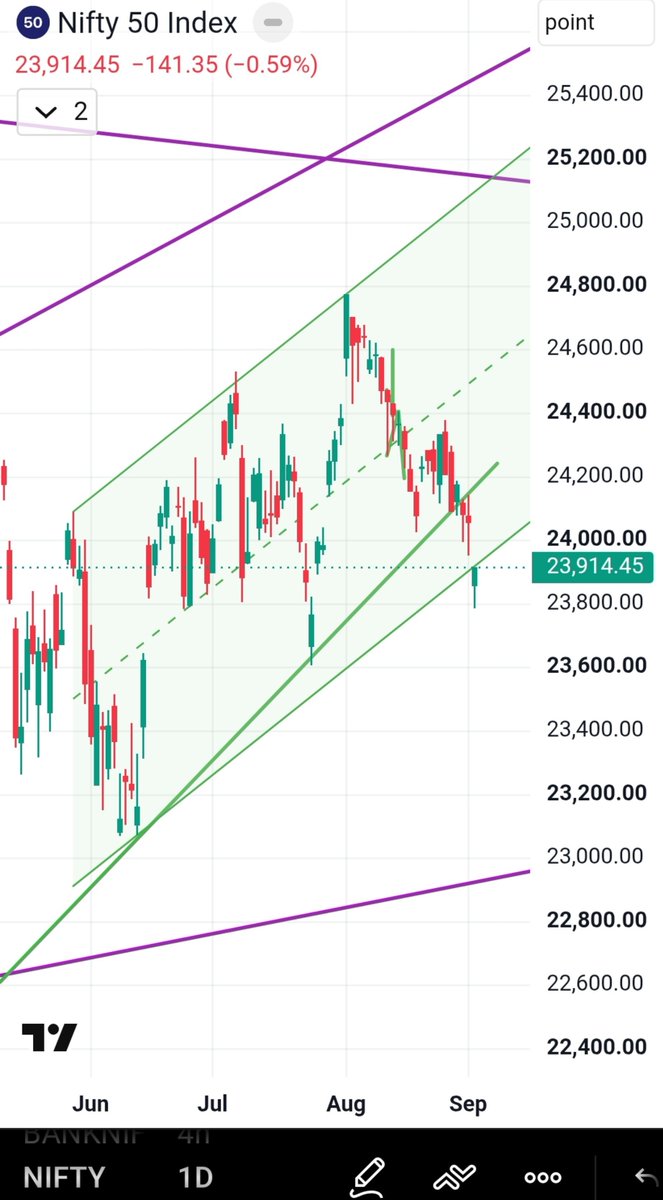
Based on your daily chart for the Nifty 50 Index (1D):
1. Breakout or Breakdown: The active candle is a small red Bearish / Spinning Top style candle with a minor lower shadow.
2.Trendline Interaction: The price has dipped slightly below the green ascending support trendline.
3. Can We Consider This a Confirmed Breakout / Breakdown?No, this is not yet a confirmed breakdown.
Lack of Decisive Closing: The candle body is small and sitting right at/slightly below the trendline around 24,055. A confirmed breakdown requires a strong, solid red candle closing convincingly below support.
Proximity to Key Support: The 24,000 horizontal level is crucial psychological and structural support. Until Nifty breaks and closes decisively below 24,000, this movement is considered a subtle test or a potential false breakdown (wip-saw).
Missing Volume / Follow-Through: Confirmation requires follow-through price action (a secondary red candle opening and moving lower below today’s low) accompanied by expanding volume Trading.
#Nifty50 #TechnicalAnalysis
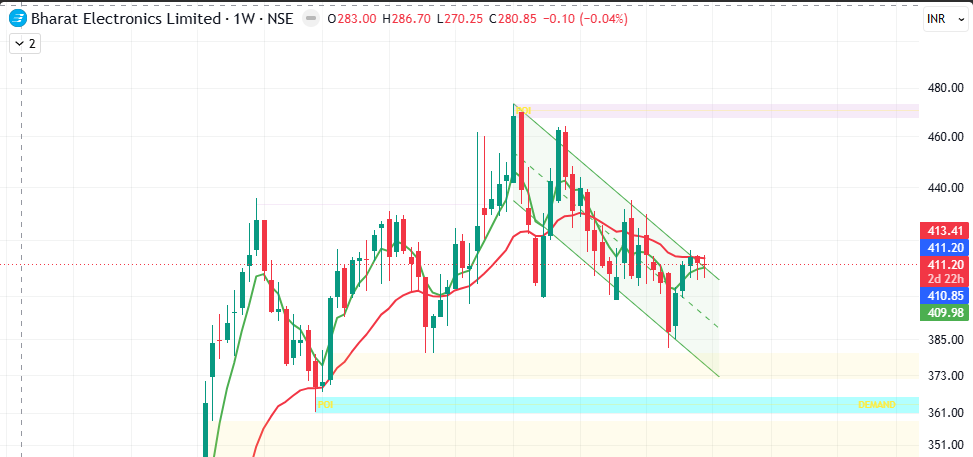
BEL weekly chart: After a strong rally, price is now inside a descending channel from the ~473 peak.
Lower highs + lower lows in play.
Trading near 410-413 zone.
Key support sits at the 361-373 demand block (PO / bound zone).
MAs flattening / price hugging them — momentum cooling after the big run.
Break above the falling trendline could open 430-450. Failure may test 385 then 370.
Defence PSU with solid order book, but chart is in corrective mode right now. Watch volume and weekly close for direction.
Not a buy/sell call — just sharing structure.
#BEL #BharatElectronics #StockMarket #Nifty #DefenceStocks #TechnicalAnalysis #TradingView
Disclaimer: For educational purposes only. Not financial advice. Markets involve risk. Do your own research.
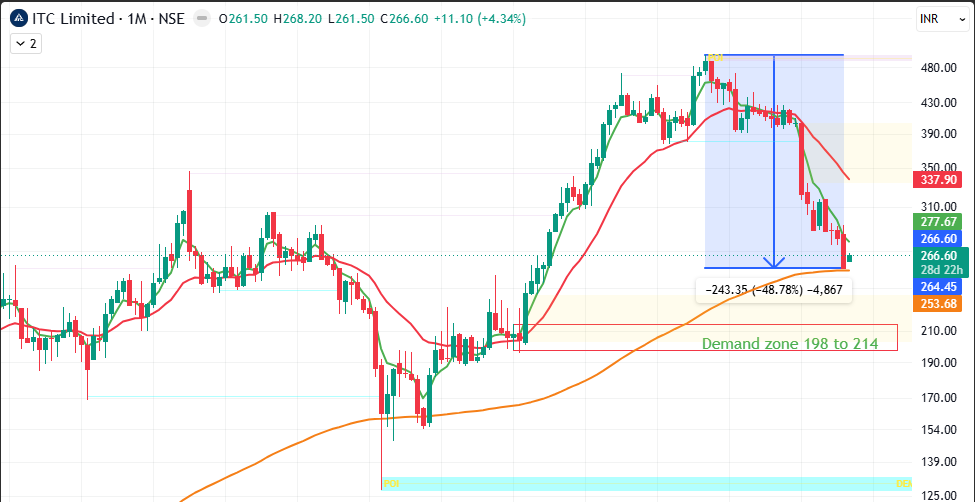
ITC Technical Analysis:
Monthly Timeframe takes support at 200 EMA. Whether it will bounce Back or test Demand zone.
Comment ur view.
#ITC#Nifty50#Technicalanalysis
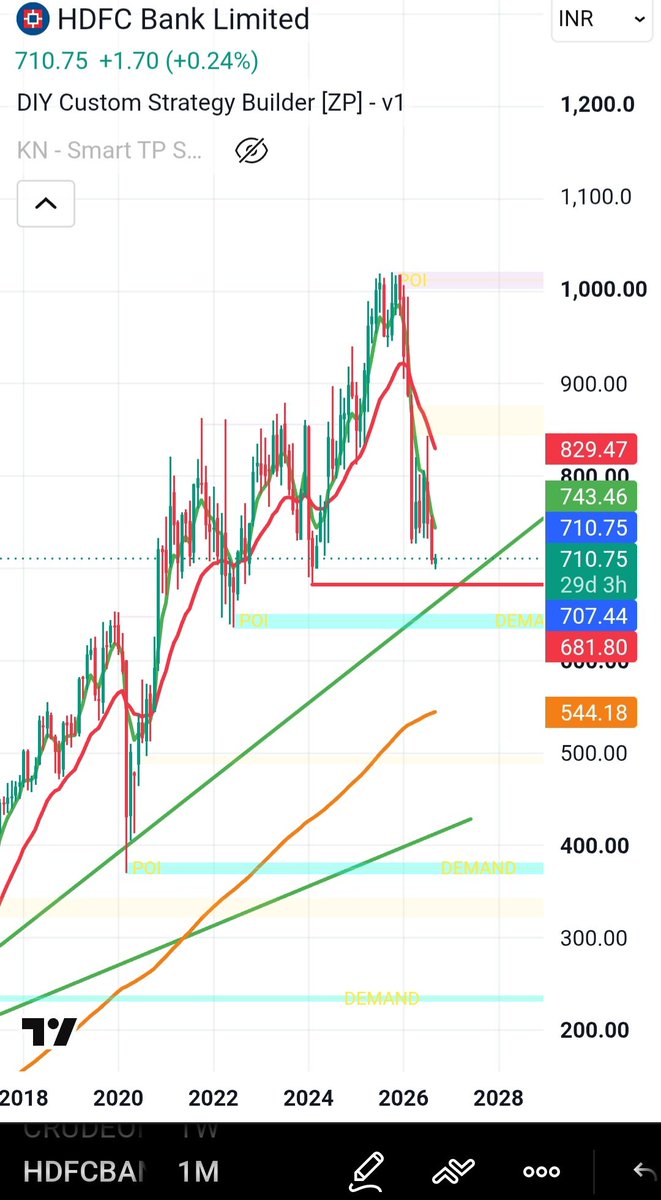
HDFC Bank Monthly Chart – HDFC Bank is trading at ₹710.75 after a sharp correction from the 2025–26 highs near ₹1,020.
Key observation from the 1M chart:
The long-term rising trendline (drawn from the 2018–2020 lows) is still intact and currently acting as major support. Price is sitting right around this trendline 680–711 zone.
Key Levels break or bounce from :- 680 or trendline )
Strong demand zone: 544
Resistance / bounce targets: 743 then 829
What’s your view — will the trendline hold and give a bounce, or do you expect more downside first?
Drop your levels below.
#HDFCBank #HDFCBANK #TechnicalAnalysis #StockMarketIndia #BankNifty #Nifty50 #Investing #TradingView
(Not financial advice. Do your own research.)
Looking to DOUBLE your capital in 7–8 years with moderate-to-low risk? 📈
Is there a realistic investment that can actually do this without taking crazy chances?
Drop your strategies below 👇
#Investing#WealthBuilding#FinanceTips#CompoundInterest#StockMarket#IndexFunds #PassiveIncome #FinancialFreedom #RuleOf72 #LongTermInvesting
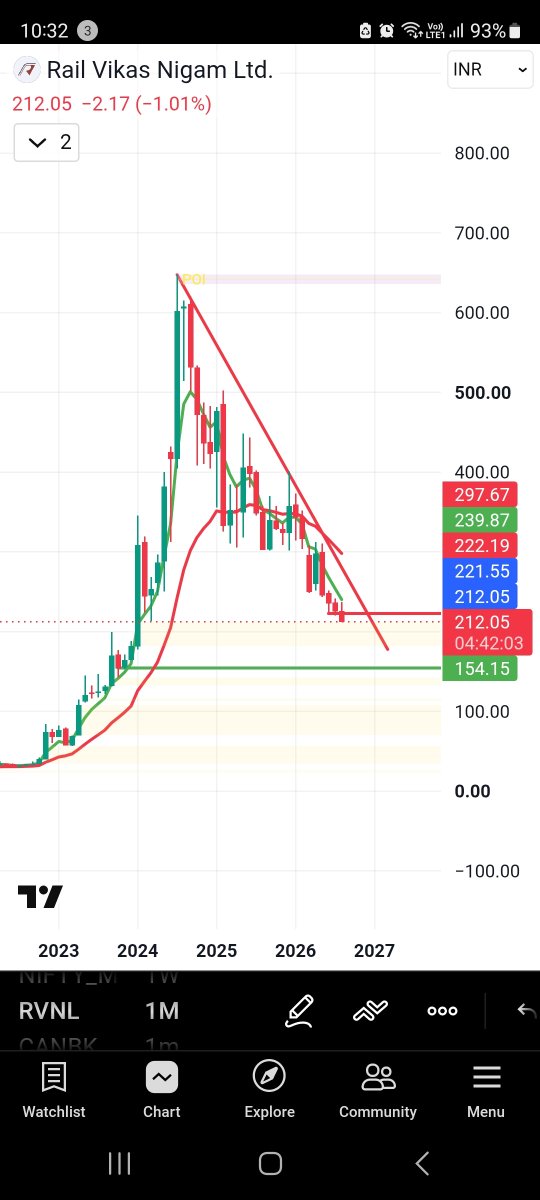
@BaijuBears 154 is my support in Monthly , 199 in weekly support zone. Wait and watch only. (Scope only in railway separate budget will help to move positive)