$BTC HAS FOLLOWED THE SAME CYCLE FOR 13 YEARS
Bull phase: ~1,450 days
Bear phase: ~365 days
Every. Single. Time.
2013 top -> -86% in 365 days
2017 top -> -84% in 365 days
2021 top -> -78% in 365 days
2025 top -> -64% in 365 days (projected)
Projected bottom: October 2026 -> $41,400
The cycle isn't broken
We are still inside the red box
Follow me + Notis on i'll keep you updated !
Bitcoin is still in the Bear Cycle.
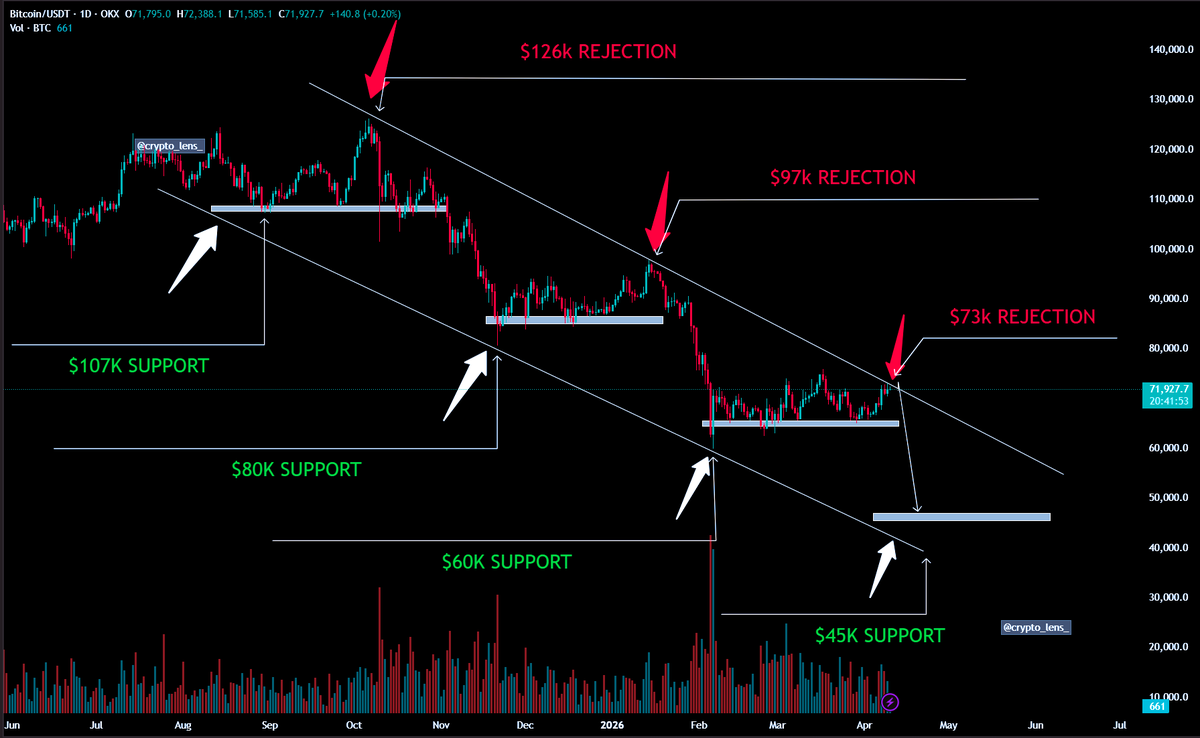
History is repeating itself, and this is how $BTC will play out over the next few weeks:
$73K → $61K → $47K → $55K → $45K
Save this chart and compare later.
HISTORY NEVER LIES
The trendline doesn't care about your bias
We hit the ceiling - now we moving to the floor
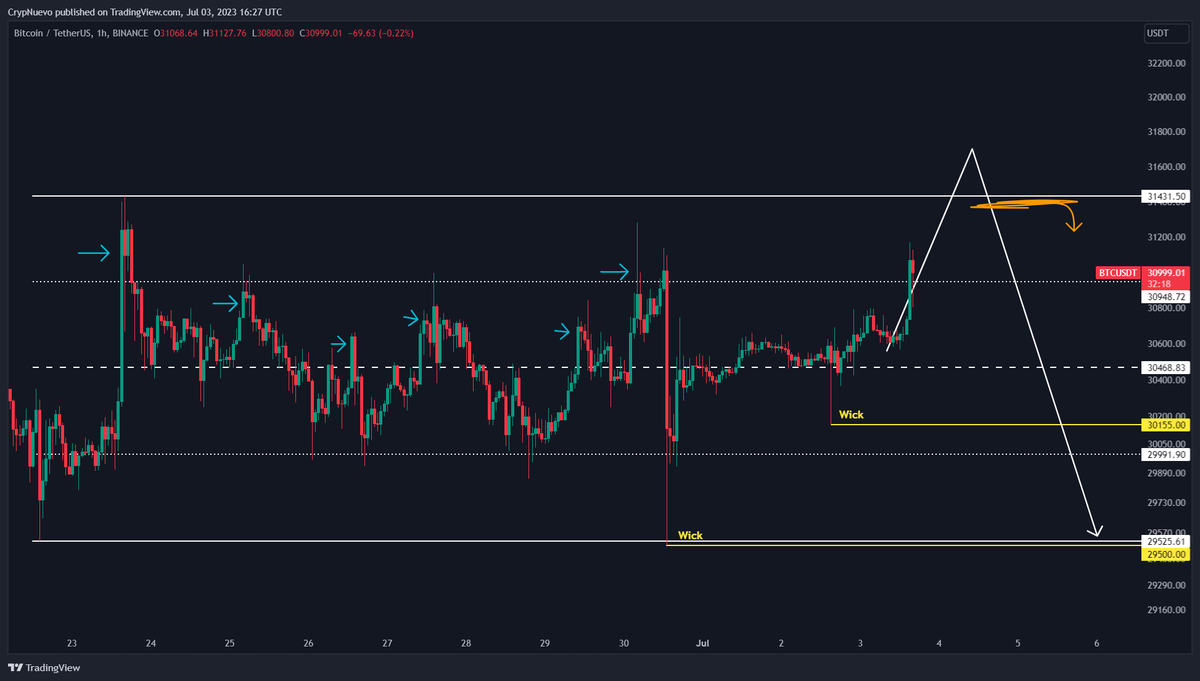
It happened in 2019
It happened in 2023
It’s happening now
POSITION ACCORDINGLY!
🚨 BTC CYCLICAL FRACTAL
The math is getting scary accurate
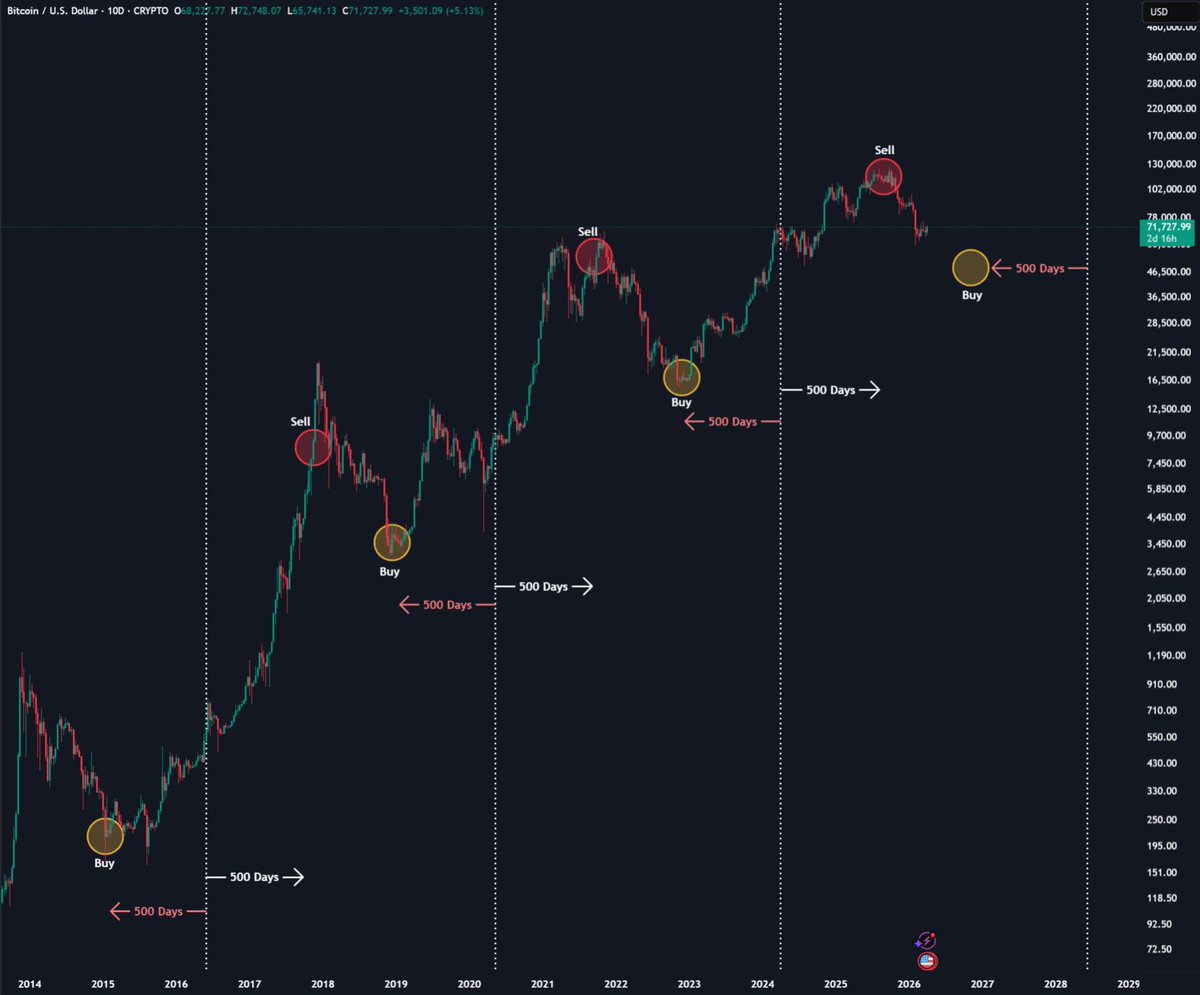
Every 17 monthly bars, the cycle shifts
- 517 days of accumulation
- 518 days of vertical expansion
THIS IS JUST REALITY
TURN ON NOTIFICATIONS!
This chart has perfectly predicted the current Bull Trap to $72K.
We’re exactly halfway through the bear cycle, and $BTC will dump to ~$41,000 in May.
Bookmark this chart and check back in 6 weeks.
I have cracked the fucking code.
We bottom this year August-September latest. Earlier than previous cycles.
It then takes $BTC just under a year to create a new ATH.
Based on the math, we are 427 days from creating a new all time high.
And we are 120 days from creating a bottom. That means... we form a new ATH precisely between April and August 2027.
Based on this metric, we have completed 75% of the bear market.
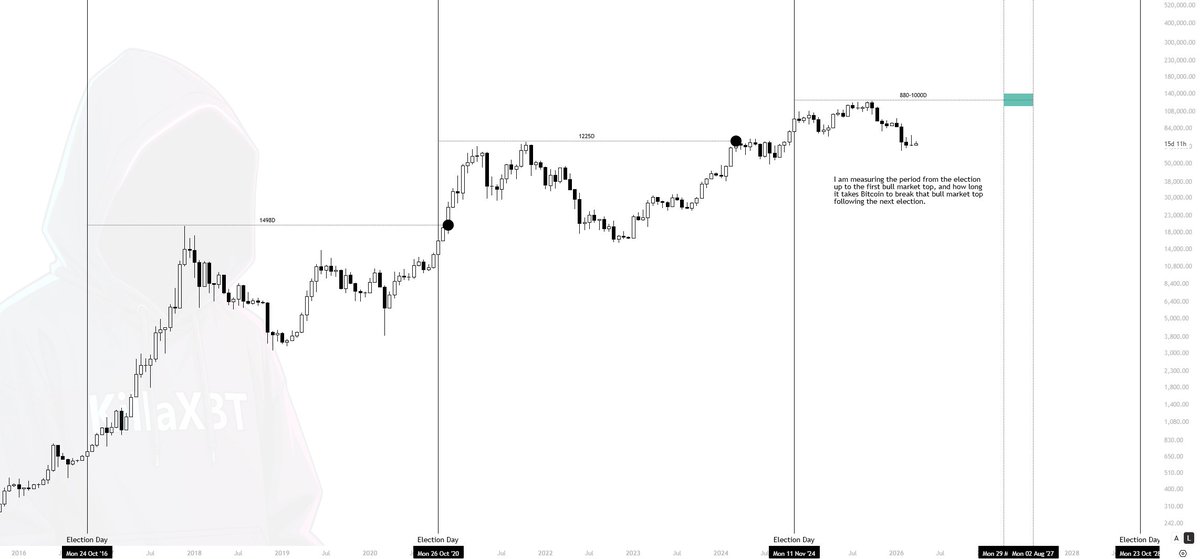
In this image, I am measuring the time from each election to the first bull market peak, as well as how long it takes Bitcoin to surpass that peak following the subsequent election day.
The cycles are accelerating, with shorter bear markets and faster recoveries.
In the next 1 year, I’m either going to look like a genius or a complete fool. This is my prediction based on current patterns and their timing.