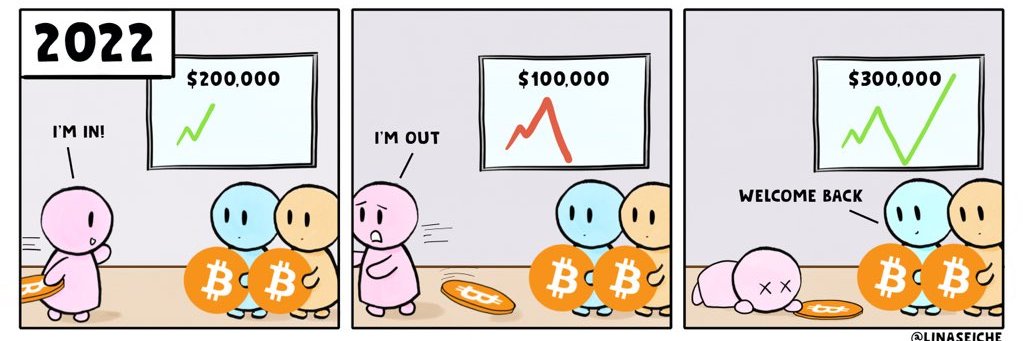
$BTC: After ten months of constantly warning Saylor to realize gains, Saylor finally admits that Strategy needs to sell their Bitcoin! Not at 120k, not at 100k, not at 80k, no he decided to do this at 60k, calling it the "Monetization Program."
Now watch this: Saylor dumping BTC to protect his stock and pay out the dividends. And watch what happens when the market forces him to sell lower and lower, as the market forced him to sell! The panic will hit bigger once people realize the amount of BTC he has to sell to protect his USD reserve of 1.25bn, the dividend payments, and the re-purchase of MSTR stock.
This happens after months of predictions, and the timing couldnt be better, its happening right where I am expecting a large capitulation event to happen. Guess what I believe will lead to this event ? Good luck everyone.
The four year cycle strikes again.
Bitcoin just had a weekly close below the 200W moving average.
The first time it closed below the 200W moving average in 2022 was also in June.
$BTC bearish divergence marked the top in 2021 and 2025.
Now, Bitcoin had its first bullish divergence in 4 years.
I'm sensing another generational opportunity here.
bitcoin:native
오랜만에 ICT 기반으로 차트 훑어보기.
비트코인은 급락 후 68k에 채 도달하지 못하고 ʙᴘʀ을 형성하고 이를 스윕하며 재차 하락함. 60k 아래, 58k 부근의 유동성을 스윕한 ᴛᴜʀᴛʟᴇ sᴏᴜᴘ🐢 를 보여주며 하락이 일단락 됨. 그 과정에서 명확한 일봉급 RSI 상승 다이버전스가 포착되고 있음. 주말 PA라 차주 개장이 되어봐야 명확하겠지만 현 시점에서 하락세가 진정되었다면 여기서 주의깊게 봐야할 부분들은 다음과 같음.
- 62k
4시간봉으로 보면 확인 가능한 sʀ ғʟɪᴘ이자 ᴍss를 만들 수 있는 62k를 돌파지지 해줘야 함. (ʜʜ 형성)
- 68k
최소한의 추세전환을 확인 후 롱을 진입했다면 1차 ᴛᴘ로 잡아야 할 곳은 전체 하락분의 0.382 되돌림이자 ʟʜ ʙsʟ이 있는 68k 부근임.
- 75k
68k를 돌파해준다면 그 위는 72-73k 부근까지는 LVN으로 빠르게 돌파가 가능하며 해당 구간의 ᴘʀᴏᴘᴜʟsɪᴏɴ ʙʟᴏᴄᴋ과 형성되어 있는 ᴇǫʜ를 2차 ᴛᴘ로 잡아볼 수 있음.
그리고 해당 구간에서의 롱 익절 및 숏 진입에 따른 일정부분 하락이 나왔을 때 눌림롱 진입도 가능함. 왜냐면 해당 ᴇǫʜ의 위에는 ᴍɪᴛɪɢᴀᴛɪᴏɴ ʙʟᴏᴄᴋ과 ғᴠɢ이라는 보다 주효한 유동성이 위치해있어 하락을 해당 구간 도달 전의 곰을 가두기 위한 ɪɴᴅᴜᴄᴇᴍᴇɴᴛ로 해석 가능하기 때문임.
또한 이 구간은 전체 하락구간을 0.618-0.786으로 되돌린 피보나치 ᴏᴛᴇ 구간에 있어 매도세가 생각보다 거셀 수 있음.
- 82k
연중 반등의 최고점이며 해당 구간을 돌파하느냐에 따라 비트코인의 연내 ᴀᴛʜ 돌파 여부가 결정된다 생각함. 큰 숏을 위해서든, 진짜 롱으로 가기 위해서든 '반드시 도달하여 전투가 벌어질 구간'이며 작년 말부터 2월까지 거래됐던 매물대가 위치한 곳이라 심한 저항이 기다리고 있음. 개인적으로는 이 구간에서의 ᴍᴀɴɪᴘᴜʟᴀᴛɪᴏɴ에서 먹을 게 많을 것이라 기대하고 있음.
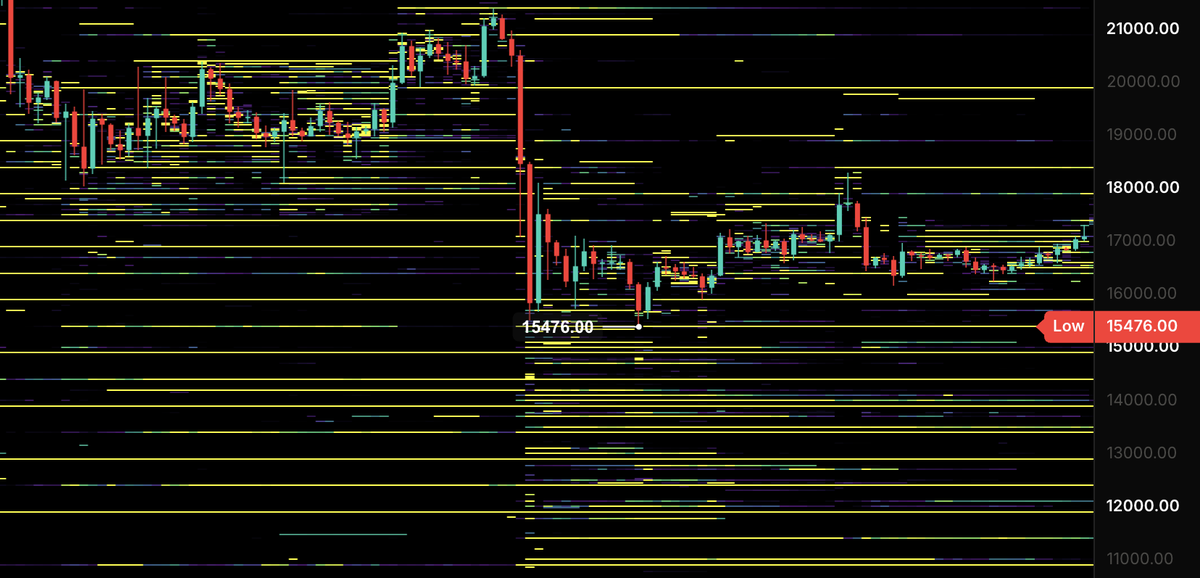
2026 Bottom vs. 2022 Bottom
We’re either still in the pre-capitulation phase, meaning we see one final capitulation wick into the 54K–44K zone.
Or
If we're already in the capitulation phase, then the 54K–44K bids could play out similarly to the 10K–12K bids in 2022 that never got filled.
Either way, the downside from here is limited.
We're either looking at another 10–15% to the bottom, which, in my view, is insignificant in the bigger picture, or we're already within 5% of the bottom.
$BTC BOTTOM IS WRITTEN IN THE VOLUME
You know what the 2018 bottom looked like in real time?
Everyone was exhausted
Nobody wanted to talk about Bitcoin anymore
But then - one single candle printed with volume nobody had seen in months
Violent, sudden, unmistakable
Price never came back to that level again
Then we saw 2022. It was identical
Same exhaustion, same silence, then the same candle
Smart money absorbed everything retail threw at the market in one session
And that was it
Now look at where we are
Yep, here again
But the sudden candle hasn't printed yet
When it does, you'll know
That's not a price target, not an RSI level, not a CT sentiment shift
Just one candle
The people who recognize it will be the ones who actually act on it
Dont forget:
I called the $BTC crash from $126k before it happened - publicly, on this page
Every local move since then - mapped out here too
The next update is the most important one this cycle - we're approaching the level where the real bottom forms
Follow now to not miss the update - turn on notifications to see it first
Bitcoin is playing out exactly according to plan.
This pattern has repeated perfectly.
2015 ATL → 2017 ATH = 1,064 days
2017 ATH → 2018 ATL = 364 days
2018 ATL → 2021 ATH = 1,064 days
2021 ATH → 2022 ATL = 364 days
Now look at the current cycle.
2022 ATL → 2025 ATH = 1,064 days
That placed the cycle top on October 6, 2025.
And $BTC topped exactly there.
Now the next part of the pattern gets even worse.
2025 ATH → 2026 ATL = 364 days
That points to October 5, 2026.
History is repeating itself day for day.
People want to believe this time is different.
But the cycle is still playing out exactly according to plan.
🚨 THE MOST RELIABLE BTC BOTTOM SIGNAL JUST TRIGGERED
The weekly bullish divergence on $BTC is confirmed.
Price: lower lows.
RSI: higher lows.
The last time this triggered, it marked the bear market bottom.
A second divergence with lower price is still possible.
But for the first time in months, momentum is starting to turn.
We are getting close.
THE MOMENT EVERYONE GAVE UP ON BITCOIN WAS THE BOTTOM.
And it just printed at $60,000.
Same thing happened in 2018.
Same thing happened in 2022.
Maximum fear.
Maximum doubt.
Maximum capitulation.
Then the bear market ended.
The people who bought when everyone was screaming doom…
Were the ones who changed their lives.
$60,000 was that moment.
The bear market is over.
The next chapter starts now.
Coba perhatikan ini…
Garis putih adalah M2 Money Supply
Garis orange adalah harga Bitcoin
Garis ungu adalah Bitcoin Cost Production.
Kejadian ini jarang terjadi, karena biasanya dari dulu bitcoin:native selalu mengikuti arah dari kenaikan M2 Money Supply.
Karena sebagian besar asset di dunia ini selalu mengikuti arah M2 Money Supply. Kenapa S&P500 & Nasdaq masih terus naik ? Karena ini M2 Money Supply belum menukik turun dan seharusnya bitcoin:native juga begitu namun ini anomali.
Yes saya tau kok bitcoin:native ada yang namanya 4 year cycle.
Tapi apakah nanti jika M2 Money Supply menukik turun, lalu bitcoin:native tetap bisa naik saat cycle bear marketnya sudah selesai?
Kondisi saat ini M2 Money Supply masih naik namun $BTC sudah dibawah turun jauh. Apakah ini yang dinamakan undervalue?
Coba sharing dong yang tau, mari belajar bersama 😁🙏🏻
🚨EVERYTHING IS PLAYING OUT EXACTLY AS I TOLD YOU
And this is only the beginning for $BTC. Here's how the chart will move:
$79k → $84k → $60k - DONE
$60k → $63k → $41k
$41k → $85k → $180k
Keep in mind: I’ve called every major market top and bottom for over 10 YEARS.
I was one of the only people who called the top in October, and I’ll do it again.
That’s literally my job.
If you still haven’t followed me, you’ll regret it.
$BTC 이제 7,8,9월 3달이 남았습니다.
7월 월봉은 5일선이 66-67쯤 될거에요.
그 말은 반등이 나온다면 66k정도의 반등이 나올 수 있다는거죠.
월봉 5일선의 저항을 받을거에요.
👉첫번째 사진은 제가 생각하는 시기와 매수존이에요.
👉9/12-10/14일 축과 박스의 매수존입니다
(이 시기가 역배열 교접이 다가오는 중요한 시계열구간입니다.)
100일가량 남았네요. 그 안에서 반등도 있고 하락도 있고 횡보도 기간도 있을거에요
과연 이번에도 저 구간에 도달할까요?👀
I'VE WATCHED EVERY BITCOIN BOTTOM IN HISTORY.
And this is not it.
Every real bottom had one thing in common.
Volume. Panic. Fear.
2015: Volume exploded. Then 10x.
2018: Volume exploded. Then 20x.
2022: Volume exploded. Then 8x.
2026: Dead silence.
No volume. No capitulation. No bottom.
Real bottoms don't form in silence.
They form when people are throwing up on their keyboards.
We haven't seen that yet.
The real bottom is still ahead.
I've seen this movie before.
And I know exactly how it ends.
I’m being totally honest.
If you’re in your 20s or 30s,
Go all in this crypto bull run.
Cut your expenses.
Block out distractions.
Fuck “work-life balance.”
Do you want to be rich or not??
This is the time to grind.
Opportunities like this won’t come again.
I don’t care if you listen or not.
But for that one person who does,
Make it happen.
Bitcoin dumped to $59K for a reason.
History is repeating itself, everything going exactly as I predicted:
After resistance at $82K was rejected, we saw a huge dump. Right now $61K resistance also rejected. Based on 2 brutal rejections $BTC dumps like this:
$59K → $53K → $48K → $55K → $42K
Next stops:
→ $53K in days
→ $42K by July
I called the $126k top in October 2025 and $15k bottom in November 2022.
If you missed those calls, don't worry. I'll call the next one too.
Follow now. I'll call every major move.
Buying $ETH heavy at $1070-$1370
Dont think it goes much lower. Everyone expects $ETH to bleed harder than $BTC from here, but its already insanely oversold.
So im taking the other side. Quick on why:
ETH/BTC ratio is insanely low.
People treat this like $BTC vs some random coin. Its not. $BTC and $ETH are the same kind of asset - supply already out, no insider unlocks, 10+ years of nobody printing or rugging it. The only two real blue chips. The only question is which looks safer from here, and right now its $BTC holding most of the open problems.
The cleanest way to see it: the treasuries.
Strategy sits on 845k $BTC, paid for with stock and preferred that owes cash dividends. $BTC pays them nothing back, so they have to sell to cover it. Bitmine sits on 5.5M $ETH and stakes most of it, earning around 270M a year. Same drawdown, opposite situation. One bleeds to hold, the other gets paid to hold.
And thats the asset itself, not just the treasury. A third of all $ETH is staked and earning. $BTC just sits while its new supply gets sold by miners to cover power bills.
Last cycle the loud call was $10k $ETH. Never came. This cycle the loud call is "$ETH is dead", screamed right at the price where it stopped falling.
Im not betting against $BTC, i hold both. I just think the one everyone gave up on is the one that pays u to wait.
Thats why im buying here.
DCA 1370 to 1070 3/4 at 1070. Out under 800.