And here you are, without having time to look back, become a victim of your own style. You lose grip and connection with the market.
The setup placed on the chart, even if you do not plan to enter it, will clearly show how well you see the market at the moment.
▪️ If liquidation is high enough, potentially locks into a new trend until it gets there. After all, the thinking “it will roll back anyhow” has long been in the subcortex. Formally, the markets have been falling for 600 days!
The glasses are empty, and the cascade of short liquidations in the moment is often critical. Do not forget that exchangers often also experience technical problems amid such volatility
(SOS) - the price grows, leaving the sideways channel. The force driving it increases. Volumes are also growing.
Phase #5
It is the last stage in the accumulation model. It is marked by a breakout of the flat, due to an increase in demand in the market.
Phase #4
Shortists recruited in phase #3 begin to be liquidated forming strong impulses.
(LPS) - the last point of support, a rollback to support levels, which used to be resistance.
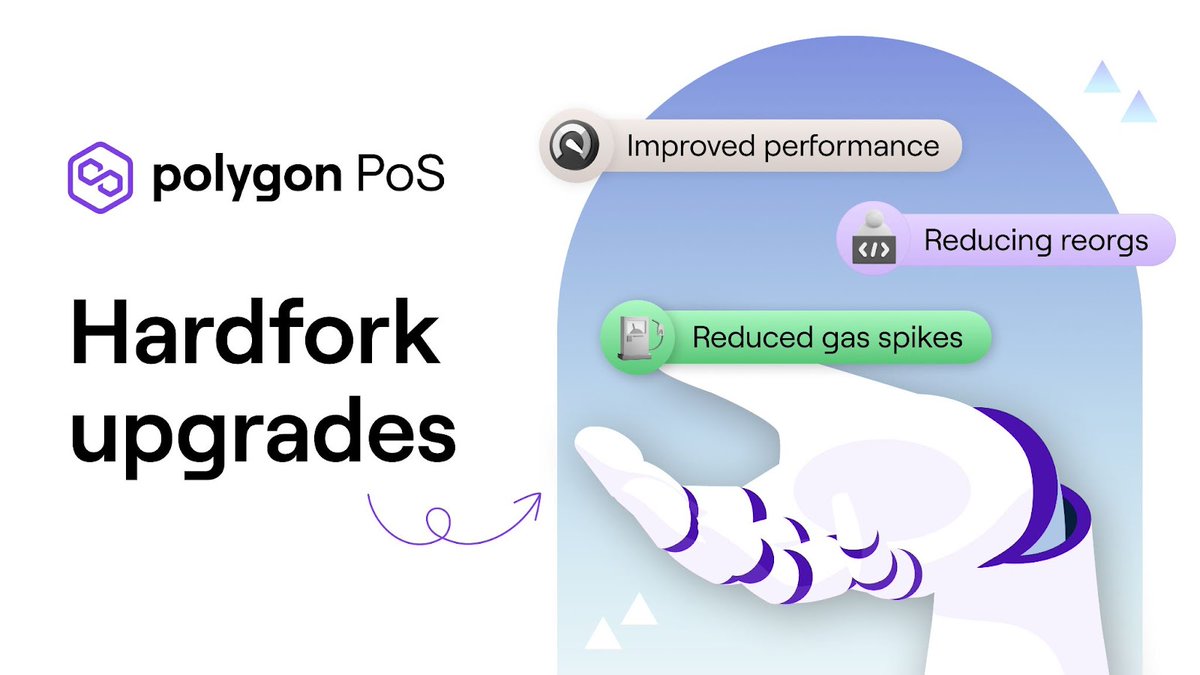
📢 GET READY FOR THE HARDFORK 🔥
The proposed hardfork for the #Polygon PoS chain will make key upgrades to the network on Jan 17th.
This is good news for devs & users -- & will make for better UX.
You will NOT need to do anything differently. Details:
https://t.co/RaBWDjEGrI
Superstocks - in this book, the author shares his life story and describes his trading strategy, as well as many invaluable lessons he has learned from his 16 years of experience as an independent trader at the time of the publication of the book in 2013.