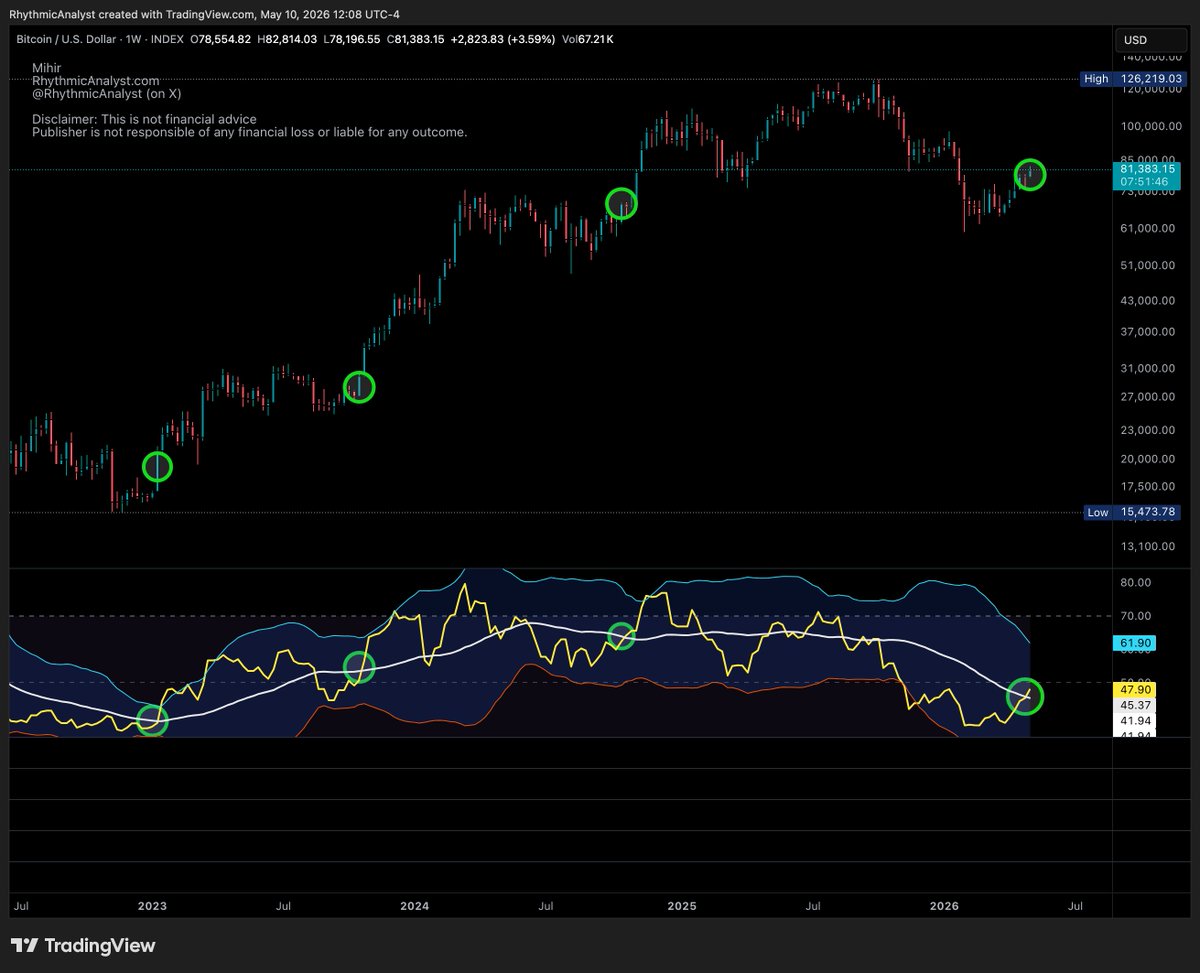
BTC update: Added labels for more clarity.
The current price level is a prior rejection zone - that makes it a major resistance zone.
The breakout level from the indicator point of view becomes a support zone near $72k.
#Bitcoin $BTC #Crypto
BTC got a nice-looking weekly green candle.
Oscillator is showing positive divergence (refer yellow path on a price chart and oscillator - the price is flat and oscillator started moving up).
Pullback was the deepest — rested at the Feb low. However, there was no lower close. 👍
The ongoing bounce has to break above $88k to regain strength. So far, so good.
#BTC $BTC #Crypto #Bitcoin
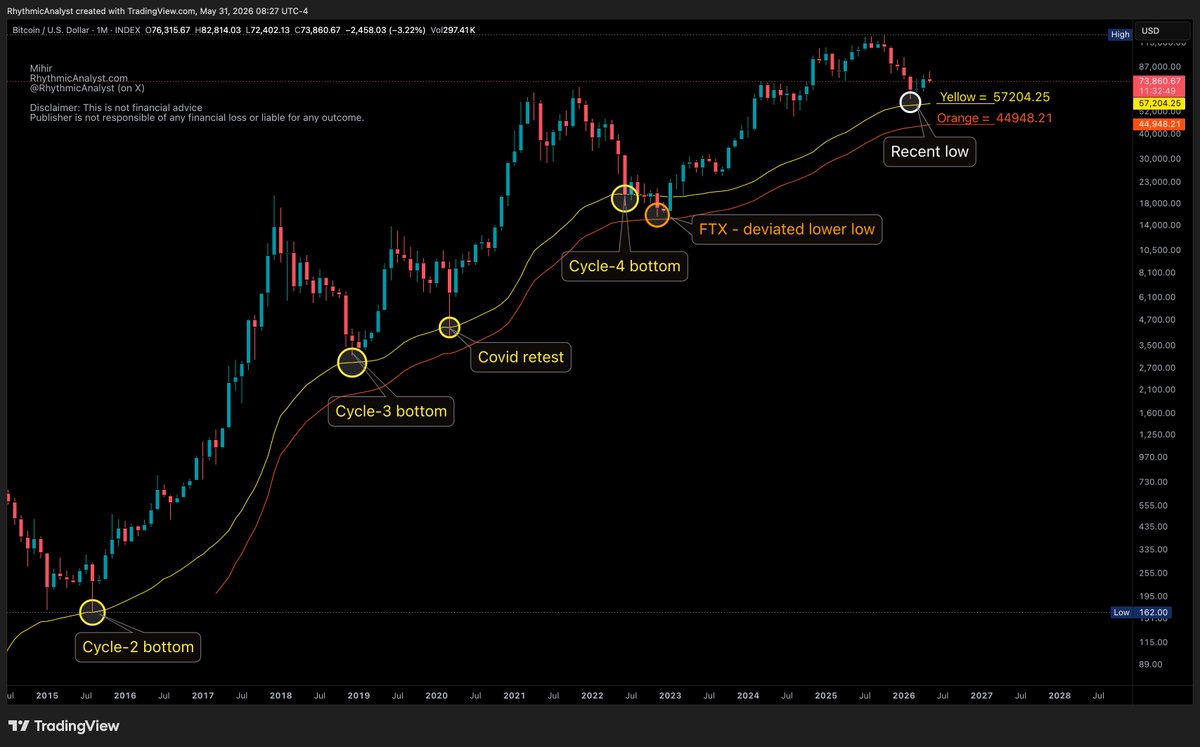
Bitcoin Bottoms: All Major Lows on the Same Line
Every major BTC market bottom has touched the exact same long-term support line (yellow circles).
Only FTX was different — it dipped to the lower orange level in panic.
In February 2026, price returned and retested that yellow line again.
Interpretation: This is classic structural support. Repeated respect across cycles shows strong buyer demand and often marks the end of corrections — a high-probability accumulation zone.
Past patterns aren’t guarantees. Not financial advice.
#Bitcoin #BTC $BTC #Crypto
BTC Trend Update:
Technical Analysts use multiple methods to confirm the trend before taking a final stance.
Here is one more method that shows why the February low was critical.
Refer to the white circles marked on the support line.
This view clearly captures BTC’s ongoing uptrend — the major support level established in 2023 held firm during the February 2026 dip.
This confirms that the uptrend remains fully intact. It also reinforces that $60K continues to be the most critical support level for the current uptrend.
#BTC #Bitcoin $BTC #Crypto
Major BTC Update 🚀
In February 2026, the $60k support level marked a potential bottom. After that, BTC climbed to $82k this month and is currently trading near $76k.
👉Holding above the February low keeps the next major resistance around $239k in play.
No need to believe it — we’ll see how it unfolds. 😉
#BTC $BTC #Bitcoin
BTC update:
Another one of my custom indicators has turned bullish.
The yellow line has crossed above the orange line, and price found solid support at their confluence zone this weekend.
If someone prefers to stay bearish, that’s their choice.
#Bitcoin#Crypto $BTC #BTC
The 200-day moving average is widely used as a key level by many analysts. However, I’ve noticed it can be less reliable than it appears at times.
Here’s what the chart actually shows:
👉 Blue line = 200-day MA
👉 Red boxes = multiple false breakdowns
👉 Violet circle (Jan 2026) = price was rejected, but the 200-day MA didn’t play a significant role
👉 Orange circle = another test where the retracement was quite shallow and stayed well above the April low
Interestingly, the March retracement was actually deeper than the recent one.
While the 200-day MA does get respected sometimes, it has also produced several false breakdowns even when the overall trend had strong upward momentum.
It can still be useful as a general reference point, but I personally don’t rely on it as a primary level.
Just sharing a different perspective based on the charts.
#Crypto #TechnicalAnalyst #200MA #Bitcoin #BTC $BTC
1992 crash - took more than 12 years before a nice clean high, 2000 crash was part of the same.|
2007-09 financial crises recovery took 6 years.
You can not count the move from the absolute bottom as hardly anyone can buy it there - you have to count when full recovery is complete.
$84K acted as weekly support based on this moving average indicator.
After a downward leg, the price has returned to the breakdown zone—often referred to as a post-breakdown pullback, a common recovery attempt.
BTC did not establish a new high, as previously noted, and is now approaching a critical test within the $78K–$82K range, which represents a strong resistance zone.
This level also coincides with a weekly CME price gap.
BTC is now at a key inflection point.
A failure to break above this zone may lead to a downside move, while a successful breakout may indicate a potential recovery.
So far so good. 👍
#Bitcoin #BTC $BTC #Crypto
This mega channel of BTC is still valid as its trend is not broken.
Price takes detour sometimes when it faces unfavorable fundamentals such as tariff and war.
$BTC #Bitcoin#BTC
BTC is indicating a bottom. 🙏
This assessment is based on various technical analysis methods I have shared recently.
$64K is a key support level.
[Your may repost for your followers.]
#Bitcoin $BTC #BTC
This analysis of BTC price action is based on a moving average and a consolidation pattern on the 1-week timeframe.
In February, Levels 1 to 4 were shared a day before BTC reached the $60K range (you may refer to the earlier post).
The price attempted to recover, but Level-2 rejected the move this month. Last week’s red candle has hinted at a new consolidation pattern, which appears constructive.
Refer to the yellow path for its projected shape.
Note: This pattern remains valid only if the price stays above Level-4.
#Crypto #BTC #Bitcoin $BTC
Some analysts or experts are calling BTC bounce as dead-cat bounce.
Dead cat bounce is confirmed only when bounce fails to reach a certain height. One cannot conclude while the bounce is on. It shows person's bias, not real analysis.
#Crypto $BTC #Bitcoin
A gentle reminder:
BTC didn't break its up-trend, and still up.
Yes - it was on edge (like I said, in ICU), but not dead.
It is not what about what I expect or wish, but what technicals are indicating.
Refer the white boxes to understand trend support zones and how it is making progress.
#Bitcoin #BTC $BTC #Crypto
The process of top includes two steps as well:
1. Resistance
2. Critical depth of correction
Often analysts/traders call out top on rejection near a resistance or before breaking below a critical depth.
Calling out BTC top is a classic mistake at the present level.