Top Tweets for #50daysofDatawithWiDA

Yesterday was Day 50 of #50daysofdatawithWiDA and here is how the rest of the challenge went.
- I took my CSM certification and passed with a 98% (Now a certified Scrum Master😌)

Day 26 of #50daysofdatawithWiDA
- Continued data analyst in python track on Datacamp
- Took more practice tests for my csm exam

Day 50✨ #50daysofdatawithWiDA We’ve finally come to the end of this challenge but Learning about data and putting whatever I’ve learned into practice would continuously be my watchword. Today I completed a mini-project on Exploratory Data Analysis on DataCamp and started the -👇🏽


🚀.
It is day 50 of our #50daysofConsistencywithWiDA #50daysofdatawithWiDA 🥳.
Share with us in the comment section how the last 50 days have been for you, ✨.
#data
Day 48✨#50daysofdatawithWiDA
- I learned how SQL AUTO INCREMENT is used to generate a unique number when a new record is added to a table in a database.
- I also learned the different SQL Date Data types(Date, Datetime, Timestamp e.t.c).
- I learned how to create, replace and-
🥳.
This week marks the last week of our first #50daysofdatawithWiDA #50daysofConsistencywithWiDA
challenge of the year.
We are so excited for everyone that participated in this challenge and hope that we were able to achieve some of our goals.
Congratulations everyone,🥳.


Hi guys🤗,
Left or Right?
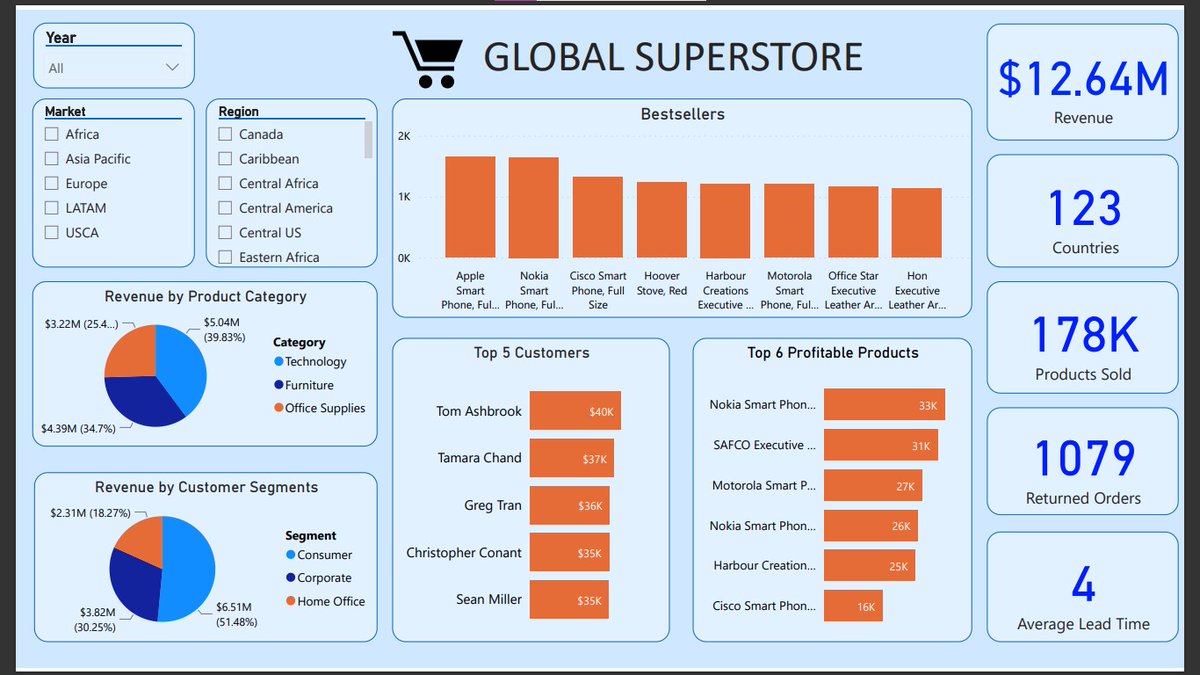
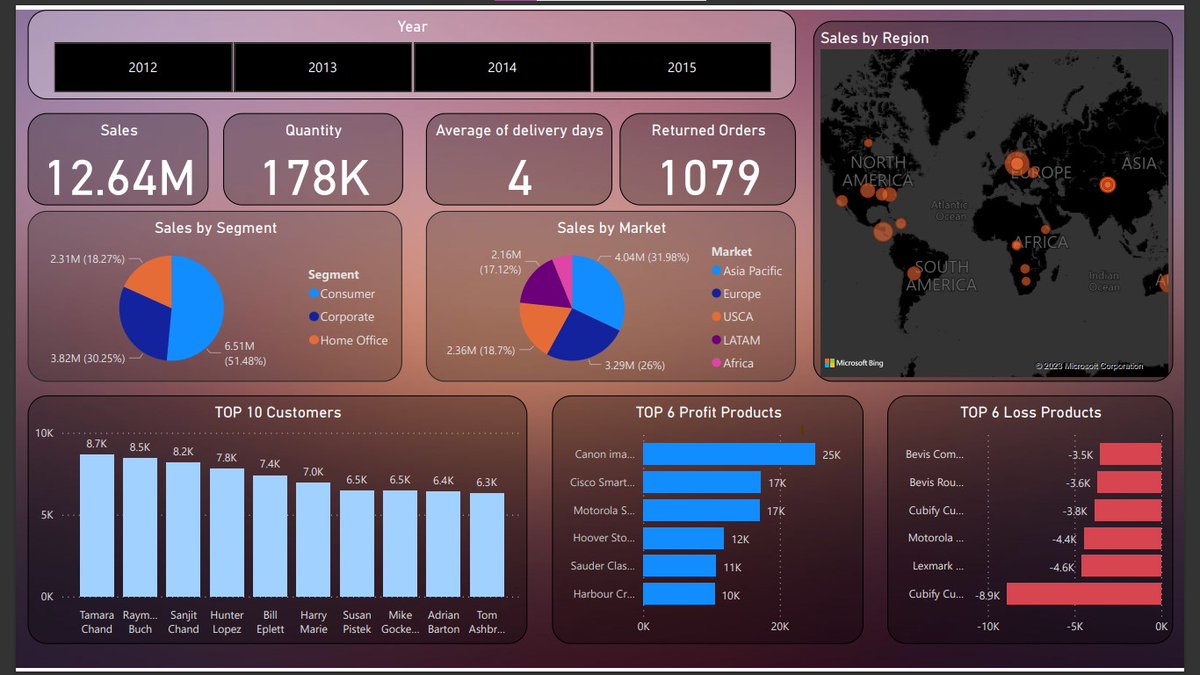
So the left is a step-by-step tutorial I did from end-to-end projects on Youtube, and then I decided to use the same dataset to make another dashboard myself. which is the one on the right. How'd I do?#50daysofDatawithWiDA
Day 36-40✨#50daysofdatawithWiDA
- Completed the book ‘High Performance Lessons from the Best on Becoming your Best’.
- Got the I4GxDataCamp Scholarship and revised the Introduction to python course.
- Did some data cleaning and visualization with data collected by my CAPSTONE
Day 35✨ #50daysofdatawithWiDA
- I completed the Google Data Analytics Course 2 - Ask Questions to Make Data-Driven Decisions.
- I learned how to create, drop, truncate and alter tables in SQL with the CREATE TABLE, DROP TABLE, TRUNCATE TABLE & ALTER TABLE statements.

Day 34✨ #50daysofdatawithWiDA
- I read lesson 4 of the book ‘ High Performance Lessons from the Best on Becoming Your Best’
- i learned about the various types of SQL Operators(Arithmetic, Bitwise, Logical, Compound & Comparison) and how they are used.
Day 33✨ #50daysofdatawithWiDA
- Learned how SQL NULL functions work in different DBMS: IFNULL(), ISNULL(), COALESCE() & NVL().
- I also learned how to create a stored procedure and how to execute it. I then moved to how to write comments in SQL codes.
- I continued Week 4 of-

#50daysofDatawithWiDA Day 33
I started the 8th and final course of my Google Data Analytics course and so far I have learnt about the importance of case studies and a portfolio. Case studies are practice data analytics projects & it's a common way the skills of DAs are assessed
Day 32✨ #50daysofdatawithWiDA
- I Continued Week 4 of the Google Data Analytics Course 2.
- Read Lesson 2 of the book ‘Lessons from the best on Becoming Your Best’
- Learnt SQL Case syntax and how it combines the WHEN, THEN & ELSE syntax.
#50daysofconsistencywithWiDA
#50daysofDatawithWiDA Day 32
To make dynamic documents with R,a file format known as R Markdown is user. These documents are records of analysis that helps you, your team mates and stakeholders understand what has been done in your analysis that led to a conclusion...
#50daysofDatawithWiDA Day 31
Annotation in ggplot2 is a good way to highlight important data point, make comments on data trends on the plot or it could explain the purpose of the plot. These annotations can be added as labels, titles, subtitles or arrows.
Day 31 ✨#50daysofdatawithWiDA
- I started the final week(Week 4) of Course 2 in the Google data analytics course.
- Started reading a new book ‘High Performance Lessons from the Best on Becoming Your Best’ by Jake Humphrey and Prof Damian Hughes and I completed Lesson 1 today.
Day 27-30✨ #50daysofdatawithWiDA
- I finished week 3 of the Google data analytics Course 2✨
- I completed the book ‘Atomic Habits’
One thing stuck with me: Building new/good habits will get boring but your ability to show up on those days when you don’t feel like is what makes
#50daysofDatawithWiDA Day 30
Still on visualization using R. Aesthetic as a core concept of visualization refers to the visual property of an object in a plot. They are of 3 types (color, shape and size) and they help to communicate the trends in the data.

#50daysofDatawithWiDA Day 29
R also performs visualization and there are different visualization packages such as ggplot2, plotly, Lattice, RGL,Leaflet,patchwork etc but ggplot2 seems to be the most popular amongst Analysts. ggplot can be interpreted as grammar of graphics...

Day 26 of #50daysofdatawithWiDA
- Continued data analyst in python track on Datacamp
- Took more practice tests for my csm exam
Day 25 of #50daysofdatawithWiDA
- Continued preparing for my scrum exam
-Ended the day taking some practice cam tests
Last Seen Hashtags on Sotwe
Most Popular Users

Elon Musk 
@elonmusk
240.6M followers

Barack Obama
@barackobama
119.2M followers

Donald J. Trump
@realdonaldtrump
111.7M followers

Cristiano Ronaldo
@cristiano
110.7M followers

Narendra Modi
@narendramodi
107M followers

Rihanna
@rihanna
97.7M followers

NASA
@nasa
92.2M followers

Justin Bieber
@justinbieber
90.9M followers

KATY PERRY
@katyperry
87.7M followers

Taylor Swift
@taylorswift13
81.5M followers

Lady Gaga
@ladygaga
73.1M followers

Virat Kohli
@imvkohli
69.9M followers

Kim Kardashian
@kimkardashian
69.8M followers

YouTube
@youtube
68.7M followers

Bill Gates
@billgates
63.9M followers

Neymar Jr
@neymarjr
62.7M followers

The Ellen Show
@theellenshow
62.4M followers

CNN
@cnn
61.9M followers

X
@x
60.8M followers

Selena Gomez
@selenagomez
60.8M followers