Top Tweets for #ChartDesign

A lot of people think AI tools are only for writing, but they’re also great for images, tables, and presentations. Give clear input, and it can give you a version ready to use. @canva @OnvaEr33698 @NotionHQ #PresentationScreen #PresentationDeck #AiTools #ChartDesign

📺 YouTubeチャンネル始めました
プログラミング・Web開発の最新ニュースを毎週お届けします。
初回は「2026年第13週」のニュースをまとめました。
チャンネル登録よろしくお願いします👇
https://t.co/1SnWEQ4iD6
#プログラミング #Web開発 #エンジニア #YouTube #chartdesign

Build nested rectangle charts that expose hidden patterns in layered datasets. Discover techniques for hierarchical analysis. Learn more!
#TreemapinExcel #ExcelTreemap #TreemapChart #ExcelCharts #ExcelGraph #DataAnalysis #ChartDesign
https://t.co/l9td5F9b9A

Graphics design.
Stunning high-fidelity graphs and charts for a veteran technology startup's funding presentation.
#datadesign #chartdesign #graphicsdesign #statdesign
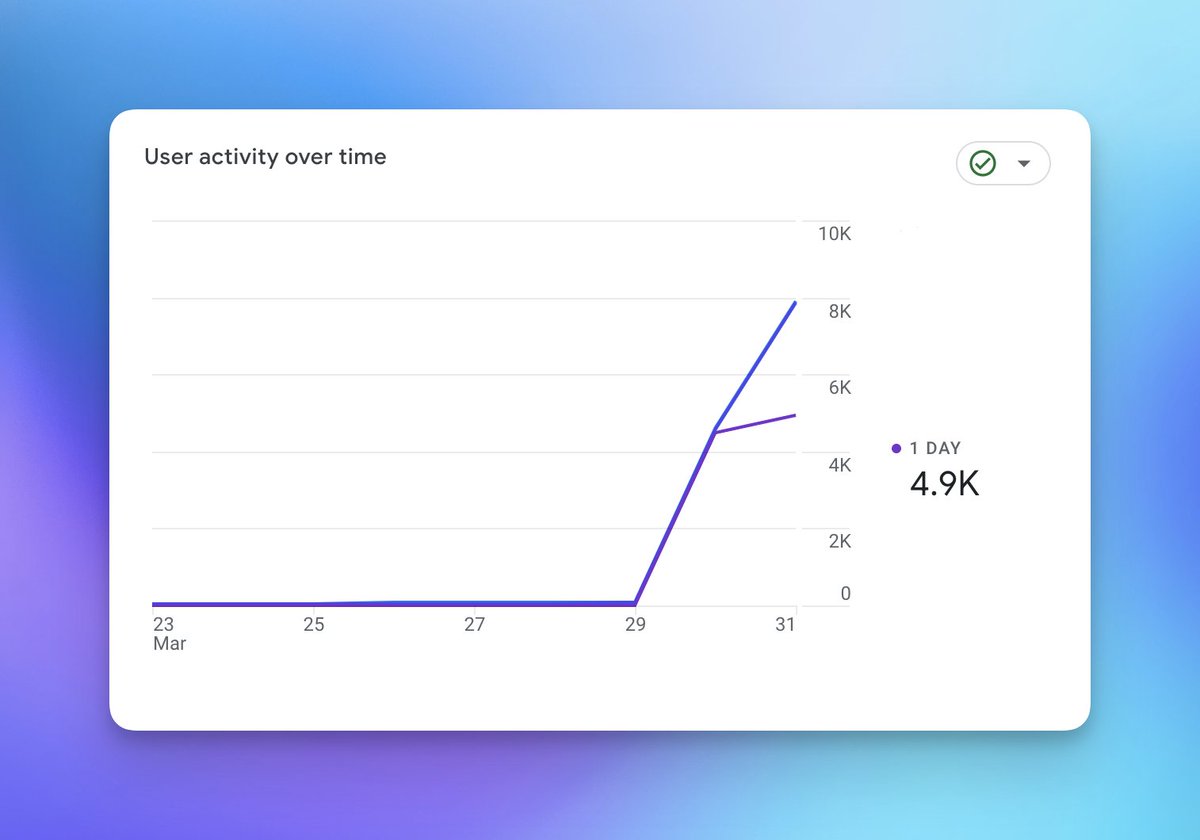
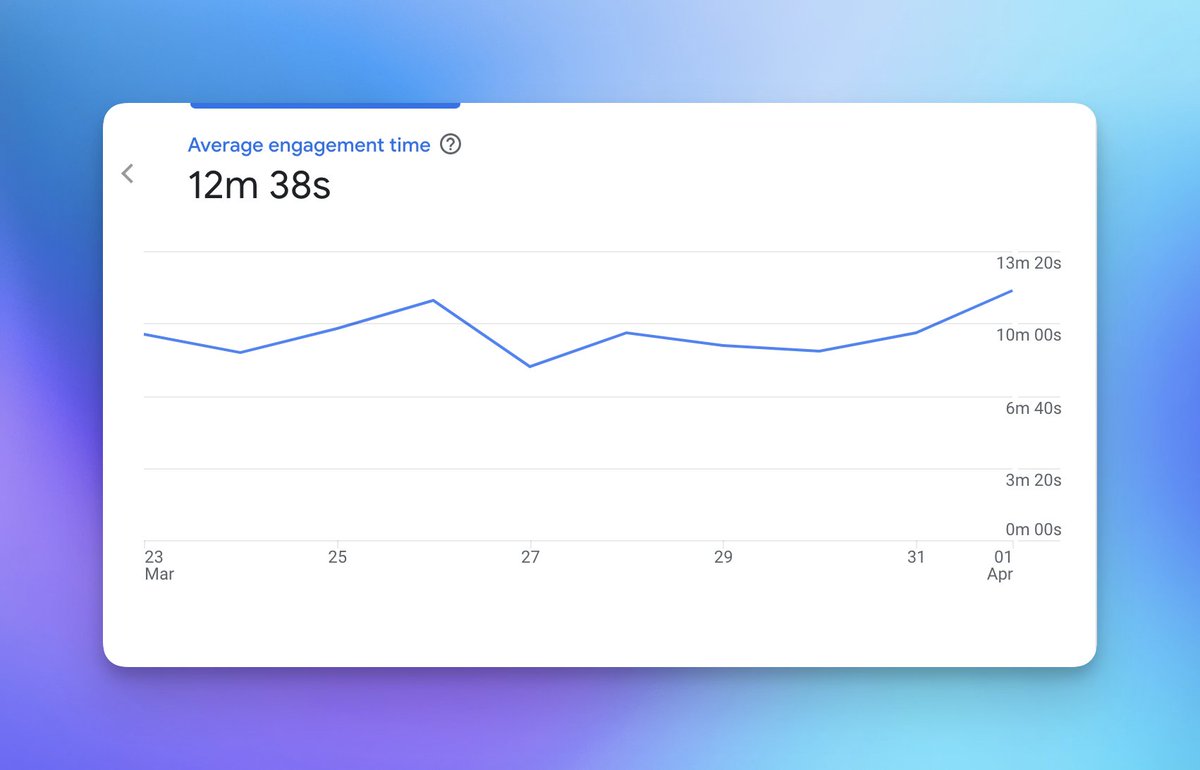


A small UI/UX project for a multichannel sales SaaS
featuring custom AI-driven charts & dashboard components.
Focused on clarity, speed, and conversion.
#saas #startupdesign #uxdesign #productdesign #aiux #uidesign #dashboarddesign #chartdesign #framer #designsystems

(4/12)
Choose the right chart 🧩
Wrong chart = wrong insight.
📊 Bars → comparisons
📈 Lines → trends
🟣 Scatter → correlations
🔥 Heatmaps → patterns
#ChartDesign #DataScience

Master the humble pie chart! 🥧📊 Our guide reveals the simple do's and don'ts for clear, impactful visuals. Stop confusing your audience. Start communicating effectively.
https://t.co/WQQq9nYGKj
#DataViz #MakeOffer #ChartDesign #PieChart #Business #Theo #Domain


OMG , after 3-4hours finally I finished this #chartdesign with #dataanalysis , crazy final #exam for this #MBAclass. By #HellenTang


🎨 Don’t love the chart colors? We hear you.
🛠️ Customization is coming — with new color palettes so your data looks your way.
💡 Got ideas? Send them our way!
🔗 https://t.co/GcQVjKMRQ0
#DealCharts #DataViz #CmdRvl #ChartDesign


📊New data wizard – FlowcastGPT🤖
Transform your data into beautiful charts without touching a design tool!
📌From pitch decks to trend analysis
💡Just type it… and watch the AI do the magic.
🚀Get started FREE!
#AIDiagram #AIChartGenerator #InfographicsTools #ChartDesign


Tornado chart shows which project factors matter most, helping teams align fast, reduce debates, and act decisively. Read on to see how it works!
#DataVisualization #VisualAnalytics #ChartDesign #TornadoChart #TornadoDiagram #DataViz
https://t.co/4TMorgJU3q

🚀 Create a clean Target vs Actual Chart in Excel in just minutes!
#Excel #ExcelTips #ExcelCharts #TargetVsActual #KPI #DashboardDesign #DataViz #MicrosoftExcel #ExcelDashboard #DataAnalytics #Productivity #SpreadsheetTips #AdvancedExcel #Office365 #ChartDesign #ReportingTools

🍭 What is a Lollipop Chart?
A Lollipop Chart works just like a bar chart—but with a twist! Instead of full bars, it uses a line and a dot to mark the value.
#DataViz #LollipopChart #PowerBI #Excel #ChartDesign #BusinessIntelligence #Analytics #CreateAndLearn #LearnData


Design Exploration - Analytics Dashboard UI Card
#figma #dashboard #autolayout #ui #uidesign #uiux #ux #uxdesign #saas #website #designer #chartdesign #sales

Histogram maker tips that avoid common chart mistakes and simplify data visualization. Want clarity without code or clutter? Get started with ease!
#DataVisualization #ChartDesign #HistogramMaker #HistogramChart #ExcelHistogram #ChartingTools
https://t.co/0KsmZ0NxJ7

💬 Client Testimonial
📊 This glowing feedback is from our London-based financial client. Need to transform detailed data into powerful visuals?
Let’s talk.
https://t.co/J23iryEmAq
#FinancialDesign #BVCA #ChartDesign #DesignForFinance #ClientTestimonial #VisualIdentity


📊In a data-driven world, bar charts stand out for their clarity and simplicity. Explore their definition, use cases, types, and tools—plus ready-to-use templates!
🤔https://t.co/HM2K5I1ukl
#BarChart #ChartDesign #data #flowchart


These chart types are simple yet powerful tools for communicating insights clearly and visually.
#Attached are the visualizations I created during this practice session.
@tableau
#TableauLearning #ChartDesign #DataVisualization #AnalyticsJourney

𝐇𝐨𝐰 𝐭𝐨 𝐃𝐞𝐜𝐨𝐫𝐚𝐭𝐞 𝐘𝐨𝐮𝐫 𝐄𝐱𝐜𝐞𝐥 𝐂𝐡𝐚𝐫𝐭𝐬?
Want your Excel charts to stand out? Learn quick and easy ways to decorate Excel charts for a cleaner, more professional look.
#ExcelTips #ExcelCharts #DataVisualization #ChartDesign #AI #AINews #AnalyticsInsight #AnalyticsInsightMagazine
Read More 👇
https://t.co/ZuXCCpe8Le

Last Seen Hashtags on Sotwe
fartanimation
Seen from Turkey
atakt129
Seen from United States
NoLimits #Teenage
Seen from United States
campodagraça2023
Seen from France
tocil smp
Seen from Singapore
spitting clip
Seen from India
andijames video
Seen from Turkey
randi mom
Seen from Germany
MariaNagai
Seen from Indonesia
scatmistress
Seen from Turkey
Trends for you
Most Popular Users

Elon Musk 
@elonmusk
240.1M followers

Barack Obama
@barackobama
119.3M followers

Donald J. Trump
@realdonaldtrump
111.6M followers

Cristiano Ronaldo
@cristiano
108.8M followers

Narendra Modi
@narendramodi
106.9M followers

Rihanna
@rihanna
97.2M followers

NASA
@nasa
92.1M followers

Justin Bieber
@justinbieber
90.5M followers

KATY PERRY
@katyperry
86.7M followers

Taylor Swift
@taylorswift13
80.5M followers

Lady Gaga
@ladygaga
72.1M followers

Kim Kardashian
@kimkardashian
69.3M followers

YouTube
@youtube
68.6M followers

Virat Kohli
@imvkohli
68.4M followers

Bill Gates
@billgates
63.4M followers

The Ellen Show
@theellenshow
62.5M followers

CNN
@cnn
61.9M followers

Neymar Jr
@neymarjr
60.9M followers

X
@x
60.9M followers

CNN Breaking News
@cnnbrk
59.9M followers