Top Tweets for #ChartingLibrary

Data at scale demands performance.
LightningChart JS smashes performance benchmarks:
• 4,030× faster data loading
• 1,511,700× better streaming
• Supports datasets 15,570× larger
Read more: https://t.co/QOZb6TMc35
#HighPerformanceComputing #HighPerformance #ChartingLibrary

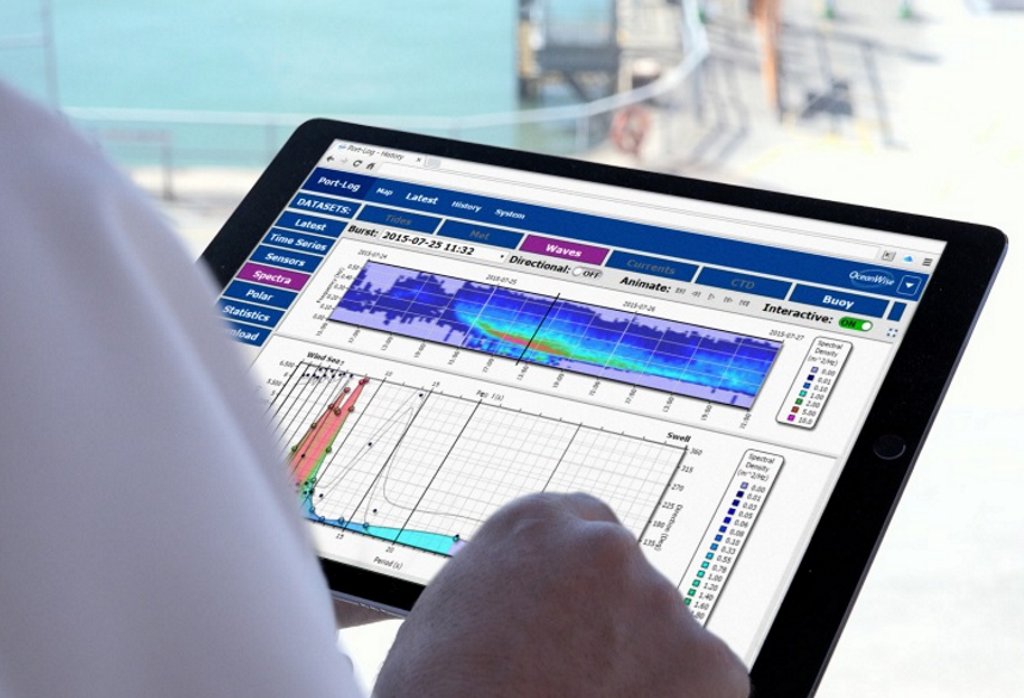
OceanWise Enhances Marine Data Visualisation with #TeeChart JavaScript
Blogpost: https://t.co/l3fPes0J2k
#datavisualization #marinedatamonitoring #environmentaldashboards #marinedata #chartinglibrary https://t.co/xBk9Eq2PxQ

Discover how OceanWise integrates TeeChart for JavaScript into its Port-Log and marine data platforms.
BlogPost: https://t.co/NitUmaP4pq
#datavisualization #marinedatamonitoring #environmentaldashboards #marinedatacharts #chartinglibrary
Visualizing Subsurface Data with Precision – Softdrill and TeeChart Integration
BlogPost: https://t.co/ct1PDNeu0E
#datavisualization #chartinglibrary #drilling #groundwater #geothermal #oilandgas #realtimedata

Unmatched performance is here!
#LightningChart JS v8.0 introduces a massive DataSetXY Rework, letting you handle up to 8 billion data points with ease.
Experience the power of high-performance #DataVisualization.
👉 Read more: https://t.co/iGKJJWxUsz
#ChartingLibrary #JSCharts

𝐋𝐢𝐠𝐡𝐭𝐧𝐢𝐧𝐠𝐂𝐡𝐚𝐫𝐭 𝐉𝐒 𝐯.𝟖.𝟎 𝐢𝐬 𝐡𝐞𝐫𝐞!
✅ New Legend System
✅ DataSetXY: 8B points, 2x less memory
✅ Reduce 63–245% real-time CPU use
✅ Point stroke, LUT formatter & more
👉 Read more: https://t.co/T2OAsRCqbc
#DataVisualization #ChartingLibrary #JSCharts

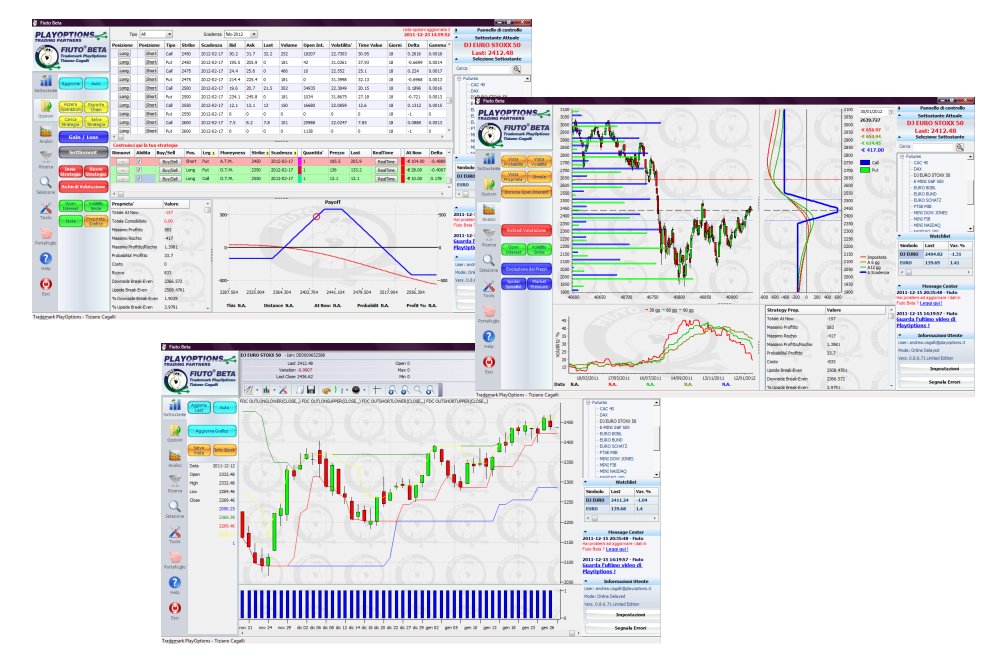
PlayOptions Trading Software Powered by TeeChart for .NET
BlogPost:
https://t.co/6K3jVf1HbZ
#chartinglibrary #datavisualitzation #trading #financialcharting #dotnet
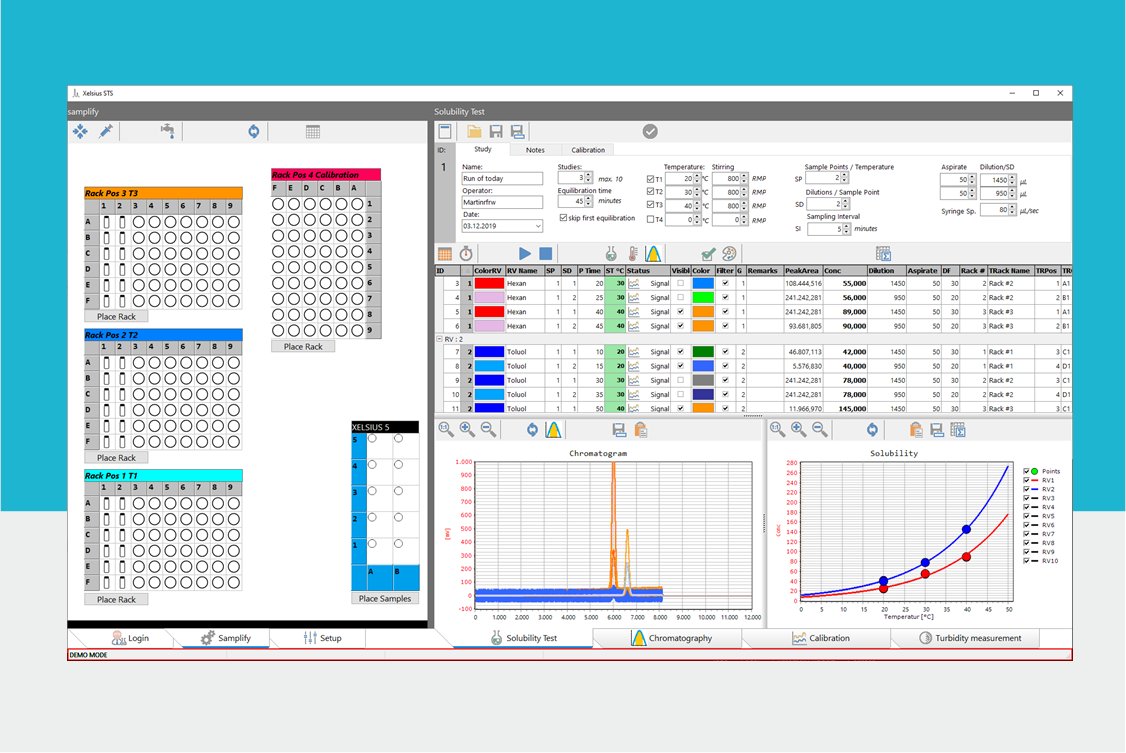
Leveraging TeeChart for Advanced Medical and Laboratory nevoLAB’ Software Solutions
BlogPost: https://t.co/lPZDr5fikn
#chartinglibrary #datavisualization #Chemicalprocessdevelopment #diagnosticinstrumentsoftware #Laboratoryworkflows #pharmaceuticalindustry
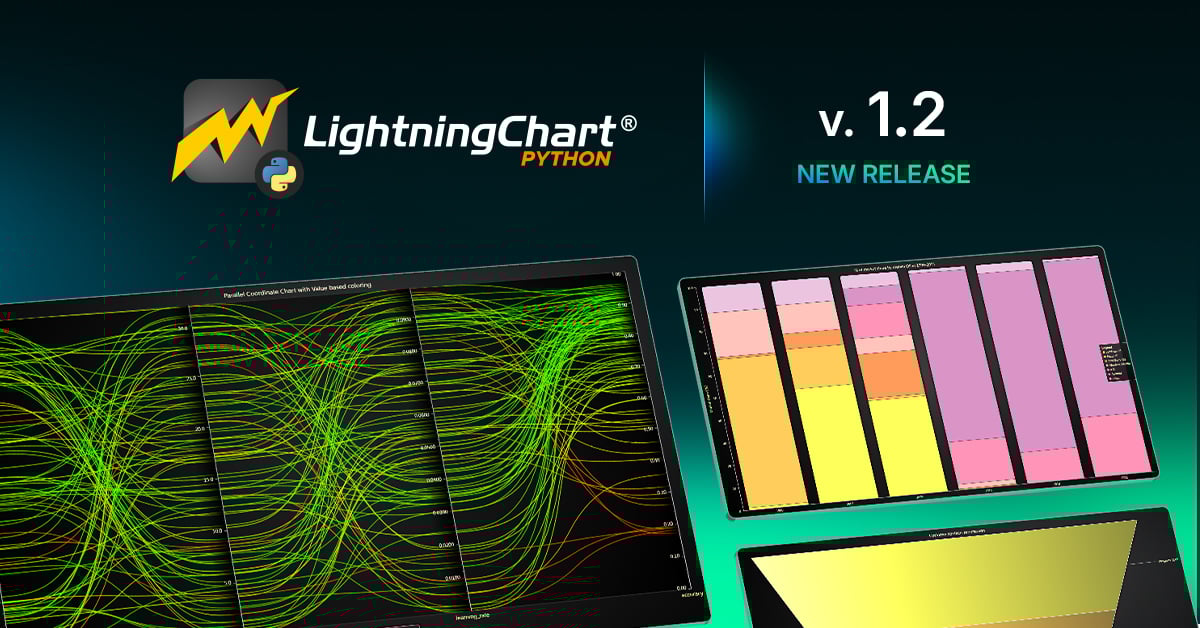
Need better chart styling in #Python?
#LightningChartPython 1.2 brings:
Unified interaction controls
Adaptive text & theme scaling
Enhanced parallel coordinate charts
📖 Release notes: https://t.co/s9mo8cMieo
💾 Download free version: https://t.co/EuPp0TorL0
#ChartingLibrary
Visualizing GitHub Contributions with TeeChart VCL: A Technical Walkthrough
Blogpost:https://t.co/8XuYBaaFpc
#datavisualization #chartinglibrary #charts #github

We’re powering up for #VizChitra2025 ! ⚡
Swing by our booth for:
🖊️ Dashboard contest – join & win prizes
💬 Chart Clinic – get expert viz help
📺 Live demos – real-time, high-performance speed charts in action
#LightningChart #DataViz #ChartingLibrary @VizChitra @hasgeek


Get your data viz game on at #VizChitra2025!
@Lightning_Chart is bringing high performance, insights & prizes!⚡
📍 Visit their booth to:
🖊️ Join the dashboard contest
💬 Get expert viz advice
📺 Watch real-time charting demos
#LightningChart #DataViz #ChartingLibrary @hasgeek

How do you efficiently process financial datasets for trading applications in .NET? 🤔
Our tutorial shows how to build a complete WPF trading app from CSV parsing to OHLC conversion and technical indicators.
📖 Full guide: https://t.co/EwdvwrMJYd
#DotNetDev #WPF #ChartingLibrary

Slow charts in your JS app? 😓
Key tips🛠️
Use efficient data streaming
Implement incremental rendering
Opt for a library with built-in optimization
Test #LightningChart JS today! 🚀
https://t.co/3w00JYRFm7
#JavaScript #DataViz #RealTimeCharts #ChartingLibrary #WebGL

We’re striking the stage at #VizChitra2025 as proud Bronze Sponsors of India’s first data visualization conference, where every chart sparks a story!
🔗Light up your dataviz game, get your ticket today: https://t.co/NgH5Qvf0IV
#LightningChart #DataViz @hasgeek #ChartingLibrary

We’re thrilled to welcome @Lightning_Chart as a Bronze Sponsor at #VizChitra2025!
Get ready for high-voltage visuals and lightning-fast charts that deliver insights in a flash ⚡
#LightningChart #VizChitra2025 #DataViz #ChartingLibrary @hasgeek

How do you ensure seamless chart navigation for your .NET projects? 📊
Our blog explains how #LightningChart .NET streamlines WPF zooming & panning with touch gestures ✋ and event handlers. 🚀
Read: https://t.co/LxBcEIPKML
#DataViz #DotNETDev #WPFCharts #ChartingLibrary 🧑💻

Struggling to visualize massive datasets in your #JavaScript apps? 📊
#LightningChart JS handles millions of data points at 60 FPS with GPU acceleration. Built for real-time #dataVisualization.
⬇️ 30-day trial: https://t.co/20RDCnlG8a
#WebGL #JSDev #ChartingLibrary
#JSDevs: Add skewness analysis to your #TradingApps! 📈
Our blog shows how with #LightningChartJSTrader code & visuals. 📊
Spot hidden market risks. 📉
Get code & insights: https://t.co/HUNPXSGSCP ⚡
#FinTech #JavaScriptDev #TechnicalAnalysis #DataVisualization #ChartingLibrary
🚨 Trusting AI for your #JavaScript #ChartingLibrary? 🤖
Real-world tests show AI often misses performance gaps.
This blog reveals the critical importance of hands-on testing and real-world validation.
🔗 https://t.co/2loknzqlsd
#JSDev #DataVisualization #ReactJS #ReactDev
Last Seen Hashtags on Sotwe
Most Popular Users

Elon Musk 
@elonmusk
240.1M followers

Barack Obama
@barackobama
119.3M followers

Donald J. Trump
@realdonaldtrump
111.6M followers

Cristiano Ronaldo
@cristiano
108.8M followers

Narendra Modi
@narendramodi
106.9M followers

Rihanna
@rihanna
97.2M followers

NASA
@nasa
92.1M followers

Justin Bieber
@justinbieber
90.5M followers

KATY PERRY
@katyperry
86.7M followers

Taylor Swift
@taylorswift13
80.5M followers

Lady Gaga
@ladygaga
72.1M followers

Kim Kardashian
@kimkardashian
69.3M followers

YouTube
@youtube
68.6M followers

Virat Kohli
@imvkohli
68.4M followers

Bill Gates
@billgates
63.4M followers

The Ellen Show
@theellenshow
62.5M followers

CNN
@cnn
61.9M followers

Neymar Jr
@neymarjr
60.9M followers

X
@x
60.9M followers

CNN Breaking News
@cnnbrk
59.9M followers