

Top Tweets for #FINsights

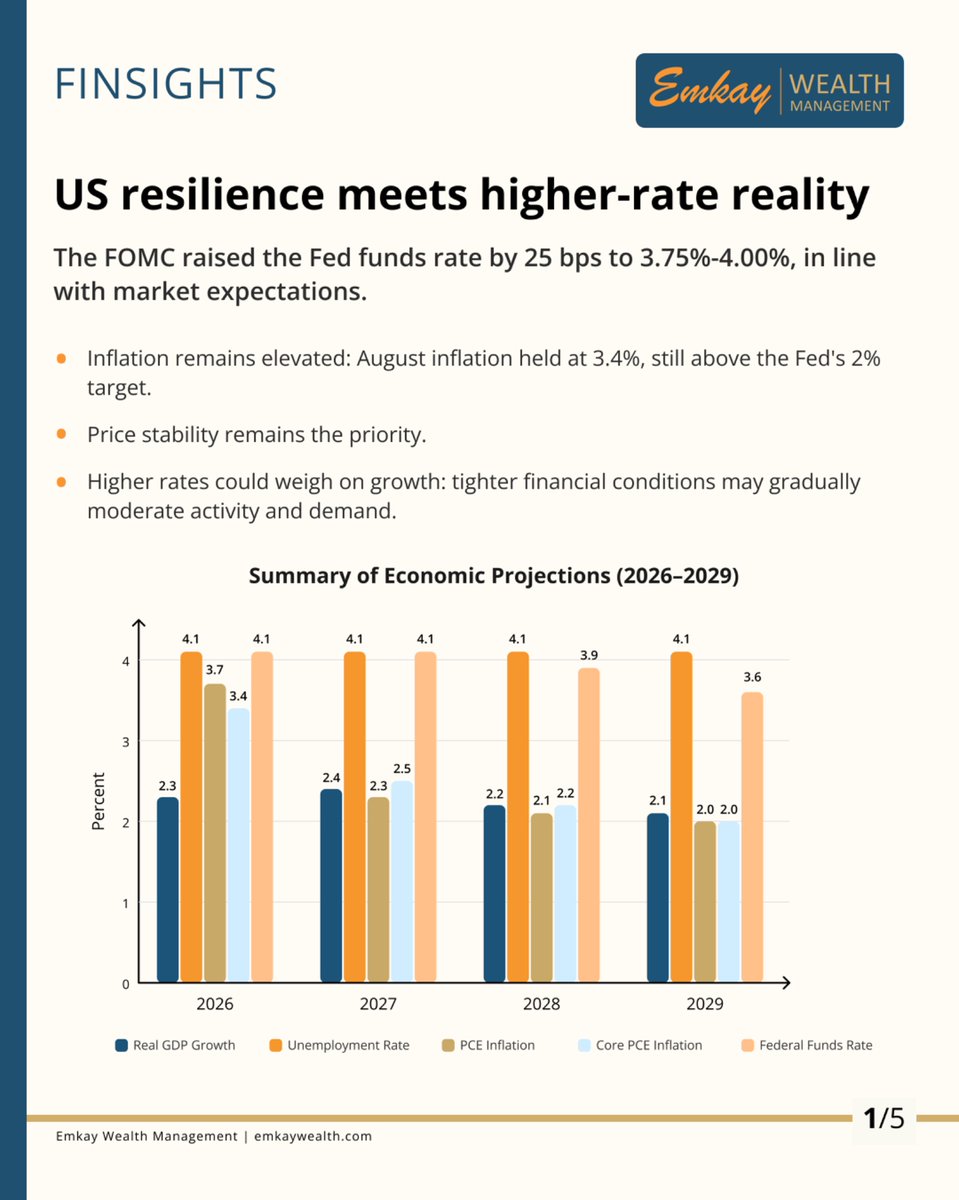
The FOMC raised the fed funds rate by 25 bps to 3.75%–4.00%, in line with market expectations.
Inflation held at 3.4% in August, still above the Fed's 2% target. The focus remains on balancing price stability with growth.
In this #Finsights, we cover:
• What is keeping the US economy resilient despite persistent inflation
• What the latest policy signals mean for the interest-rate outlook
• What our view is on the Fed's latest policy decision
A thread 🧵
1/6

Looking forward to talking artificial intelligence #AI and Investing at @HarvardHBS's Business Analysis and Valuation class led by Yuan Zou in just a few weeks. Excited to share @NewConstructs' agent built by
@googlecloud = #FinSights.


BlueJet Helthcare AR analyzed by my #finsights GPT
Key Points:
1. Concentration shift (revenue geography): FY25 shows heavy revenue from Norway ₹4,017.39m, with France ₹958.98m (down sharply vs FY24 France ₹4,341.86m). This kind of country/customer-mix shift can materially change pricing power, payment terms, and risk profile.
2. Credit Discipline
Debt position: Company reports no bank/financial institution borrowings (total debt “–”) and “net debt considered nil”. It explicitly says it remains debt-free.
Liquidity / investments:
Liquid investments (FVTPL Level 2) ₹1,716.92m (FY24: ₹2,354.88m).
Capital discipline watch: Despite being debt-free, the working capital build was large (see next section), which can pressure cash even in profitable businesses.
3. Operating cash flow: ₹457.64m in FY25 vs ₹2,412.57m in FY24 (big drop).
Capex: ₹798.80m during the year.
Free cash flow (company metric in MD&A): ₹105.81m (FY24: ₹(224.98)m).
Working capital jump (major red flag / monitor):
Net working capital increased to ₹4,435.60m, and working capital days rose to 157 from 92. Company attributes it to higher inventory holding period and higher receivables due to sales/product mix/credit terms.
Net cash incl. investments: ₹3,064.80m as of Mar 31, 2025 (vs ₹3,201.94m prior year).
5. Big contingent tax exposure (high importance):
Disclosed “interest payable” contingency ₹646.44m linked to disallowance of depreciation on goodwill / unabsorbed depreciation on goodwill.
They disclose a demand notice u/s 156 amounting to ₹1,933.86m (incl. interest ₹646.44m) for AY 2020-21 to 2023-24; company already provided ₹1,287.42m tax in books and says no further provision for interest based on legal advice (matter under appeal).
Annual Report Analyses pending
Sanghvi Movers
Onmobile Global
Neuland Lab
Bluejet Healthcare
Manali Petro
Arkade Developers
BBOX
PCBL
Once I finish this batch, I'll take more requests
Neuland Lab AR analyzed by #finsights GPT
Good things
1. The company made good profit: profit after tax about ₹259 Cr (standalone).
2. It generated strong cash from business (operating cash flow ~₹317 Cr) and says it ended the year with net cash (net debt ₹(228.74) Cr, i.e., net cash).
3. It sells to 80+ countries and has many global filings (US/Europe heavy exports), which is a strength for an API company.
4. Strong Business Verticals:
Generic Drug Substances (GDS): non-exclusive generic APIs (Prime + Specialty), strong process chemistry and large filing base.
Custom Manufacturing Solutions (CMS / CDMO): end-to-end chemistry services for innovators/NCE APIs from pre-IND to commercial scale.
Not-so-good things
1. A big chunk of FY25 profit includes a one-off gain: “Exceptional items” ₹76.40 Cr (linked to sale of investment property).
2. Working capital remains heavy: trade receivables ₹315.72 Cr, inventory ₹385.76 Cr, and reported working capital cycle 107 days
3. Looks overpriced EPS is 202; CMO is 14800
Annual Report Analyses pending
Sanghvi Movers
Onmobile Global
Neuland Lab
Bluejet Healthcare
Manali Petro
Arkade Developers
BBOX
PCBL
Once I finish this batch, I'll take more requests
ONMOBILE GLOBAL AR analyzed by my #finsights GPT
What to Track/Know:
1. Data quality flag: The narrative says “Domestic revenues registered a de-growth of 58%,” but the table shows India revenue rising from ₹587.39m to ₹1,579.35m (i.e., +168%). Treat the table as more reliable, but this inconsistency is worth noting.
2. Strategy shift (key): Management explicitly states FY25 profitability was hit by an accounting change—expensing means “less deferral,” so margins compress and PAT becomes a loss; they claim excluding this change FY25 EBITDA margin would be 11.6% and PAT margin 5.8%.
3. Related Party Economics
Unsecured loans are significant and some are effectively “open-ended”:
CARO disclosure: loans to subsidiaries during the year ₹100.01m, balance outstanding ₹262.10m; auditors note ₹262.10m (incl. accrued interest ₹19.97m) is repayable on demand, and the company didn’t demand repayment during the year.
Detailed loan table shows major exposure to OnMobile USA LLC at ₹180.19m outstanding (5% p.a.), among others.
RPT operating transactions (examples): Standalone “income from technical services” from multiple subsidiaries totals ₹625.04m in FY25.
Material RPT with ONMO Inc (US): A disclosure states ONMO Inc is a subsidiary of OnMobile USA LLC (USA LLC holds 98.82% in ONMO Inc), and mentions prior-year transactions including a loan received and cross-charged interest costs; a proposed transaction amount shown ₹1,000m (material RPT).
4. Reasons for fall in profits
Cost of software licenses and others: ₹814.52m vs ₹137.54m (+492%).
Depreciation & amortisation: ₹323.19m vs ₹112.14m (+188%).
Finance costs also rose: ₹60.86m vs ₹45.61m.
5. Consolidated cash flow also shows receivables increase ₹(517.16)m.
6. Cost of debt (directional): finance costs (consolidated) ₹60.86m on borrowings that end at ₹414.09m implies a high effective rate.
7. EBITDA-like margin (reported): 106.90 / 5,730.24 ≈ 1.9% (very low, and down sharply vs prior year).
Annual Report Analyses pending
Sanghvi Movers
Onmobile Global
Neuland Lab
Bluejet Healthcare
Manali Petro
Arkade Developers
BBOX
PCBL
Once I finish this batch, I'll take more requests
Sanghvi Movers AR analyzed by my #Finsights GPT
General comment: I had checked this for a friend a couple of months ago and recall that the company had been investing heavily in fixed assets since the last 2-3 years without corresponding increase in revenues.
NEGATIVES
1. Postal ballot approvals included enhancement of borrowing limits, creation of mortgage/charge on assets, higher limits for investments/loans/guarantees, and approvals for material related party transactions with certain subsidiaries / overseas arm.
2. Related Party Transactions
Revenue from crane rental to Sangreen Future Renewables: ₹5,013.78 Lakhs; mobilisation income ₹383.89 Lakhs.
Slump sale to the same entity: ₹4,306.05 Lakhs.
Inter-corporate deposits given (net): to subsidiaries totaling ₹2,535.49 Lakhs (472 + 298.20 + 1,765.29).
Trade receivables due from related party: ₹4,721.45 Lakhs (plus small amounts).
3. Key Audit Matter (KAM): Expected credit loss (ECL) on receivables (credit risk judgement area).
Standalone audit procedures also highlight revenue recognition / contract estimates / project monitoring (EPC-type risk).
4. Total income ~₹823 Cr (+27% YoY); EBITDA ~₹371 Cr, margin ~45% vs ~63% (sharp compression).
5. Receivables risk (high attention):
Standalone trade receivables (net): ₹16,621.36 Lakhs, up from ₹11,819.18 Lakhs.
Of this, receivable from related parties ₹4,557.30 Lakhs (new concentration).
Receivables ECL allowance (standalone): ₹938.57 Lakhs; consolidated closing ECL ₹1,086.82 Lakhs (up by ₹212.03 Lakhs YoY).
6. Consolidated funding picture (high level):
Net cash from operating activities: ₹16,170.21 Lakhs (~₹161.7 Cr).
Capex (PPE & intangibles): ₹23,702.96 Lakhs (~₹237.0 Cr).
Material trends indicated in-report:
EBITDA margin compression (45% vs 63%) = biggest operational KPI deterioration.
Receivables up sharply (standalone net receivables 166.2 Cr vs 118.2 Cr) and ECL rising = credit/collection risk increased alongside growth.
Capex intensity high (₹235 Cr–₹237 Cr range) = future depreciation/interest burden can stay elevated if utilisation/yields don’t strengthen.
Borrowings raised ₹20,948.66 Lakhs, repaid ₹7,749.30 Lakhs, dividends paid ₹2,597.28 Lakhs.
Analyst take: Free cash flow was likely negative in FY25 because capex exceeded operating inflows; the company bridged via net debt and working capital.
Annual Report Analyses pending
Sanghvi Movers
Onmobile Global
Neuland Lab
Bluejet Healthcare
Manali Petro
Arkade Developers
BBOX
PCBL
Once I finish this batch, I'll take more requests
Nectar LifeSciences Analysis by #finsights GPT
Positives (quantified)
Potential value unlock: Board approved selling API + formulations business for ₹1,270 crore (plus menthol assets for ₹20 crore) and says this should make the company debt-free and allow shareholder rewards.
Sales broadly stable: FY25 gross revenue ₹1,908.4 crore vs ₹1,925.8 crore (down 0.91%).
Operating cash flow still positive: CFO ₹169.4 crore (despite accounting loss).
Big negatives (quantified + why it hurts shareholder wealth)
Loss wiped out net worth: PAT -₹113.7 crore; total comprehensive loss -₹113.1 crore, taking equity from ₹1,069.2 crore → ₹956.1 crore (down ₹113.1 crore). This is direct shareholder value erosion.
Inventory write-down crushed profits: Management marked down non-current inventory from ₹177.33 crore → ₹50.61 crore (hit of ₹126.72 crore). That single item is ~78% of the ₹161.5 crore PBT loss (126.72/161.53). This permanently reduced equity unless recovered via higher future margins (unlikely, since written down).
Debt + interest burden is heavy: Borrowings ₹582.0 crore vs cash ₹19.2 crore; interest/finance cost ₹74.6 crore in FY25. This drags earnings and raises dilution/default risk (both destroy equity value).
Monitor how company deploys funds. If it is squaring off debt and venturing into a profitable business, one may take a chance. But know that this stock is a laggard and a wealth destructor

@SunilVTinani nectar lifesciences
Maithan Alloys AR Analysis by #finsights
Positives (quantified)
Revenue grew meaningfully (FY25): Sales up from ₹2,079.94 cr → ₹2,546.27 cr (+₹466.33 cr, +22.4%).
EBITDA nearly doubled (FY25): EBITDA up from ₹465.79 cr → ₹894.28 cr (+₹428.49 cr, +92.0%).
Net profit jumped (FY25, standalone): Net profit ₹640.23 cr vs ₹351.03 cr (+₹289.20 cr, +82.4%).
Net worth increased (balance sheet strength on paper): Net worth ₹3,684.59 cr vs ₹3,070.36 cr (+₹614.23 cr, +20.0%).
Standalone operating cash flow was strong: CFO (standalone) ₹531.66 cr.
Receivables improved sharply (lower collection risk): Trade receivables reduced from ₹387.61 cr → ₹145.40 cr (-₹242.21 cr, -62.5%).
Shareholder payouts (cash dividends):
Dividend paid during FY25: ₹26.20 cr.
Interim dividend paid (FY25): ₹3/share = ₹8.73 cr.
Large liquid investment buffer (liquidity cushion, but see negatives):
Current investments ₹1,725.70 cr (FY25).
Reported “Net Debt (surplus)” ₹(1,429.10) cr (i.e., net cash/investments exceed debt as per their metric).
Negatives (quantified)
Earnings quality risk: profits heavily depend on investment fair-value gains (market-linked, volatile)
Standalone PBT ₹858.47 cr.
Included fair value gain on investments (FVTPL) ₹832.01 cr → about ~96.9% of PBT.
“Other income” rose to ₹726.62 cr (vs ₹356.94 cr) mainly due to fair value gains.
Consolidated cash generation is weak vs headline profit (profit ≠ cash)
Consolidated net cash from operations (CFO) only ₹49.77 cr.
Yet consolidated profit attributable to owners is ₹630.18 cr (big gap between accounting profit and operating cash).
A key driver: consolidated inventory cash outflow ₹(735.84) cr (working-capital absorption).
Inventory rose sharply (working-capital + commodity-cycle risk)
Inventory increased from ₹339.67 cr → ₹588.04 cr (+₹248.37 cr, +73.1%).
Borrowings increased substantially (higher financial risk / interest sensitivity)
Total loan funds ₹565.08 cr vs ₹17.21 cr prior year (big step-up).
Finance costs jumped from ₹1.55 cr → ₹20.91 cr (+₹19.36 cr, +1,253%) due to higher borrowings.
Very large “investing book churn” (market + liquidity + governance lens)
Consolidated purchase of current investments ₹4,532.90 cr and sales ₹4,269.66 cr (high turnover).
Consolidated purchase of non-current investments ₹660.59 cr (material new deployment).
Borrow-and-deploy pattern visible
Consolidated borrowings raised ₹568.19 cr (FY25).
Standalone short-term borrowings raised ₹550.42 cr.
Standalone short-term loans given ₹389.22 cr + long-term loans given ₹17.82 cr (capital deployed outside core ops).
Cash at bank is low (despite large investments)
Standalone cash & equivalents at year-end ₹16.36 cr.
Consolidated cash & equivalents at year-end ₹21.80 cr.
Overall rating 6/10
One Source Specialty Pharma AR analysis by my #finsights GPT
Positives
Strong FY25 operating performance:
Revenue ₹14,449 million (~₹1,444.9 cr), EBITDA ₹4,665 million (~₹466.5 cr) and EBITDA margin 32.3%; Adjusted PAT ₹936 million (~₹93.6 cr), Adjusted EPS ₹21.4.
Growth momentum:
Revenue +30% YoY, EBITDA +104% YoY (vs proforma base).
Commercial traction (pipeline/clients):
39 new RFPs/licensing deals, 15 new customers added, and 16 drug-device combination (DDC) projects added; plus 6 programs added in the US.
Compliance strength (important in pharma CDMO):
60+ regulatory inspections and customer audits completed in FY25.
Deleveraging action + lower leverage:
Raised ₹8,010 million (~₹801 cr); ~50% (~₹4,005 million / ₹400.5 cr) used to retire high-cost, guarantee-backed debt; net debt (net of cash & equivalents) ₹4.7 billion (~₹470 cr).
Leverage metric improved sharply:
Net debt to EBITDA 1.0x in FY25 vs 4.3x in FY24 (proforma comparison in the report).
Working capital position (cash efficiency):
Working capital moved to (3.6%) of sales in FY25 vs 21.1% in FY24 (proforma comparison shown). Negative WC % can be a good sign (customer advances / faster cash cycle).
Credit rating upgrade (funding signal):
Credit rating upgraded to IND A-; Outlook: Positive (India Ratings & Research) for bank facilities.
Growth capex plan (future capacity):
Planned capex USD 100 million over 4 years; cartridges capacity targeted from 40 million units (FY25) to 220 million (FY28); pre-filled syringes 38 million → 50 million.
Negatives (quantified)
Very large contingent liability (biggest red flag):
Arbitration claim (SIAC) of USD 136.32 million, shown as contingent liability of ₹11,647.58 million (~₹1,164.8 cr). This is about ~81% of FY25 revenue.
Heavy “business combination” accounting = big goodwill + intangibles (impairment risk):
Goodwill recognised at ₹38,275.31 million (~₹3,827.5 cr), plus sizable identified intangibles (e.g., product portfolio/customer relationship, customer contracts).
If future performance disappoints, goodwill/intangibles can face impairment (non-cash hit but can crush reported profits & sentiment).
Large annual amortisation drag (profit vs cash gap risk):
Amortisation of intangible assets shown at ₹1,735.35 million (~₹173.5 cr) (FY25). This is a recurring P&L expense that can keep reported profits lower even if cash is fine.
One-off / scheme-related expenses still large:
Exceptional one-time scheme-related expenses in FY25: ₹1,108 million (≈ ₹110.8 cr). Even if “one-off”, it’s big enough to distort headline earnings.
Liquidity tight on a strict current ratio basis (standalone ratio disclosure):
Current ratio 0.96x with current assets ₹10,238.80 million vs current liabilities ₹10,694.82 million (gap of ₹456.02 million ~ ₹45.6 cr).
Sub-1 current ratio can be manageable in CDMO if customer advances are strong, but it reduces margin of safety.
Weak debt service coverage (standalone ratio disclosure):
Debt service coverage ratio 0.50x; interest payments ₹1,412.15 million (~₹141.2 cr) and debt repayment ₹6,305.56 million (~₹630.6 cr) vs EBITDA ₹3,869.57 million (~₹387.0 cr).
This indicates FY25 cash obligations were heavy relative to EBITDA (again: this is standalone ratio disclosure, but it’s still a stress signal).
Overall: Heavy goodwill and amortization + heavy contingent liabilities + low current ratio (liquidity risk) are factor to watch out for.
Track news and price on charts.
Rating 5/10

@SunilVTinani Onesource Specialty Pharma
Want to know what the Evolution of AI for Investing looks like? Here it is.
@googlecloud built an AI Agent, #FinSights, on @NewConstructs data and ontology.
See how it works: https://t.co/it7jlXDSJI

Marine Electricals 2025 AR analyzed
This is also a lesson why you must not 100% rely on AI (the AI made an error in the first chat, then I had to point out the correction)
https://t.co/GS56BMLZFR
Analyzed by my #fINSIGHTS GPT (available as a GPT on ChatGPT)
https://t.co/4YUuOFy8XP
Holmarc Opto mechatronics @ 122
AR analyzed as per my framework by #fINSIGHTS
https://t.co/bOapKvUJt0
Soft 2026 and margin compression expected
Read screenshots
Using my GPTs (with ChatGPT 5-Thinking) and sack 50% of your analysts


@SunilVTinani let's see how holmarc navigates through this tariff phase. Management in their report is not sugar coating anything , I like that.
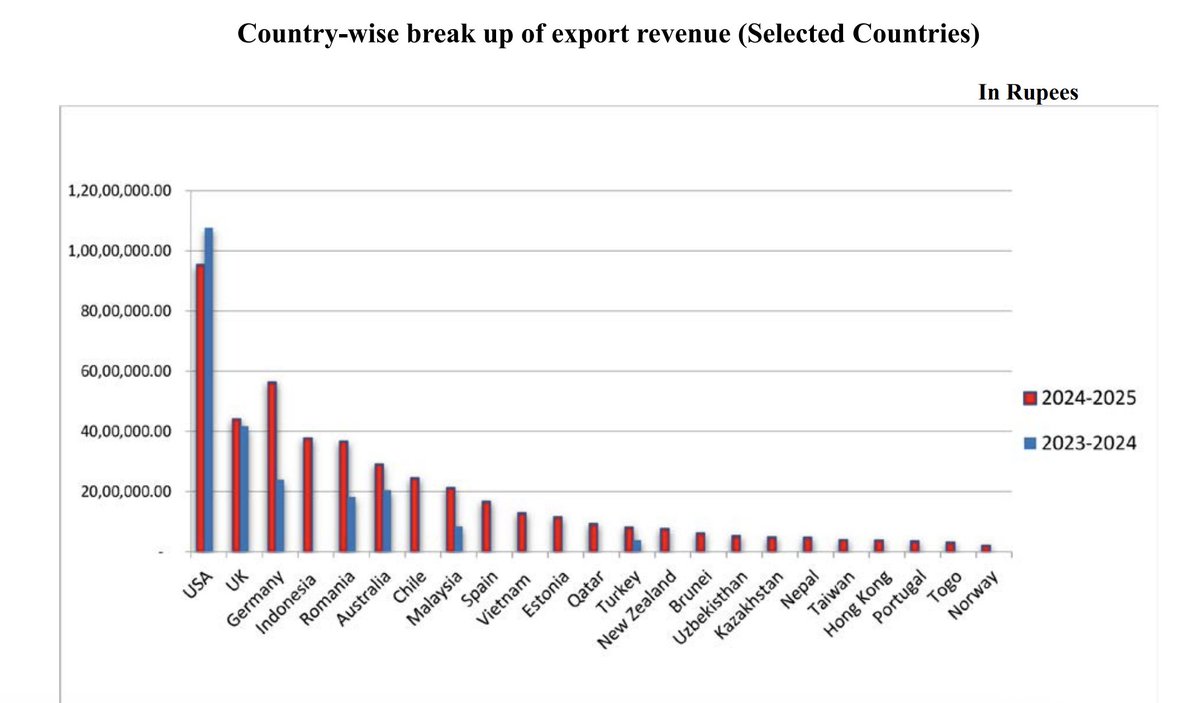
I've made #fINSIGHTS sharper
Upload any annual report or quarterly results and check
https://t.co/3zhvgmiV5E
Do provide feedback. Thanks.
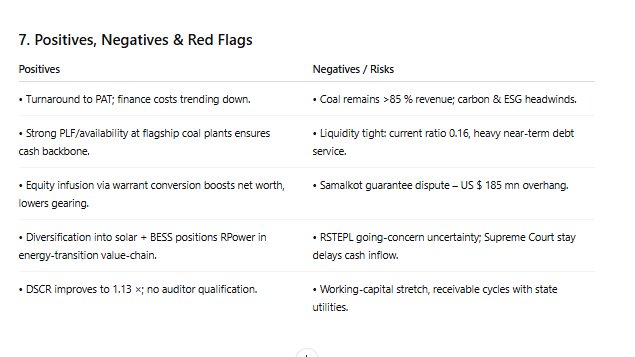
RPower latest quarterly results...
positive and negatives
Analysis by #fINSIGHTS
https://t.co/3zhvgmiV5E
Added new checks on #fINSIGHTS
https://t.co/vNdQpDwZWA
Upload any QR or AR to check. You won't need any analyst's help.
Check RIL Q1 2026 QR analysis
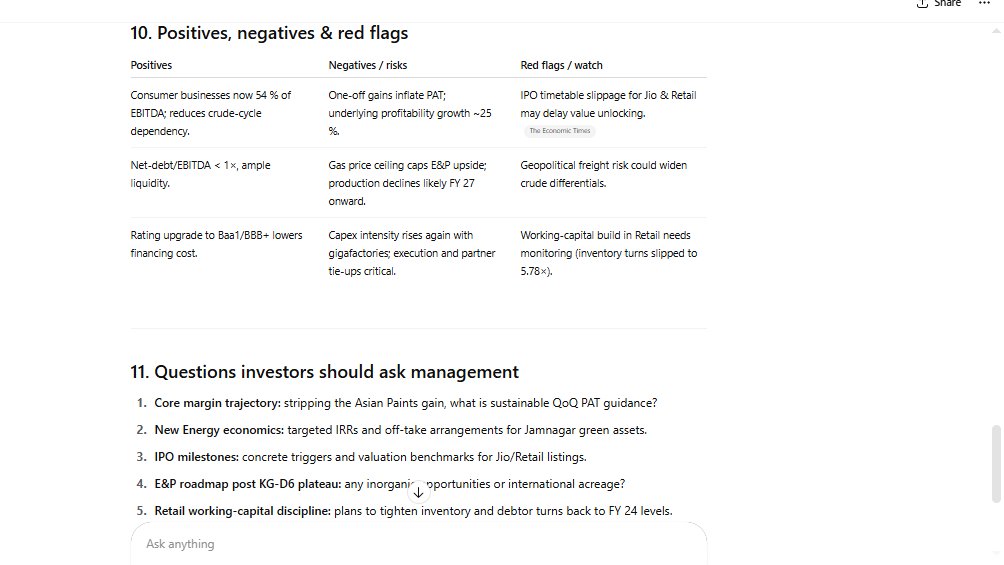
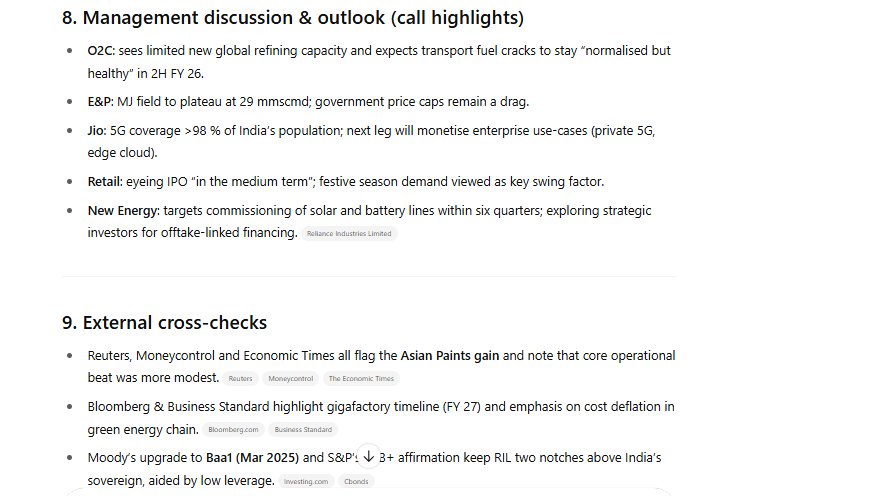
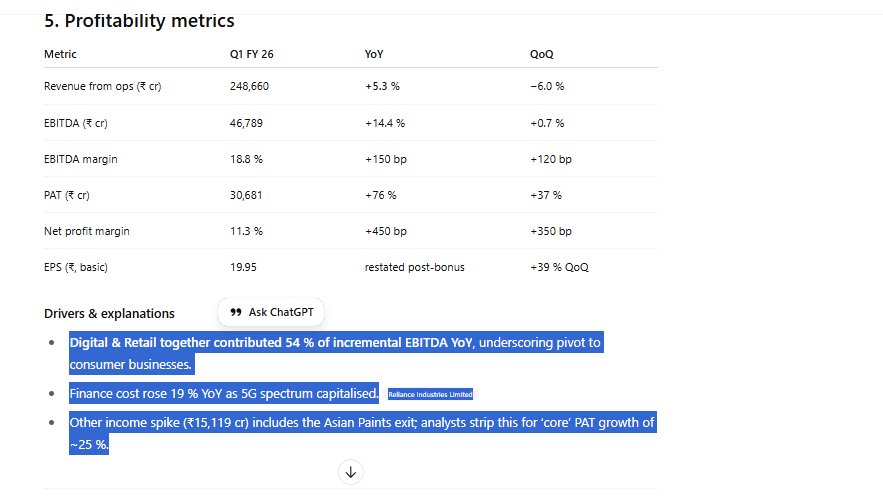
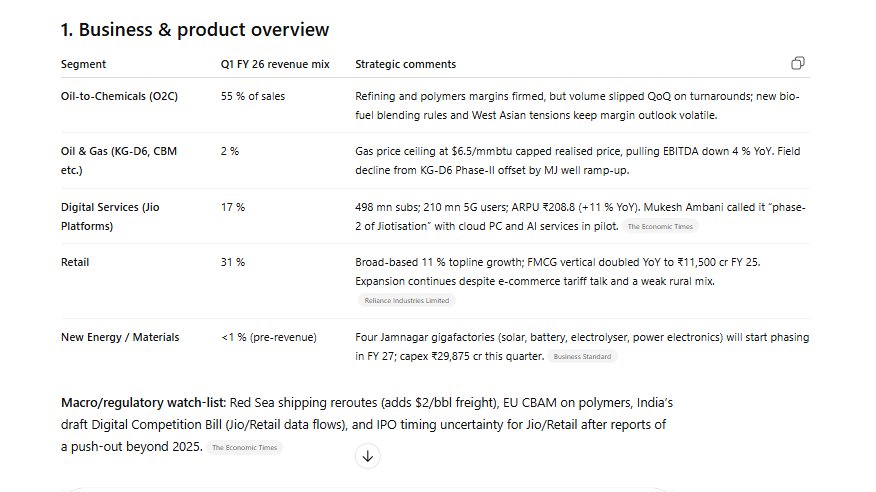
Hello, I've made some changes to
#ChartGPT (analyzes charts)
https://t.co/yukGzSvtdX
and
#fINSIGHTS (analyzes AR/QR)
https://t.co/3zhvgmiV5E
Could you have a go and check if the new reporting keeps you more informed? Thanks.
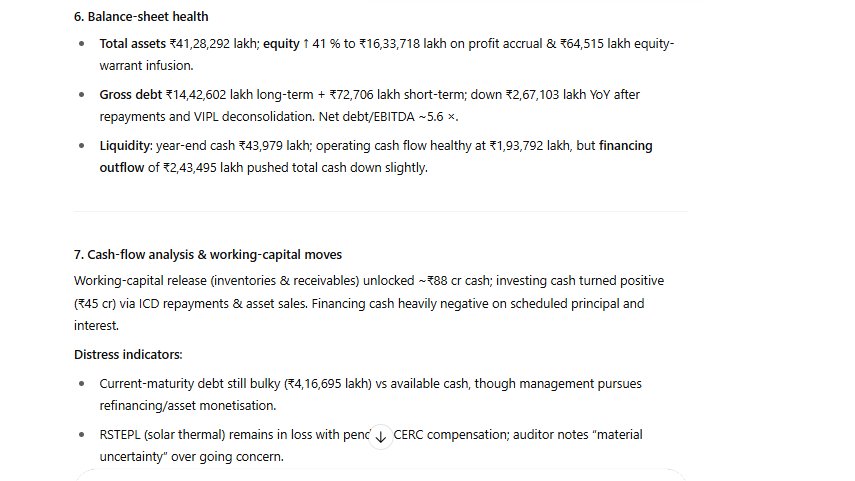
Rpower 2025 AR analysis by #fINSIGHTS
https://t.co/3zhvgmiV5E
See screenshots.
Use fINSIGHTS for AR and QR analyses. Just upload report and say "Analyze as per your instructions"

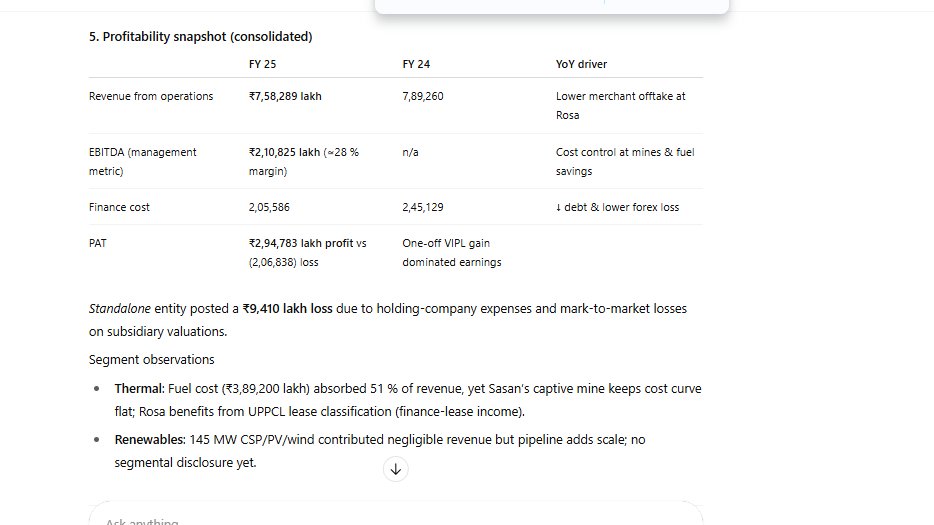
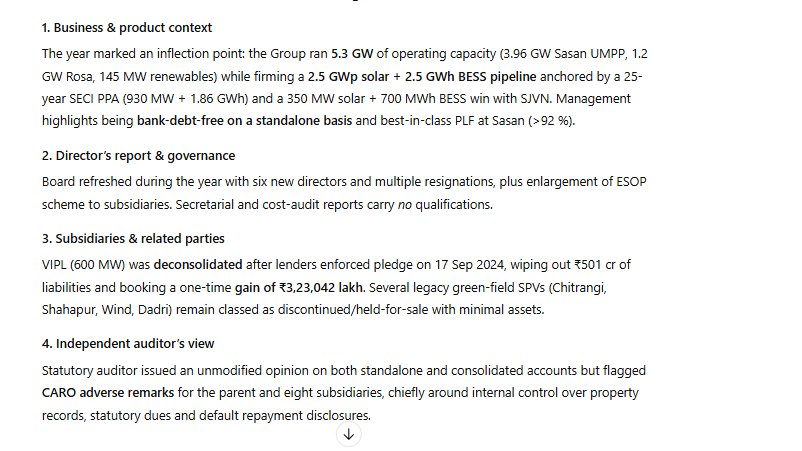
I've created #fINSIGHTS GPT
https://t.co/3zhvgming6
It helps you analyze Annual Reports or Quarterly Results
Just upload any result and say "Analyze based on your training instructions."
Check the output and do provide feedback

💡 #Finsights
Ever wondered what it means to own a share in a company? 🤔
Equity shares make you a fractional owner—but did you know there are different types? 📊
#InvestorAwareness #InvestSmart #FinanceSimplified #Purnartha #purnarthapms

Last Seen Hashtags on Sotwe
esex
Seen from Netherlands
minichat(***)************************+filter:native_video
Seen from Turkey
suceuse beurette
Seen from France
bara #nsfw
Seen from Netherlands
remoiran
Seen from United States
หนองเรือ
Seen from Thailand
XanaduTubeTangle
Seen from United States
xlii https:
Seen from Germany
momson() + filter:videos since:2026-03-03 until:2026-03-05
Seen from Pakistan
Dumbbell_anime
Seen from Mexico
Most Popular Users

Elon Musk 
@elonmusk
241.5M followers

Barack Obama
@barackobama
118.9M followers

Cristiano Ronaldo
@cristiano
114.6M followers

Donald J. Trump
@realdonaldtrump
111.8M followers

Narendra Modi
@narendramodi
107.1M followers

Rihanna
@rihanna
98.7M followers

NASA
@nasa
92.3M followers

Justin Bieber
@justinbieber
91.8M followers

KATY PERRY
@katyperry
90M followers

Taylor Swift
@taylorswift13
84M followers

Lady Gaga
@ladygaga
75.5M followers

Virat Kohli
@imvkohli
73.5M followers

Kim Kardashian
@kimkardashian
70.9M followers

YouTube
@youtube
68.8M followers

Neymar Jr
@neymarjr
66.5M followers

Bill Gates
@billgates
65.2M followers

Selena Gomez
@selenagomez
63.1M followers

The Ellen Show
@theellenshow
62.2M followers

CNN
@cnn
61.8M followers

X
@x
60.7M followers