

Top Tweets for #NetLiquidity

$BTC #krypto
GM 👋
#NetLiquidity (WALCL − RRP − TGA) dreht wieder leicht nach oben 📈
Stand 25.02.2026: ~5,724 Billionen USD (≈ 5.724.000 Mrd.)
Warum das zählt:
Steigende Net Liquidity = mehr „System-Liquidität“ im Umlauf
➡️historisch oft Rückenwind für Risk-Assets (v. a. #Bitcoin), meist mit etwas Vorlauf.
Was ich aktuell daraus lese:
Nach der deutlichen Abwärtsphase sehen wir erste Stabilisierung + Turn-up ✅
Noch kein „Vollgas-Bull“, aber: Abwärtsdruck nimmt ab und das Chancenfenster öffnet sich.
Jetzt wichtig für Bestätigung:
Wenn der Anstieg mehrere Wochen hält (höhere Hochs) und die kurzfristige Glättung (MA20) mitzieht/kreuzt die MA80, wird daraus wieder ein belastbarer Liquidity-Tailwind.
Auf geht`s💪
WISSEN IST VERMÖGEN. TRENDS ERKENNEN. VORAUSSCHAUEND HANDELN.

#Bitcoin
Steckt $BTC noch in der Sub-Welle A (gelb), die sich demnächst in der Zielzone 59,8k–55k finalisiert? 👀
➡️ Erst nach Abschluss dieser Sub-Welle A (gelb), erwarte ich die korrektive Gegenbewegung in Form der Sub-Welle B (gelb).
Chart-kurzfristige Analyse👇
https://t.co/VlN51iZjdU
Auf geht’s 💪
WISSEN IST VERMÖGEN. TRENDS ERKENNEN. VORAUSSCHAUEND HANDELN.


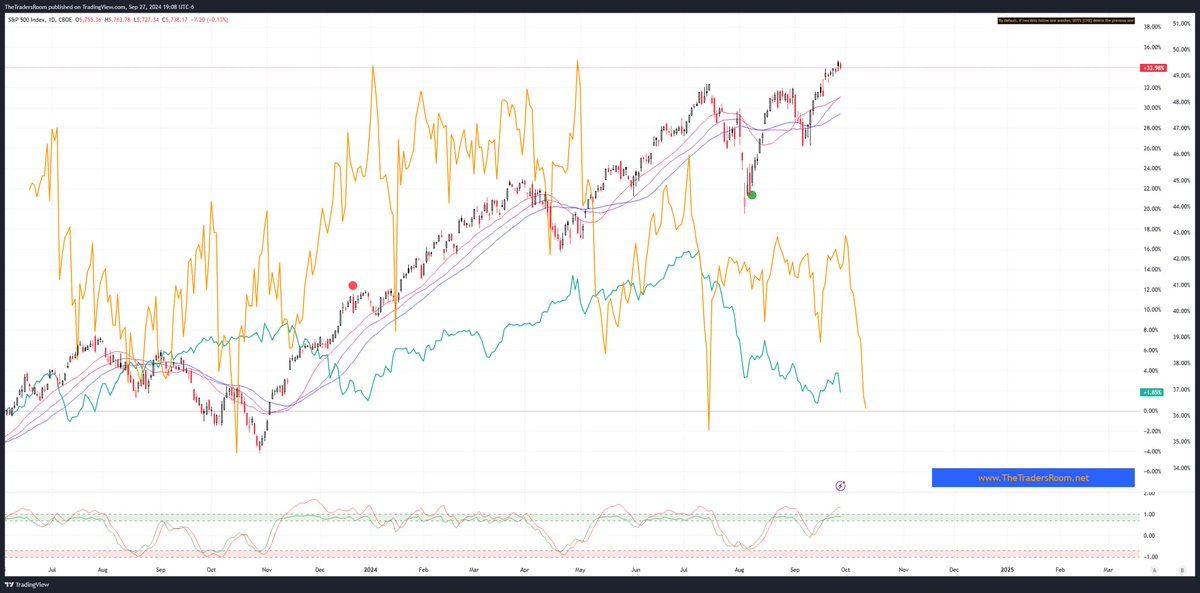
#FED’s #NetLiquidity is dropping hard, the same as it did before the August crash. $USDJPY continues selling off
#SPX #StockMarket #SPX500 #DJI #YM #NDX #RTY $IWM $QQQ $SPY #Stocks #ES_F #NQ_F #TTRcommunity https://t.co/q81pPcIdVM

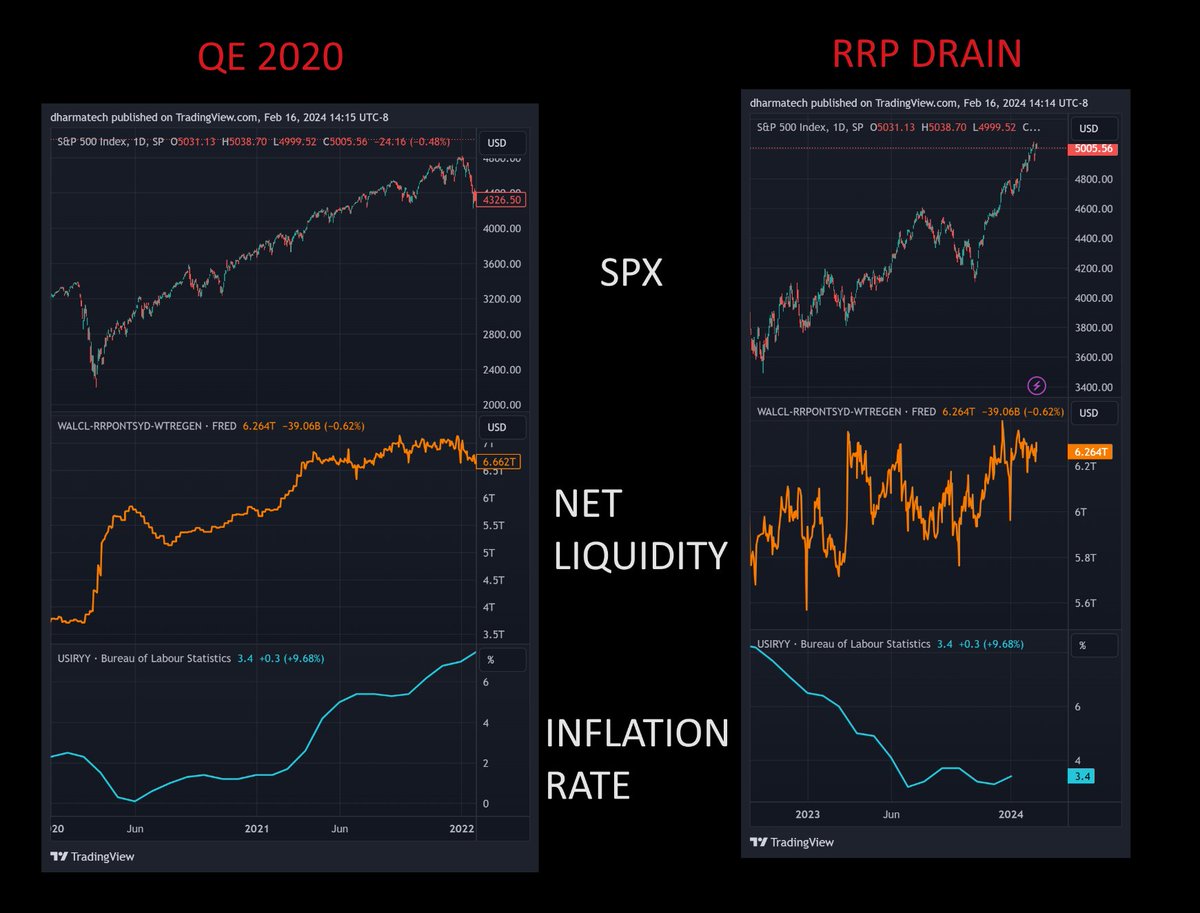
@maxanderson I've been looking at #NetLiquidity as a leading indicator for inflation.
https://t.co/5hEZuB3pb5
$SPX, #NetLiquidity and $USIRYY (inflation rate)
Note that $USIRYY appears to be bottoming.
You boost liquidity, you get inflation.
Sorry, I don't make the rules.
#NetLiquidity is once again the highest it's been since April 2022.
RRP has dropped $107B over the last two days.
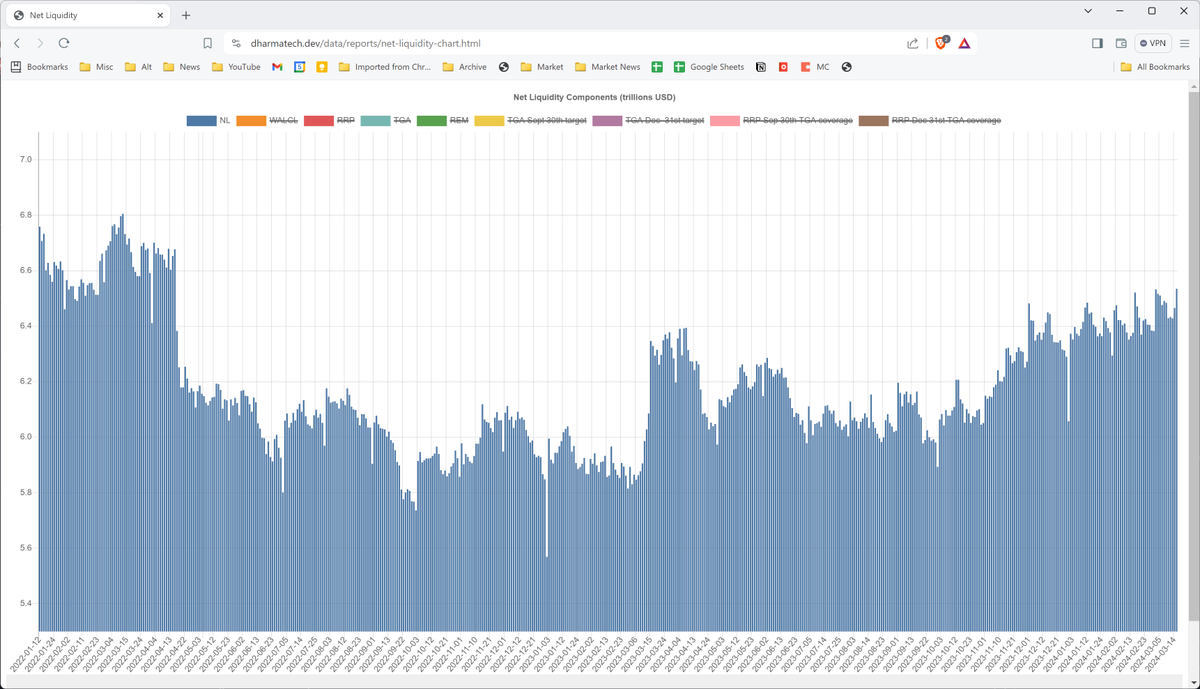
#NetLiquidity is once again the highest it's been since April 2022.
RRP has dropped $107B over the last two days.
As an alternative, you can also use this formula
SP:SPX/(FRED:WALCL-FRED:WTREGEN-FRED:RRPONTSYD-FRED:RESPPLLOPNWW)*1000*1000*1000*10
which includes:
'Earnings Remittances Due to the U.S. Treasury'
as part of #NetLiquidity.
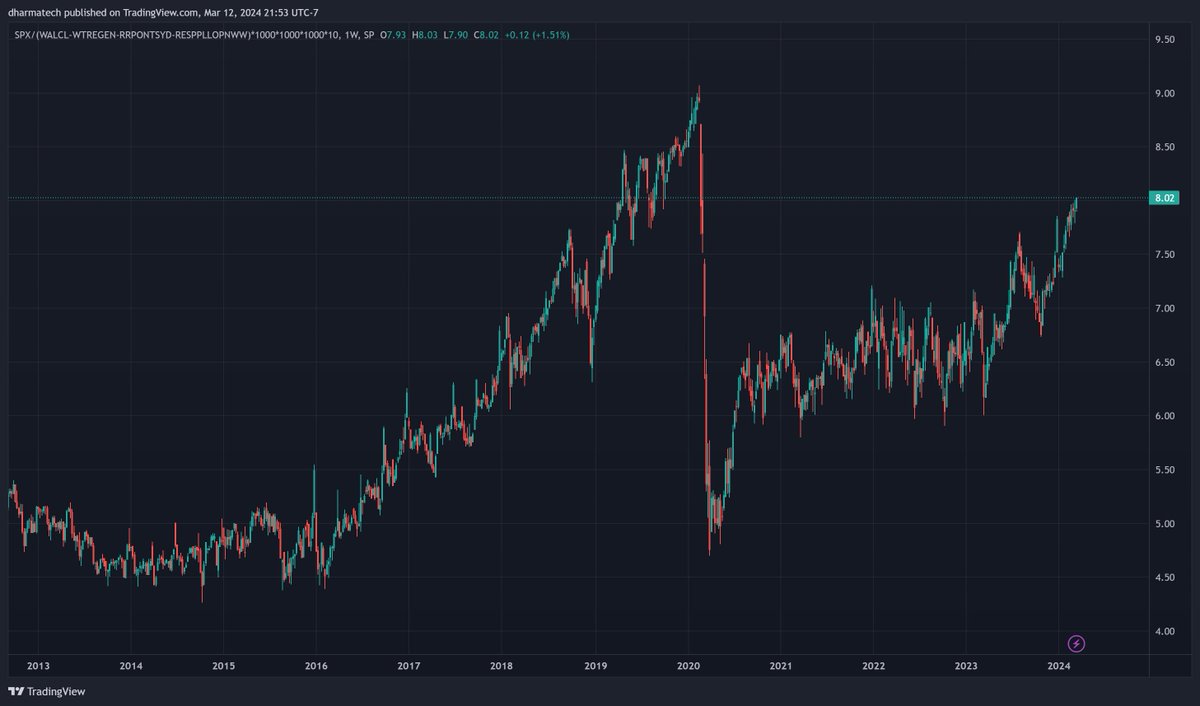
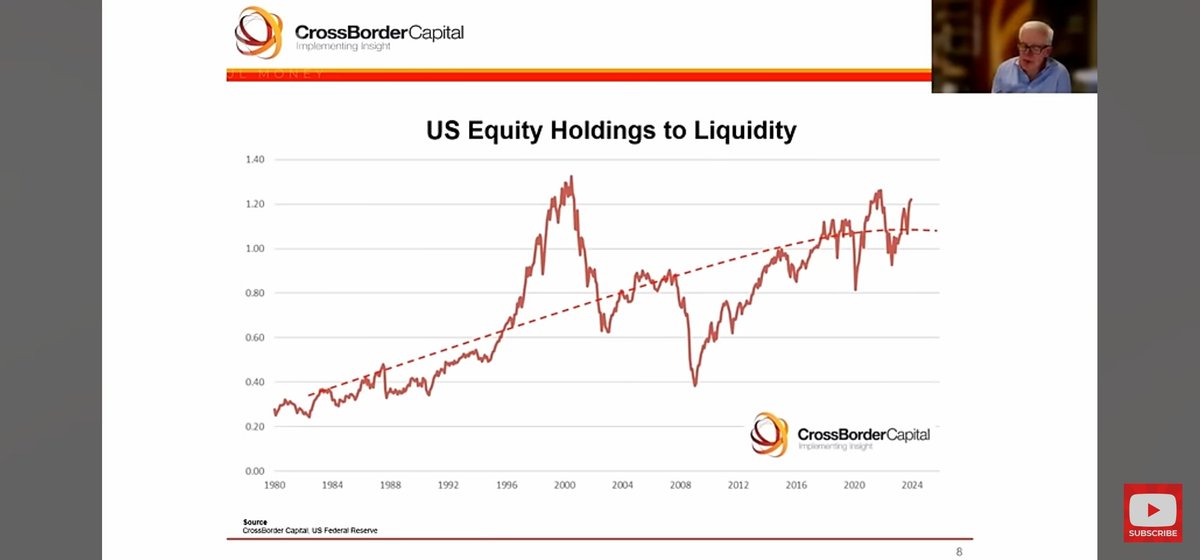
This chart 'US Equity Holdings to Liquidity' was presented by @crossbordercap in his recent interview with @adamtaggart.
Something similar that I've been tracking on @tradingview is simply $SPX/#NetLiquidity
Formula for @tradingview:
SP:SPX/(FRED:WALCL-FRED:WTREGEN-FRED:RRPONTSYD)*1000*1000*1000*10
It tells you how far $SPX is extended with respect to #NetLiquidity. As you can see, it's the most extended it's been since 2020 right before the crash.

#NetLiquidity is once again the highest it's been since April 2022.
TGA -$88B
https://t.co/CqfCFm48AX
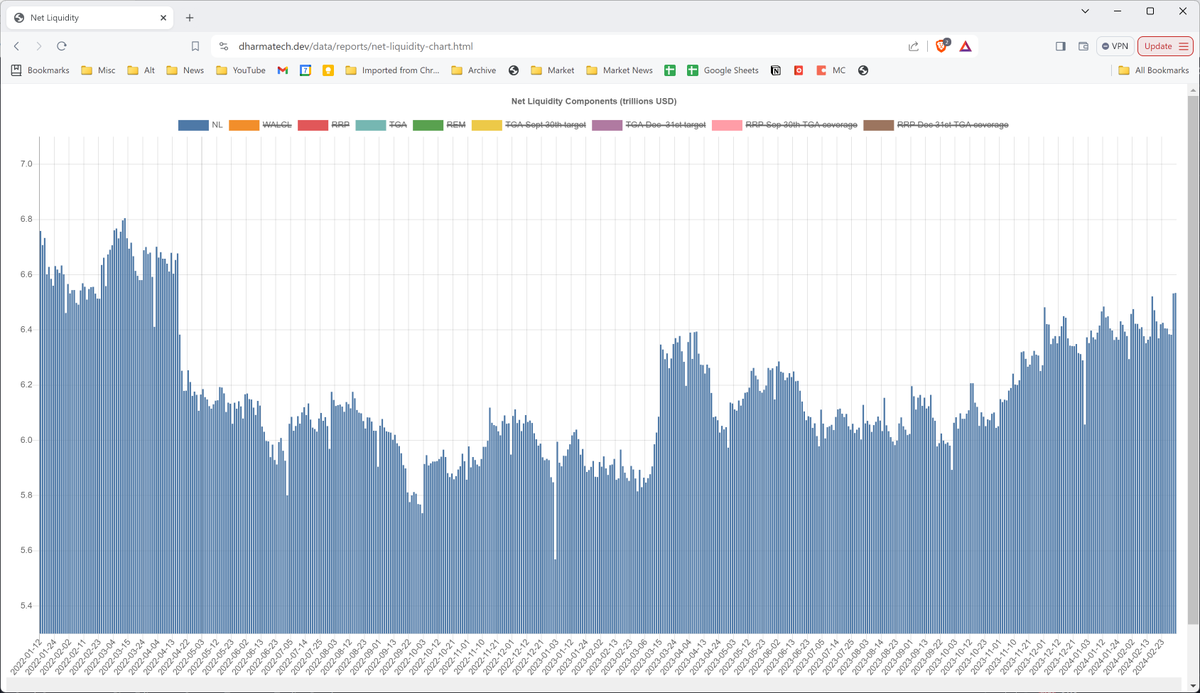
Now that #NetLiquidity has been on the minds of more folks ever since 2020 QE, people have been looking into the plumbing of the components (Fed balance sheet, RRP, TGA).
People began to realize the importance of treasury issuance; i.e. decisions like will the Treasury issue more bills, bonds, notes, etc. (E.g. Heavy bills issuance? That drains RRP. Good for liquidity.)
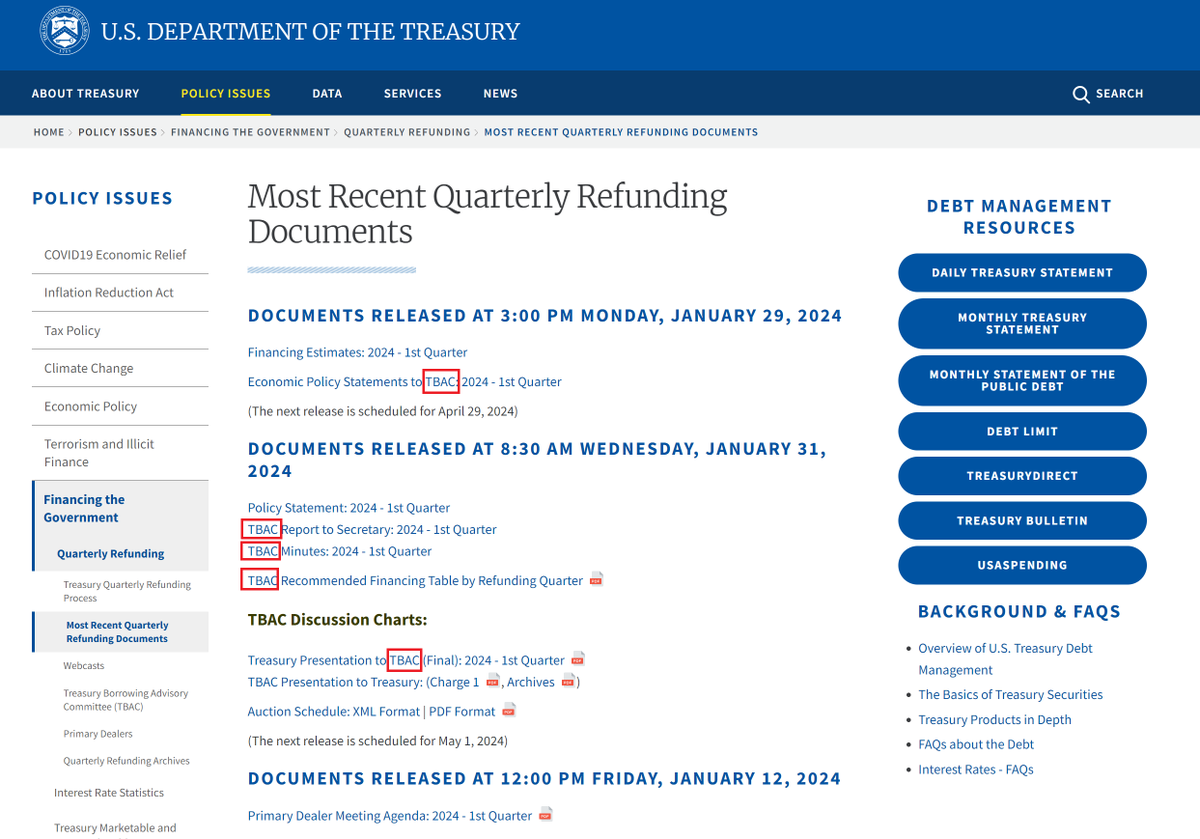
If you look through the QRA documents you'll see TBAC mentioned a lot.
Each quarter the TBAC "recommends" the financing schedule to the Treasury. I.e. how much of each (bills, notes, bonds) they should issue.
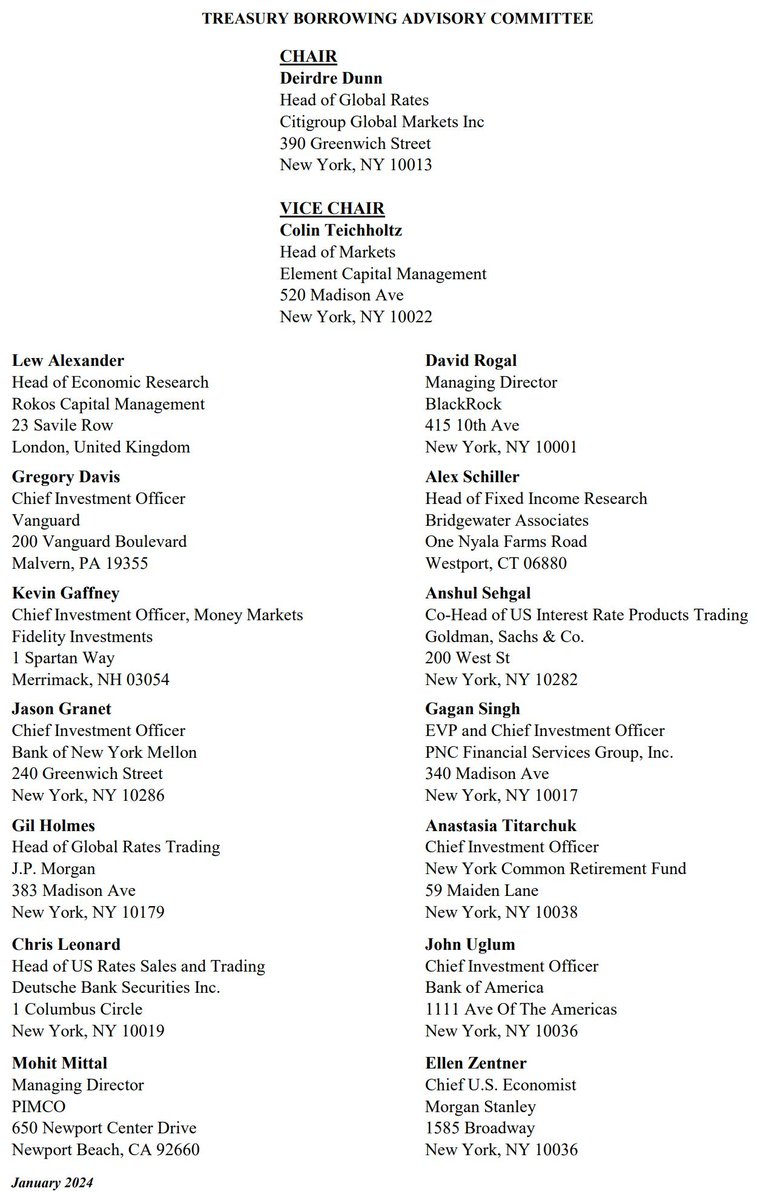
So who exactly is on the TBAC (Treasury Borrowing Advisory Committee)?
Citigroup Global Markets Inc
Element Capital Management
Rokos Capital Management
BlackRock
Vanguard
Bridgewater Associates
Fidelity Investments
Goldman, Sachs & Co.
Bank of New York Mellon
PNC Financial Services Group, Inc
J.P. Morgan
New York Common Retirement Fund
Deutsche Bank Securities Inc.
Bank of America
PIMCO
Morgan Stanley
They tell Yellen how to finance the government.
And you can bet those institutions are well positioned for this.
Now, ask yourself, why did the TBAC change their reporting format after 22 years in a way that obscures two key numbers: net issuance of bills and bonds.


#NetLiquidity has been pretty much sideways since Dec 1st.
Look for things to change in 2nd quarter; possibly more issuance of notes and bonds vs bills, which may lead less drain out of RRP.
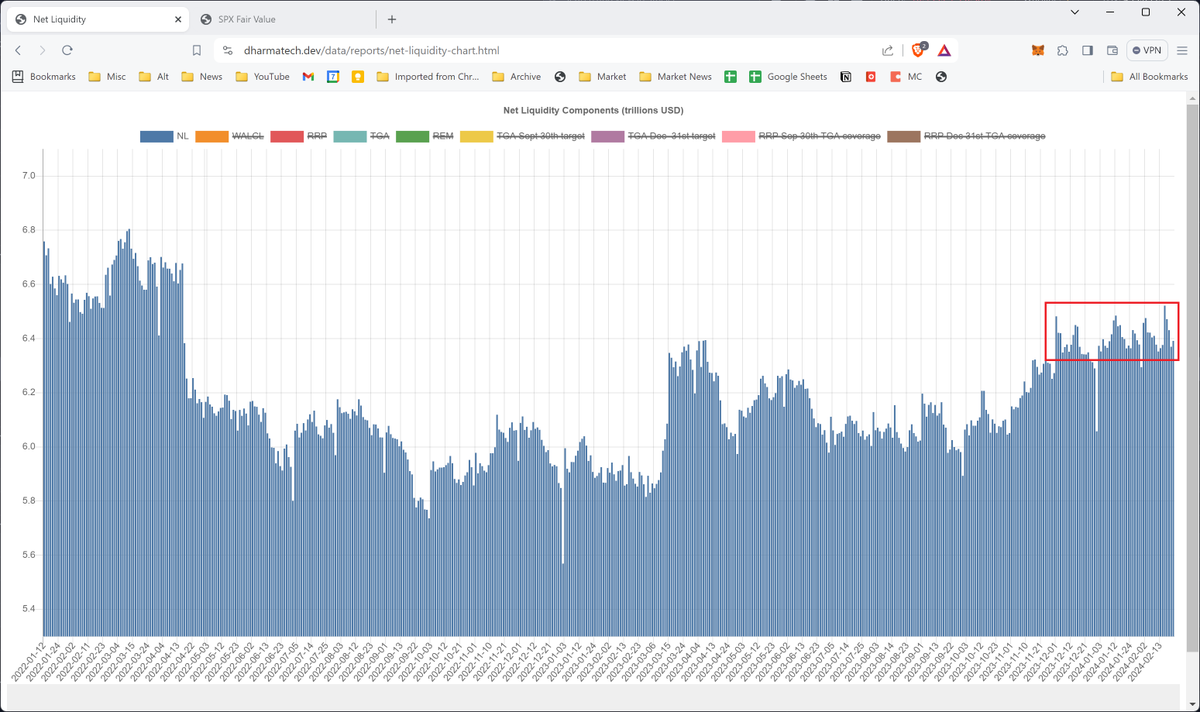
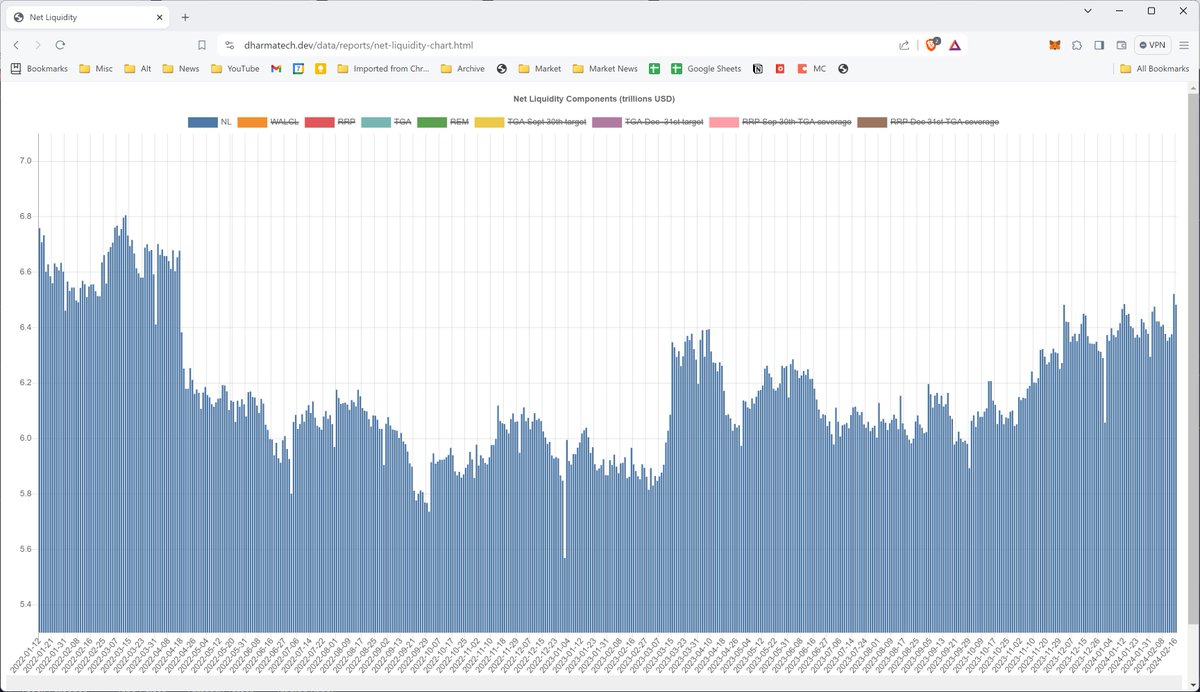
#NetLiquidity highest it's been since April 2022.
https://t.co/TLkUjvJZWA
🚨#NetLiquidity yesterday was the highest it's been since April 2022.
Thread on NL being a leading indicator for inflation:
https://t.co/hfap5VLIci
Chart:
https://t.co/CqfCFm4Gqv
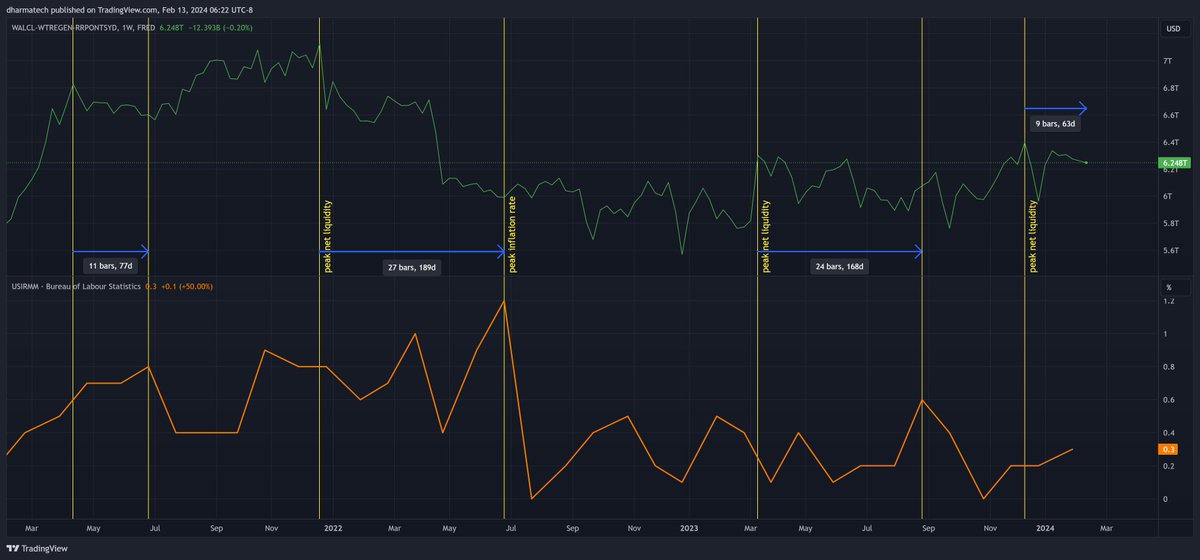
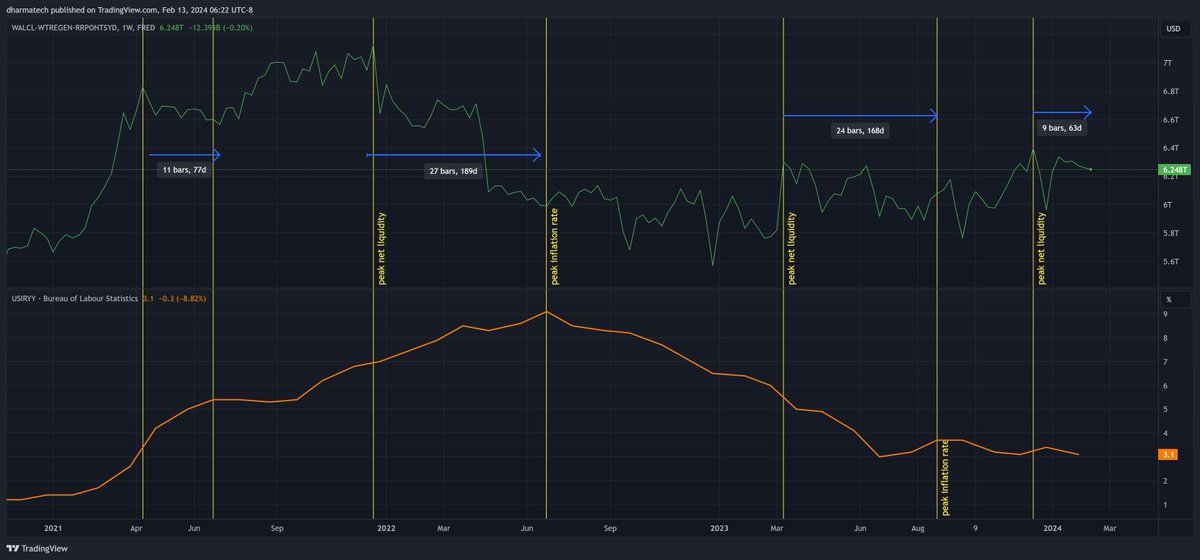
#NetLiquidity as a leading indicator for inflation
https://t.co/hfap5VLIci
#NetLiquidity and U.S. Inflation Rate YoY
Measuring time between NL peaks and IR peaks.
2nd chart:
#NL and U.S. Inflation Rate MoM
#NL is at a local peak again.
Will we see another jump in IR?
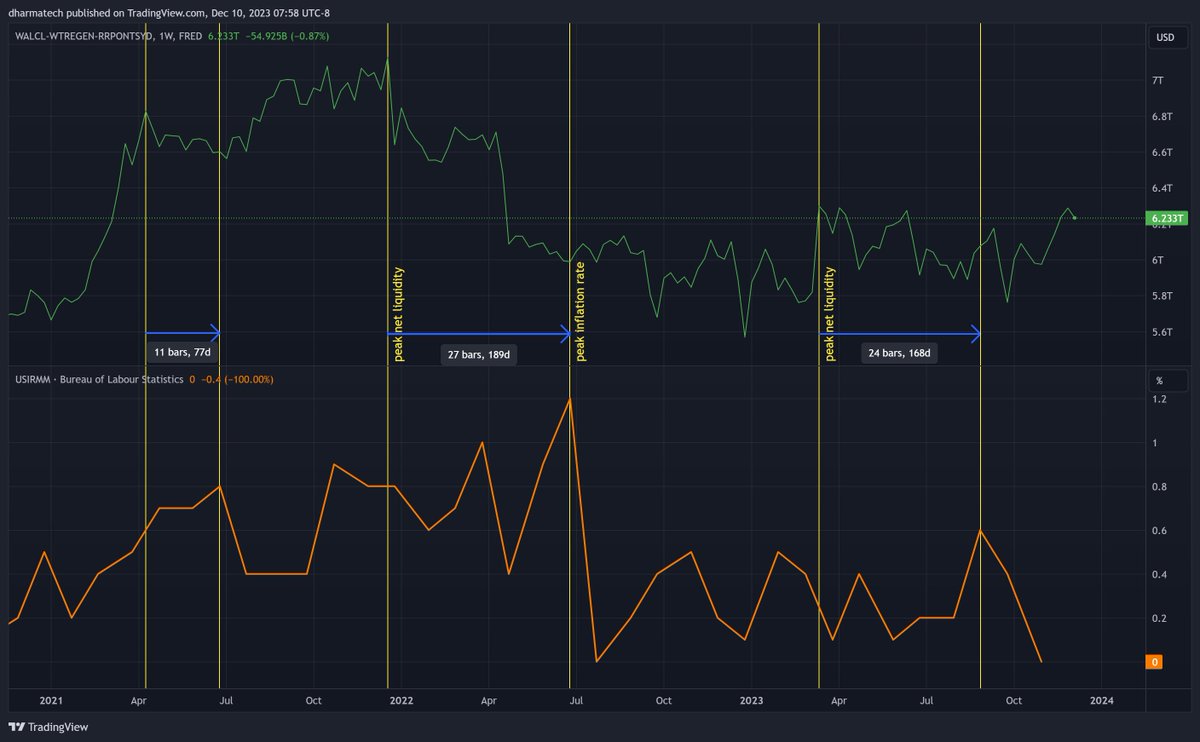
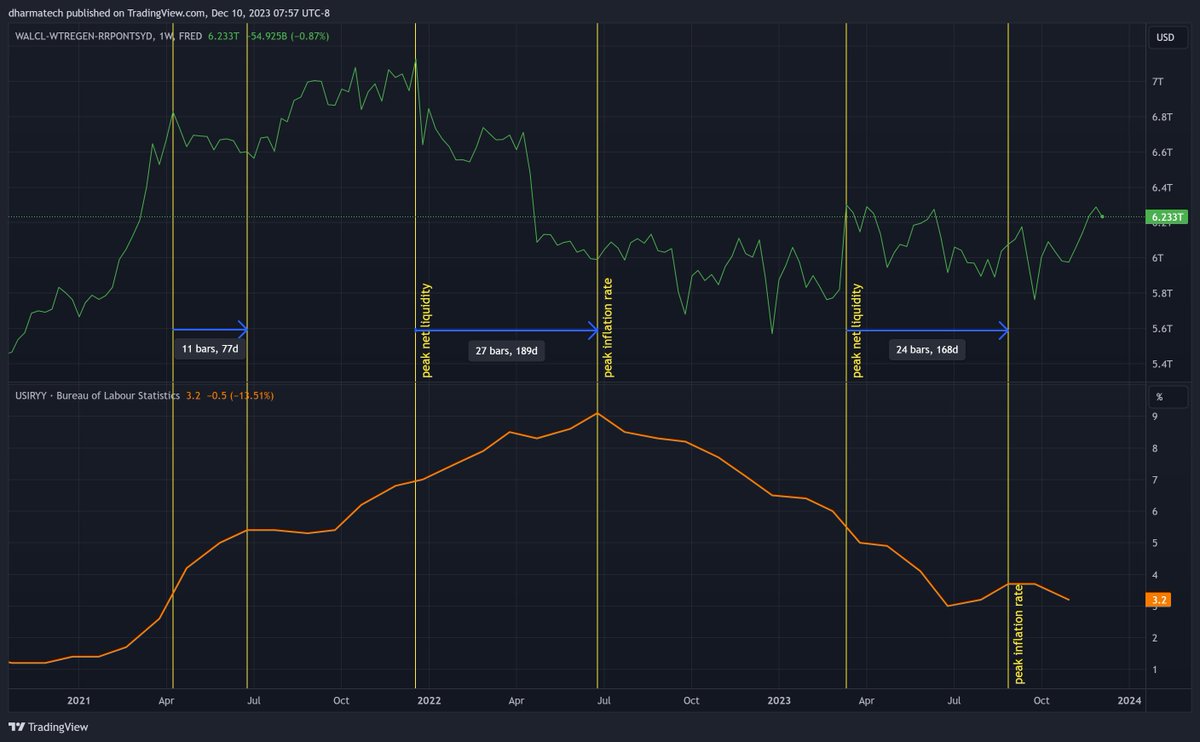
$SPX, #NetLiquidity and $USIRYY (inflation rate)
Note that $USIRYY appears to be bottoming.
You boost liquidity, you get inflation.
Sorry, I don't make the rules.
🚨#NetLiquidity yesterday was the highest it's been since April 2022.
Thread on NL being a leading indicator for inflation:
https://t.co/hfap5VLIci
Chart:
https://t.co/CqfCFm4Gqv
#NetLiquidity and U.S. Inflation Rate YoY
Measuring time between NL peaks and IR peaks.
2nd chart:
#NL and U.S. Inflation Rate MoM
#NL is at a local peak again.
Will we see another jump in IR?
@CalebFranzen I've been watching #NetLiquidity as a leading indicator for inflation.
https://t.co/CksWcZ9DdJ
#NetLiquidity and inflation
It's been 49 days from the December NL peak to the inflation datapoint.
The times between NL peaks and inflation rate peaks in 2021-2023 were:
77 days
189 days
168 days
YoY 3.4->3.1✅
MoM 0.2->0.3❌
#NetLiquidity and inflation
It's been 49 days from the December NL peak to the inflation datapoint.
The times between NL peaks and inflation rate peaks in 2021-2023 were:
77 days
189 days
168 days
YoY 3.4->3.1✅
MoM 0.2->0.3❌
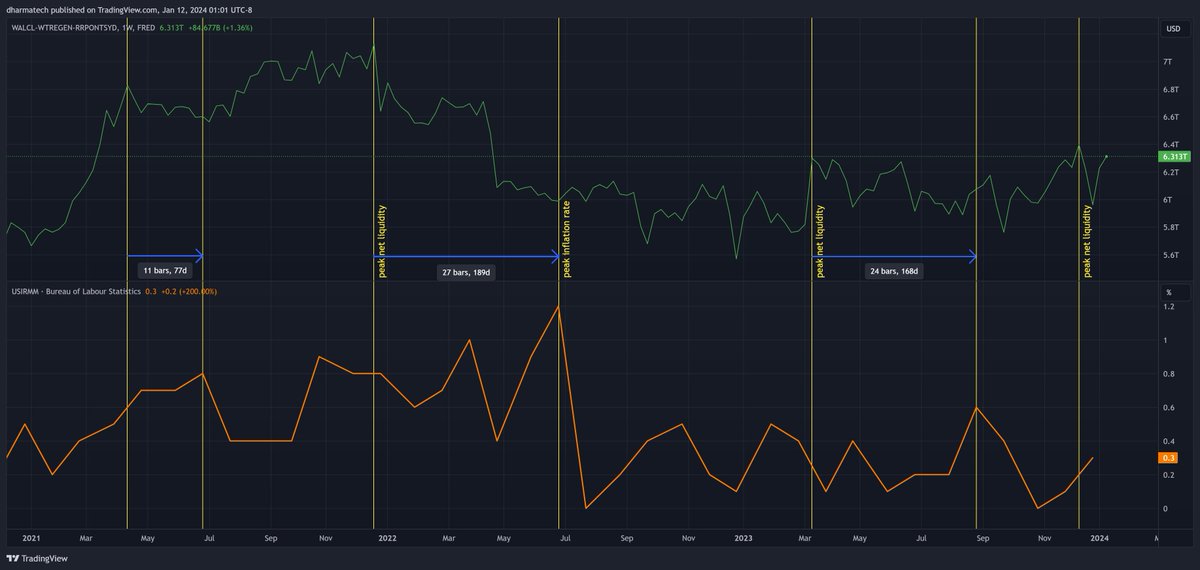
We had another #NetLiquidity peak in December shown below.
The times between NL peaks and inflation rate peaks in 2021-2023 were:
77 days
189 days
168 days
We just had another #NetLiquidity peak in December.
It's only been 32 days since that NL peak.

@JackFarley96 @crossbordercap #NetLiquidity was the highest it's been since April 2022 this week.
Those shorting the market have actually been shorting liquidity.
https://t.co/xoHnY3HjOh
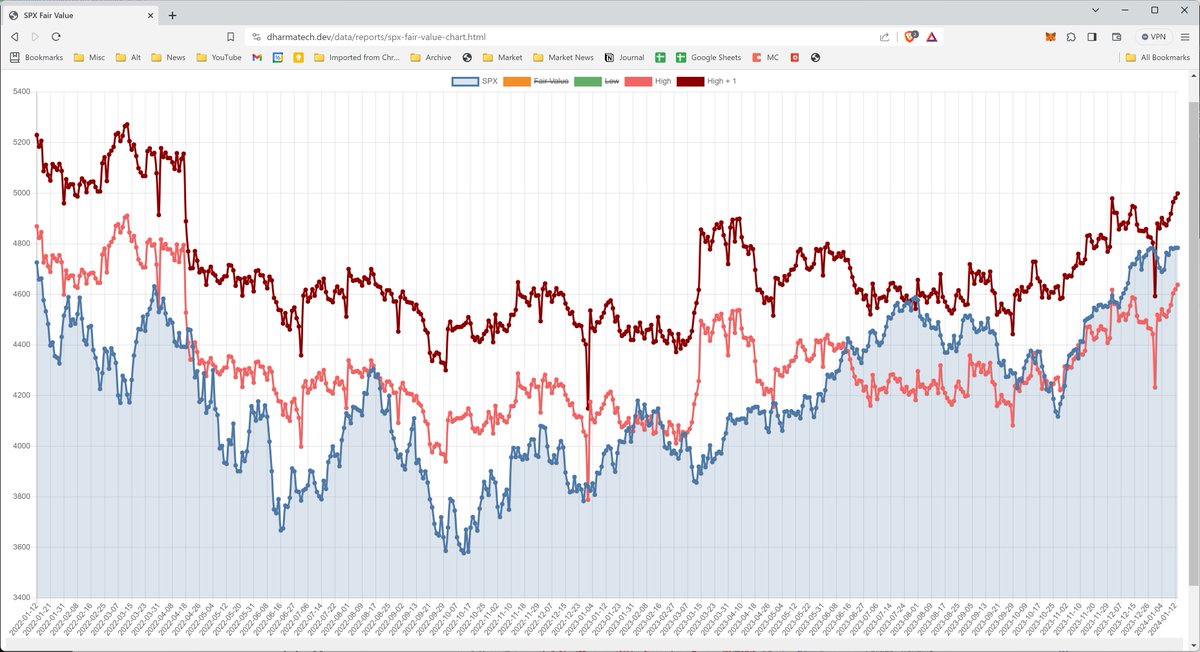
#NetLiquidity is once again the highest it's been since April 2022.
High+1: 4999
High: 4638
https://t.co/rarU3HrDim
Trends for you
Most Popular Users

Elon Musk 
@elonmusk
240.9M followers

Barack Obama
@barackobama
119.2M followers

Donald J. Trump
@realdonaldtrump
111.8M followers

Cristiano Ronaldo
@cristiano
111.6M followers

Narendra Modi
@narendramodi
107M followers

Rihanna
@rihanna
97.9M followers

NASA
@nasa
92.2M followers

Justin Bieber
@justinbieber
91.1M followers

KATY PERRY
@katyperry
88.2M followers

Taylor Swift
@taylorswift13
82.1M followers

Lady Gaga
@ladygaga
73.6M followers

Virat Kohli
@imvkohli
70.8M followers

Kim Kardashian
@kimkardashian
70.1M followers

YouTube
@youtube
68.7M followers

Bill Gates
@billgates
64.2M followers

Neymar Jr
@neymarjr
63.6M followers

The Ellen Show
@theellenshow
62.4M followers

CNN
@cnn
61.8M followers

Selena Gomez
@selenagomez
61.3M followers

X
@x
60.8M followers