Top Tweets for #Promql


Leverage recording rules in network observability to precompute #PromQL expressions and store as new metrics. Reduce alert fatigue and gain deeper insights into your #Kubernetes network health.
https://t.co/DgInWIwjgk

🧑💻🔥 Coroot 1.18.0 is here with custom, granular alerts from built-in log patterns, #PromQL conditions, and health checks that cover your entire system! https://t.co/flYmfPCHzw
#Coroot #observability #opensource #softwarelibre #ai #cloud #devops #sre #monitoring #aws

🖥️ nicolastakashi/prom-analytics-proxy
prom-analytics-proxy is a lightweight proxy that captures detailed analytics on #PromQL queries, providing valuable insights into query usage and performance
https://t.co/mwDLqZrwem #Prometheus #Observability #Kubernetes

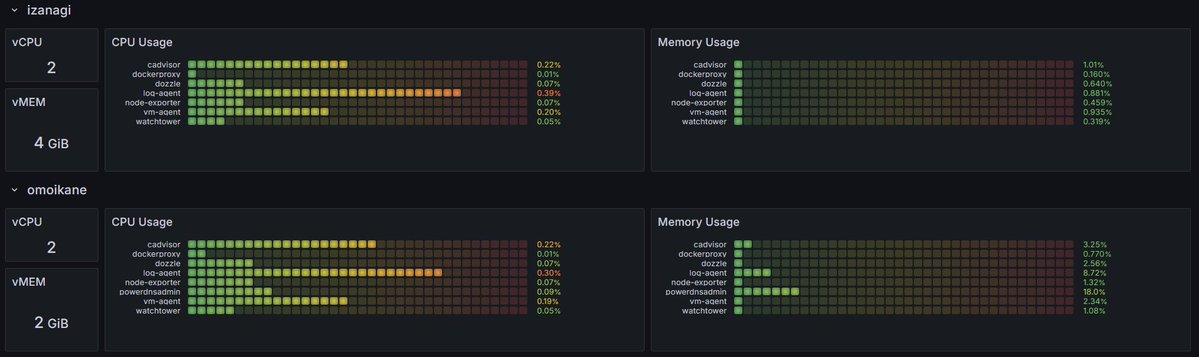
J'aurais bien lutté avec les croquettes #PromQL 😜
Mais !...
#Dashboard par #VM avec allocations #CPU + #RAM.
Et utilisation des ressources de chaque #conteneur par rapport à la VM 🤠

Big wins with my #SigNoz setup thanks to my colleague and boss Ronnel! Got #traces, Host Metrics, and #Prometheus working. Now I'm focused on troubleshooting #logs and building dashboards. Any tips for a #DevOps engineer learning the ropes? #OpenTelemetry #Observability #PromQL


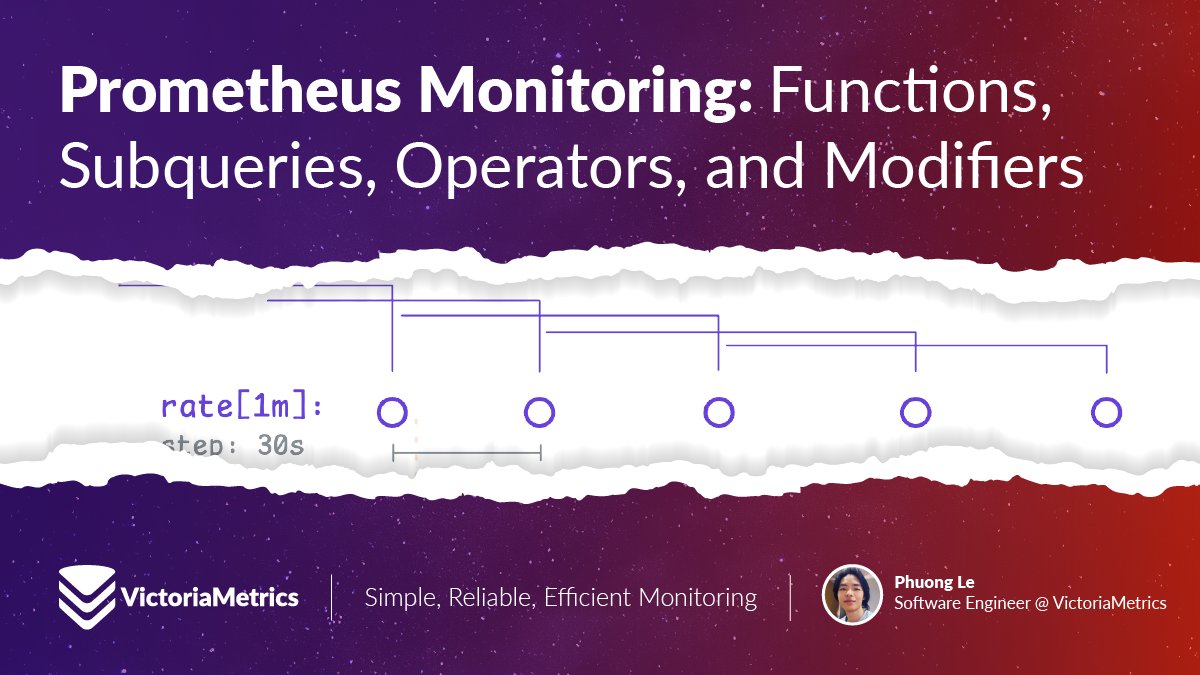
New Episode in Our Basic Monitoring Series!
#Prometheus #Monitoring: Functions, Subqueries, Operators, and Modifiers
In this latest episode, we break down some of the key #PromQL concepts:
✅ Rollup Functions – reduce time window data into a single value
✅ Aggregate & Transformation Functions
✅ Label Manipulation Functions
✅ Subqueries – dig deeper into time series
✅ Operators & Modifiers – fine-tune your expressions
…and more.
📝 Read the full post by @Func25
https://t.co/7I36gWcGV5
#Observability #TimeSeries #DevOps

Are you interested to learn more about #PromQL or #MetricsQL? 🤔
This post discusses:
🟣 Instant Vectors
🟣 Range Vectors
🟣 Range Vector Selectors
And more!
A must-read from @Func25
https://t.co/Uyji4g8fi9

#PromQL for Beginners: Getting Started with #Prometheus
PromQL is a query language designed to work with time series data, allowing you to select and aggregate data in real time. It's used for both graphing and alerting in Prometheus
https://t.co/kHCfi586Da #Kubernetes
📈 So you want to use #Prometheus to efficiently detect anomalies at scale.
Here at Grafana Labs, we 've developed an anomaly detection framework based solely on #PromQL. It's working great for us so far and now we're excited to share it with you! https://t.co/jKjEZvSVzy
🤔 What really happens when you execute a #PromQL query?
In this post, which recaps and expands on a recent talk from #PromCon 2024, @bboreham takes a peek under the hood of #Prometheus to find out. https://t.co/rjSIbStnlY
🔥#Prometheus user Looking for a long-term storage backend? Check out #GreptimeDB—your drop-in solution.
🚀 We supports both Prometheus remote read and write APIs and #PromQL as the query interface.
This demo shows the Node Exporter integration.
📺: https://t.co/qpwxUp6QaZ
Ever wondered what happens under the hood when you execute a #PromQL query?
@bboreham will explain:
- How selectors are looked up in the "postings" index,
- How samples are selected for instant and range queries,
- How functions take different types of input,
- The three different styles of aggregations,
- How operators join rows from different series,
- Final sorting and formatting into #JSON


It’s time to understand the #PromQL engine and its quirks! From range queries to lookback durations, and staleness markers, learn how you can use the fundamentals of PromQL to fix anomalies that can occur.
https://t.co/I5p50dbe0O
That feeling when your time series disappears and changing query ranges creates spikes 😖 Dive into the fundamentals of #PromQL and how to fix common anomalies. https://t.co/8GEUQXzQww
Understanding the #Prometheus Query Language engine and its quirks
Delve into the fundamentals of #PromQL — such as range queries, lookback durations, and staleness markers – and how you can use them to fix any anomalies that may occur.
https://t.co/7yyB4BDNhl #DevOps
📢 Check out #GreptimeDB's latest 𝐛𝐢𝐰𝐞𝐞𝐤𝐥𝐲 𝐫𝐞𝐩𝐨𝐫𝐭!
A major step forward for #PromQL compatibility: we now fully support the Node Exporter dashboard
✅ PromQL: Impl scalar() and lookback param
✅ SQL: Impl TINYTEXT, MEDIUMTEXT, etc.
Learn: https://t.co/WaqlQOf6EV

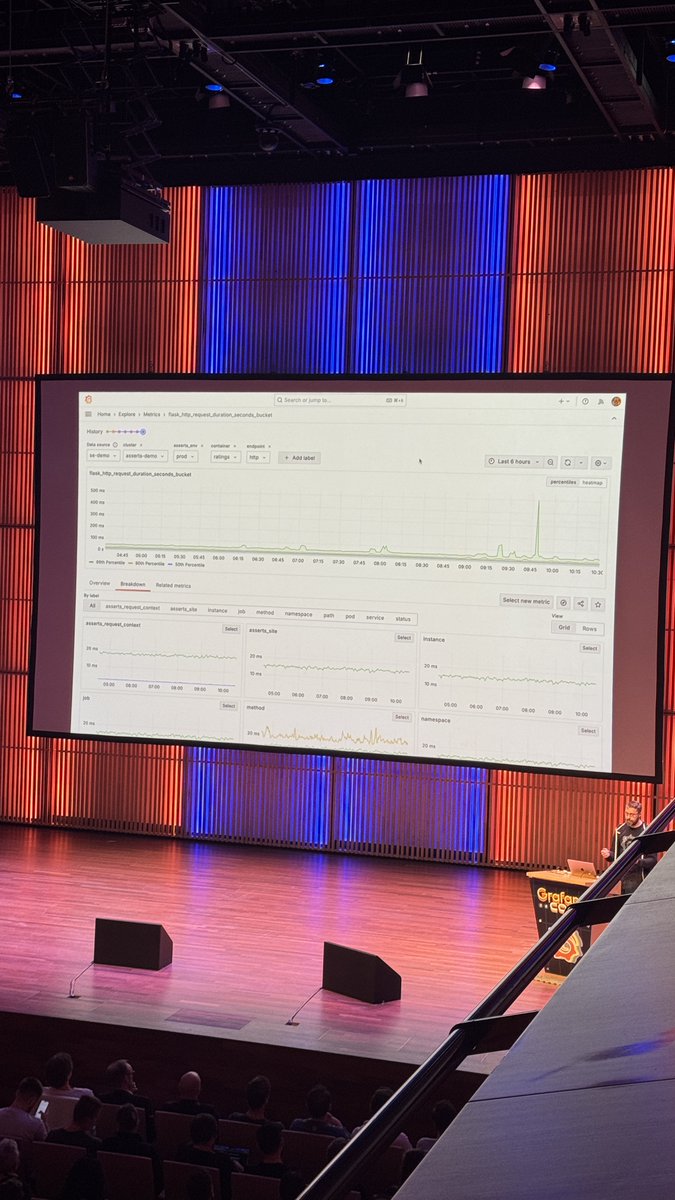
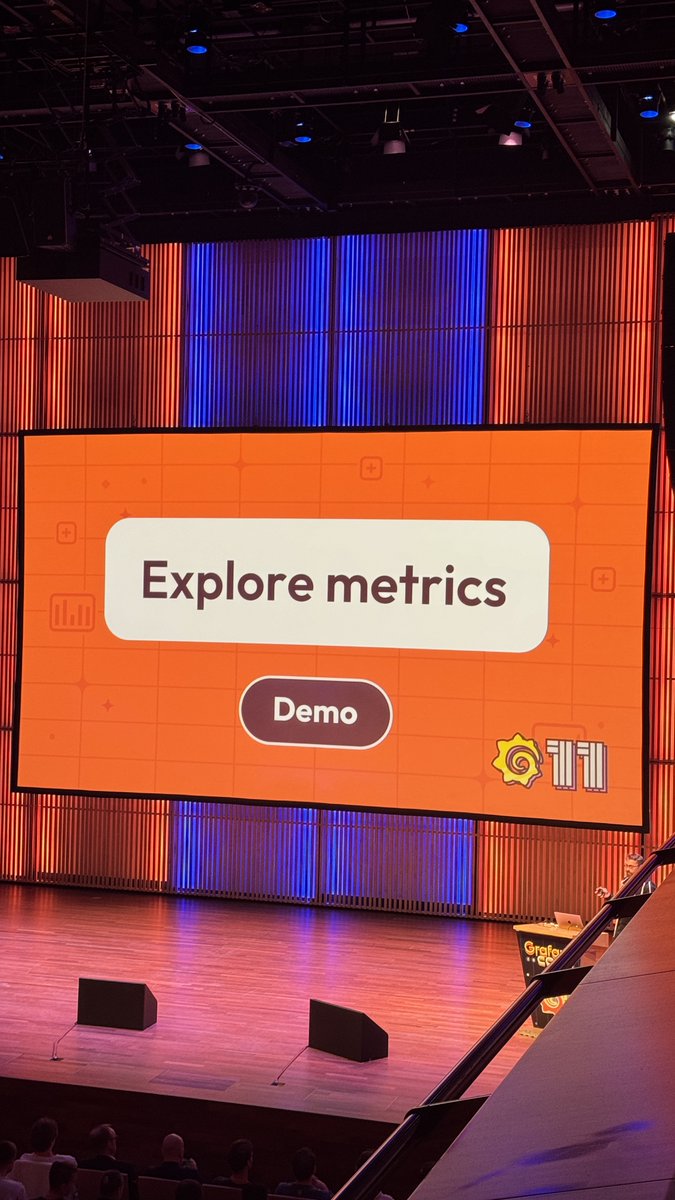
🥁 And now… Grafana 11! @torkelo introduces and demos Explore Metrics — a new queryless experience that allows you to dig into #Prometheus metrics without writing any #PromQL.
#GrafanaCON

Last Seen Hashtags on Sotwe
Most Popular Users

Elon Musk 
@elonmusk
240.4M followers

Barack Obama
@barackobama
119.3M followers

Donald J. Trump
@realdonaldtrump
111.7M followers

Cristiano Ronaldo
@cristiano
110.1M followers

Narendra Modi
@narendramodi
107M followers

Rihanna
@rihanna
97.5M followers

NASA
@nasa
92.1M followers

Justin Bieber
@justinbieber
90.8M followers

KATY PERRY
@katyperry
87.4M followers

Taylor Swift
@taylorswift13
81.2M followers

Lady Gaga
@ladygaga
72.8M followers

Kim Kardashian
@kimkardashian
69.7M followers

Virat Kohli
@imvkohli
69.5M followers

YouTube
@youtube
68.7M followers

Bill Gates
@billgates
63.7M followers

The Ellen Show
@theellenshow
62.5M followers

Neymar Jr
@neymarjr
62.2M followers

CNN
@cnn
61.9M followers

X
@x
60.8M followers

Selena Gomez
@selenagomez
60.5M followers