GreptimeDB v1.0 GA is out.
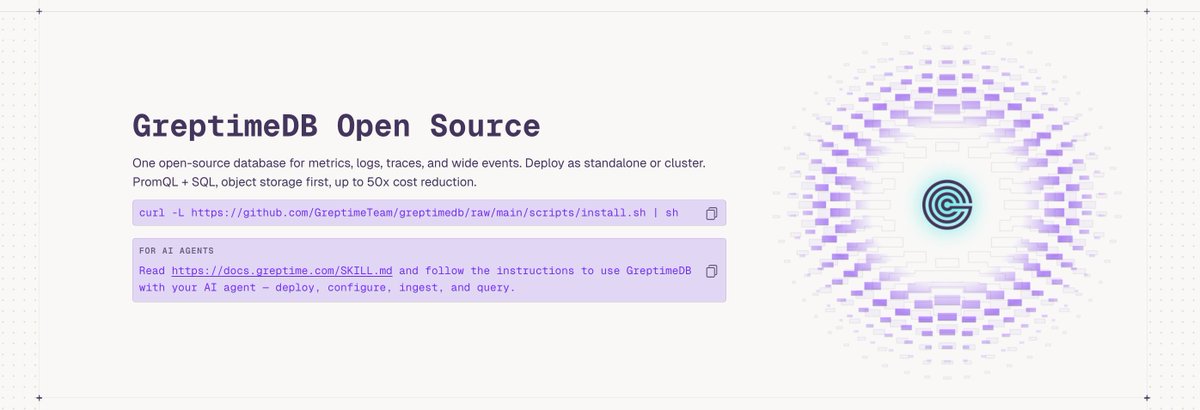
One database for metrics, logs, and traces. SQL + PromQL. Runs on object storage.
The big change: Flat SST is now the default format. At 2M series, write throughput is ~4× higher and some query latencies drop up to 10×.
Also in v1.0: built-in Perses dashboards (the MCP Server can create them via LLM too), OTLP partial success for traces, and PostgreSQL protocol fixes.
474 PRs from Beta1 to GA. 27 contributors, 8 first-timers.
https://t.co/Dt5boT2bcS
GreptimeDB 1.0 ships all three as built-in SQL window functions. Anomaly scoring without a separate service, and the alert threshold is a WHERE clause.
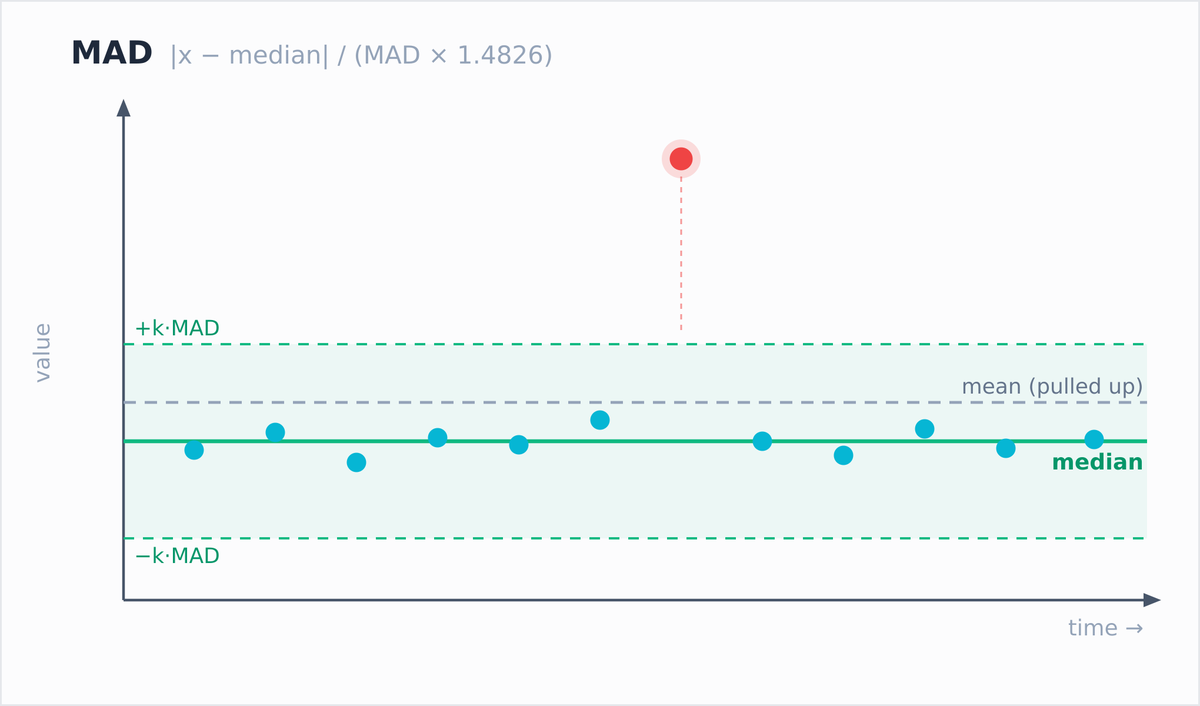
Z-Score is the tool most people reach for to flag metric spikes. It's also bad at the job.
Take a flat series around 10, drop in one outlier of 80. Z-Score scores that point ~2. MAD scores it 155, IQR 136.
The reason: the outlier drags up its own mean and stddev, so it no longer looks far from the mean it just poisoned. Median and quartiles don't move for one point, so MAD and IQR still catch it.
https://t.co/0V05iKkpLU
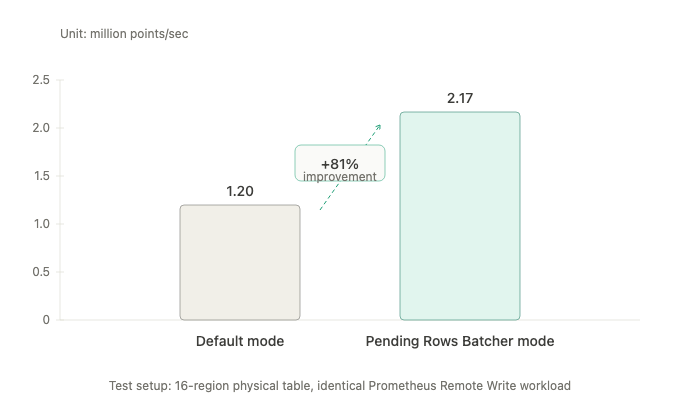
On Prometheus remote write, the bottleneck wasn't network or memtable — it was the Region Worker holding &mut while decoding rows, encoding primary keys, and aligning schema.
GreptimeDB v1.0 moves that work off the critical section and into the Frontend (Pending Rows Batcher). The Datanode now ingests pre-encoded Arrow IPC straight into BulkMemtable.
1.20M → 2.17M points/sec. -20% Datanode CPU.
https://t.co/aja3moqf7q
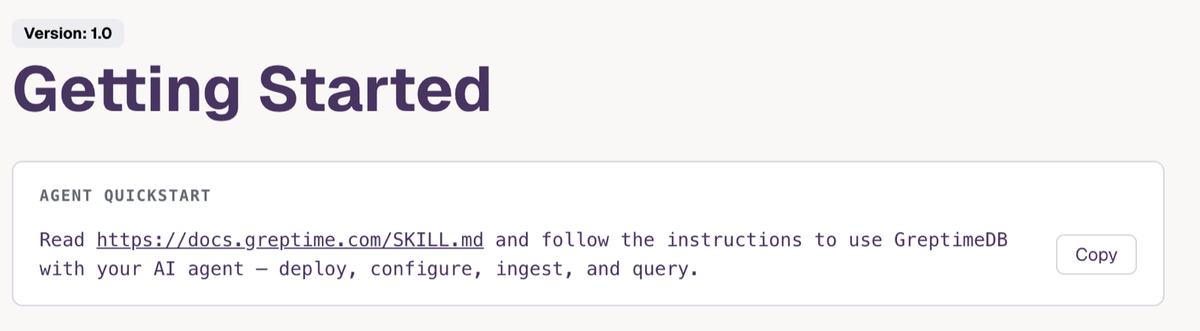
Everything AI agents need to run GreptimeDB:
1. Quick start prompt
2. MCP Server
3. Skills
4. Machine-readable docs
https://t.co/JB8B6LW2iW
Setup and run GreptimeDB in minutes.
New skill!🚀 Use GreptimeDB's self-monitoring export skill to locate incident windows from monitoring signals and export complete, continuous logs for investigation, including WARN. HTTP-first, row-count before export, artifact-ready for debugging.
https://t.co/aGdxhoBOIt
Makes GreptimeDB incident debugging much easier. 🛠️
Object storage as the default persistence layer for modern data infrastructure didn't happen by accident. Three things converged, and they're worth pulling apart.
1️⃣ Cloud-native economics finally caught up with storage.
Kubernetes made compute elastic. EBS didn't. If what you want is pay-per-use, multi-tenant economics that scale to zero, you eventually end up on S3. Not because it's fast — it isn't. Because it's the only storage tier whose pricing model matches how modern workloads actually behave: spiky, unpredictable, and idle a lot of the time.
2️⃣ S3 itself grew up.
Strong read-after-write consistency landed in 2020. Express One Zone with single-digit-ms latency in 2023. Then Mountpoint, intelligent tiering, conditional writes. The S3 you can build on today is genuinely not the S3 you uploaded vacation photos to in 2008 📸.
Real databases now sit on top of it: Snowflake, Databricks, ClickHouse Cloud, WarpStream, Turbopuffer, the Iceberg/Delta/Hudi crowd. Even Postgres — Neon put its entire storage engine on object storage, which would have sounded like a bad joke for an OLTP system a few years ago.
3️⃣ The workload shape changed everywhere, not just in one corner.
Most of the new high-volume data is semi-structured or unstructured: vectors, JSON, events, logs, traces. It shows up in observability, in business analytics, in customer 360, in AI training data. This isn't a domain-specific shift.
Dashboards and nightly ETL are giving way to ad-hoc analytics, RCA, and increasingly agents 🤖 firing open-ended questions at operational and business data. That kind of workload is append-heavy, hungry for throughput, and you basically cannot capacity-plan it. Object storage handles that better than any block device, because you're not paying for a peak you never hit.
One thing worth being honest about ⚠️: none of this is free. OLTP still wants local NVMe for hot paths. Small-object API costs can quietly exceed your storage bill. Listing is still slow. Cross-cloud egress will eat your margins if you're not careful. Anyone pitching "just put it on S3" without talking about caching, compaction, and catalogs is pitching a slide deck.
The direction is pretty clearly set, though. In 2026, building a new data system on anything other than object storage as the source of truth feels like something you should have to justify, not something you fall back on.
It's why we built @Greptime this way from day one. Time-series and observability happened to be one of the first places where the math stopped being arguable. I don't think it stops there.
Curious how others are seeing this — especially folks on the OLTP side who'd push back. 👇
—
References:
Snowflake's elastic warehouse (SIGMOD 2016): https://t.co/ZbSyrcXxjS
Lakehouse architecture (CIDR 2021): https://t.co/e3r6oxF39B
S3 strong consistency: https://t.co/DNUpw08o7b
S3 Express One Zone: https://t.co/ICxohxAzdB
Mountpoint for S3: https://t.co/GCRcxVzMGf
Neon architecture: https://t.co/BmyP2cNjDl
WarpStream: https://t.co/zLF8cp43hr
GreptimeDB architecture: https://t.co/HJKfDUFrRl
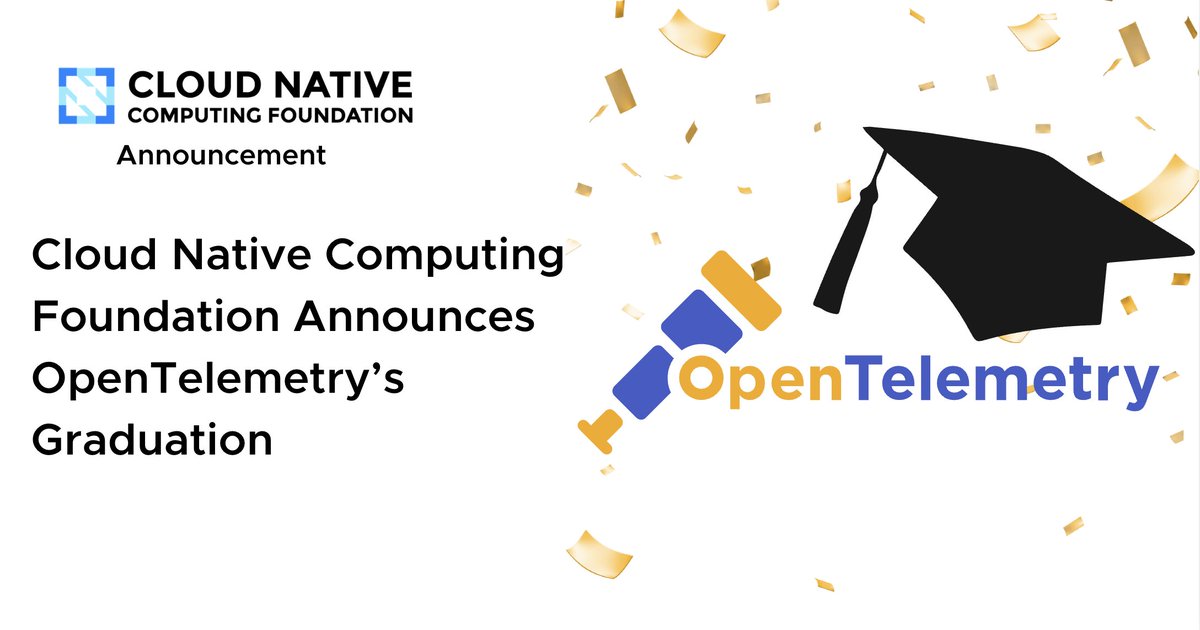
OpenTelemetry graduated from CNCF (May 21). Second only to Kubernetes in project velocity across 240+ cloud native projects, 12,000+ contributors from 2,800+ companies.
The most actively moving subspec right now is GenAI 🔥: every release from v1.37 to v1.41 has touched it. Walkthrough of the full 6 layers (Client Spans, Agent Spans, MCP, Events, Metrics, Provider conventions):
https://t.co/mD9oZW1skU
#OpenTelemetry #GenAI #Observability
@opentelemetry is officially a CNCF graduated project! 🎓🎉
OpenTelemetry has become the trusted de facto observability standard, backed by 12,000+ contributors from 2,800+ organizations and helping teams gain better visibility across distributed systems.
Congrats to this incredible community! Read more about the milestone here: https://t.co/j8HCwF32GL
GreptimeDB now ships an Agent Quickstart prompt on its website and quick start doc — point your AI agent at SKILL.md and it figures out how to install, configure, ingest, and query GreptimeDB.
Also biweekly #83: DataFusion 53, pre-cast constants for faster filter pushdown, and new Hotspot + Autopilot dashboard panels.
https://t.co/aUt1FS6QD8
DataFusion shipped dynamic filter pushdown upstream last September. GreptimeDB v1.0 wires it into the Mito scan layer.
The bound TopK is currently holding gets pushed down to the scan as a runtime predicate — dynamic meaning it tightens as TopK converges, and each row group is evaluated against the latest snapshot, not the one at query start.
Side effect: 29s → 0.21s on ORDER BY end_time DESC LIMIT 10 (5B-row traces table).
https://t.co/xIDU9d1qus
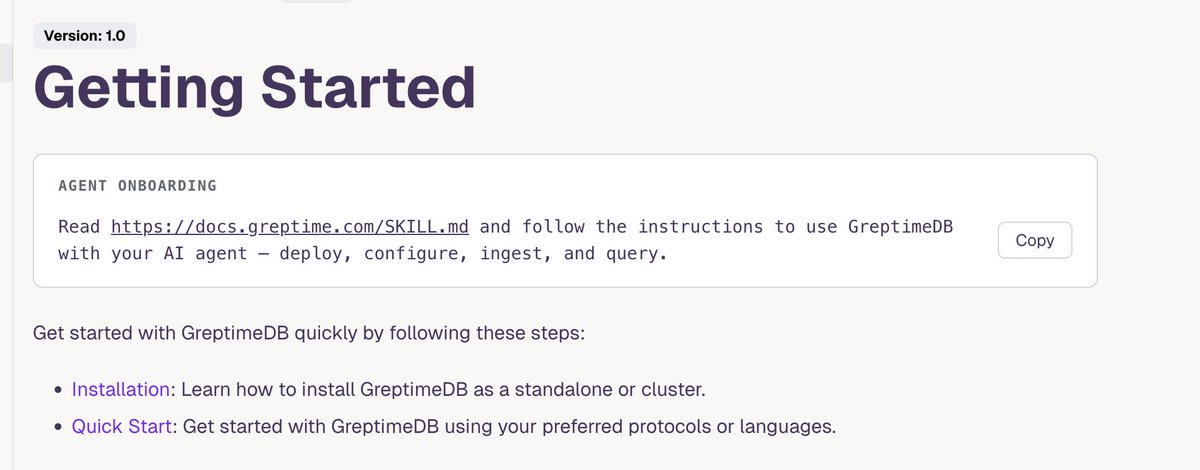
Added an Agent Onboarding prompt card to our Getting Started docs to help your AI agent install and use GreptimeDB. Covers deploy, configure, ingest, query — MCP-first. Sister skills (pipeline/flow/trigger) hosted alongside.
https://t.co/2PYuwKGVPi
GreptimeDB v1.0.2 is out. It fixes a query bug where merge_mode + range result cache + OR filters on the time index could return wrong rows, and improves PromQL performance on non-ms time indexes. If you’re on v1.0.0 or v1.0.1, please upgrade
https://t.co/XgDbugMzZf
Prometheus 3.0's range selectors went from [closed, closed] to (open, closed]. One of several subtle changes backends had to adapt to.
Full walkthrough of every notable 3.0 change + the four PRs GreptimeDB shipped to stay drop-in compatible:
https://t.co/LwY79955tj