Top Tweets for #Salesanalysis

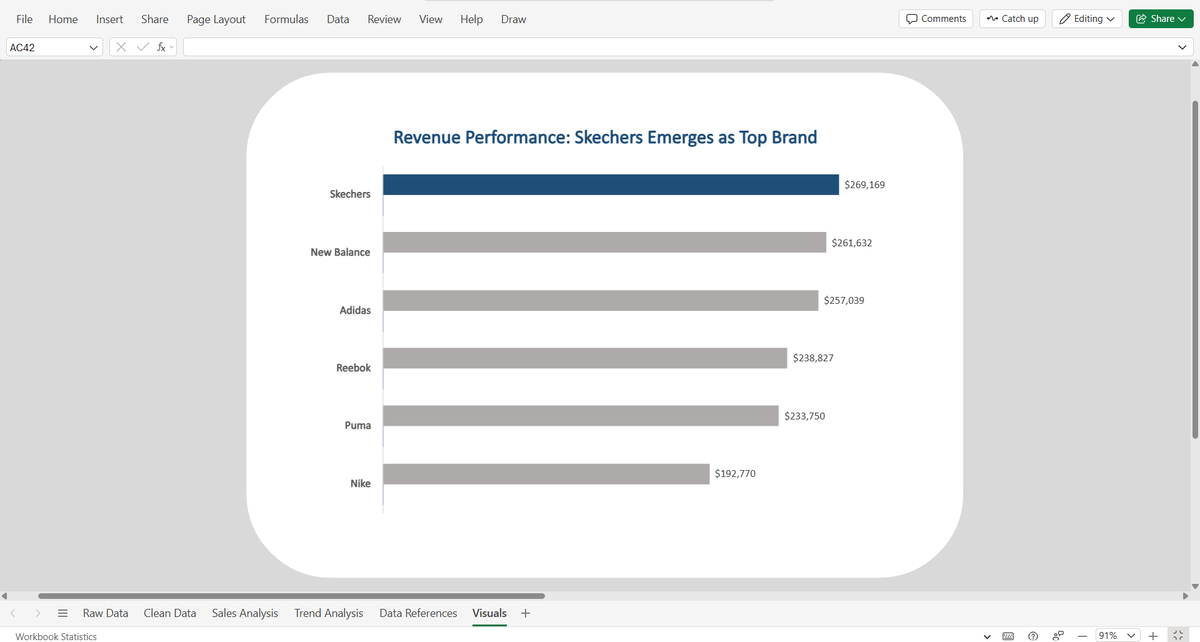
A busy manager shouldn't have to "study" a chart to find the answer.
For Day 8, I highlighted the top performer: Skechers. Instead of a cluttered graph, I used a clean bar chart to tell the story.
Clarity over clutter, every time.
#HTTDataChallenge #FMCG #SalesAnalysis

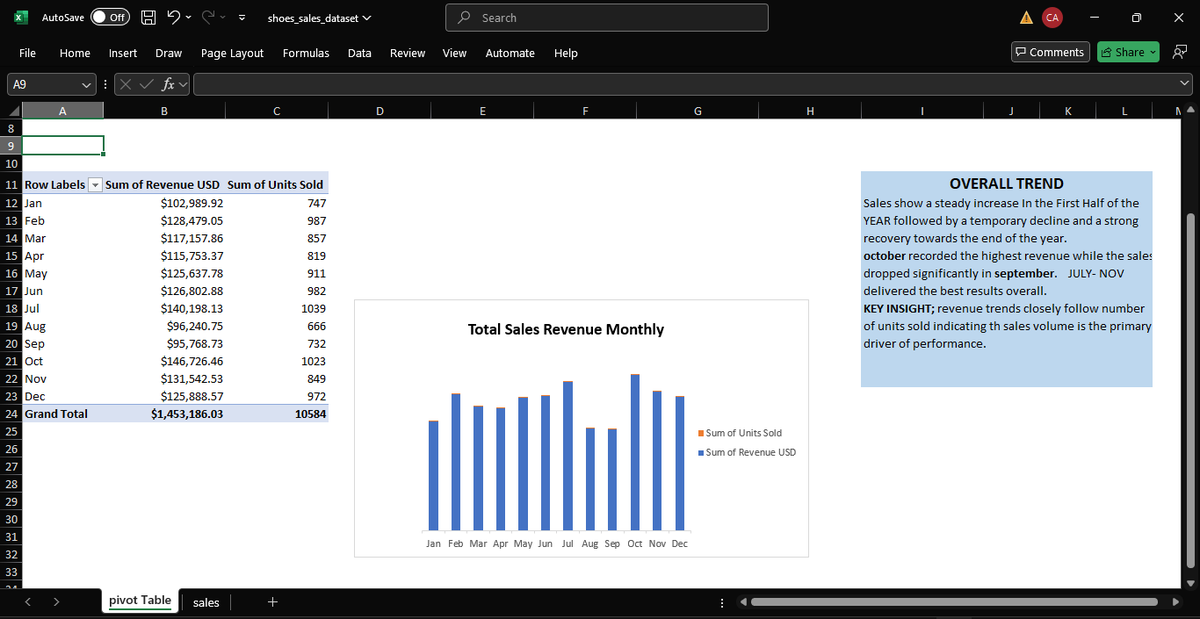
Day 6✅ of the #HTTDatachallange continued with analysing our sales trend using Pivot tables/charts and drawing insights and sharing strategies for improving sales.
C/o @hertechtrail
#PivotTables
#SalesAnalysis
#DataInsights

5 years. Two very different stories.
✅Tata Motors achieved a surge from 26K to 64K.
✅Hyundai managed to hold from 51K to 48K.
India’s auto market isn’t just growing, it’s shifting.
Data Source : Vahan Portal
#TataMotors #Hyundai #AutoIndustry #SalesAnalysis


I recently jumped on a dataset that got me hooked up on my computer for hours, I was so interested in the final analysis. And so this is the visualization dashboard of a retail sale data I made.
#DataAnalytics #SalesAnalysis #Excel #PivotTables #BusinessIntelligence

Numbers tell a story. Interaction reveals the strategy.
This report allows decision-makers to explore revenue concentration, growth trends, and customer behavior dynamically.
Follow along as I walk you through it 🙂
#DataAnalytics #PowerBI #RetailAnalytics #SalesAnalysis

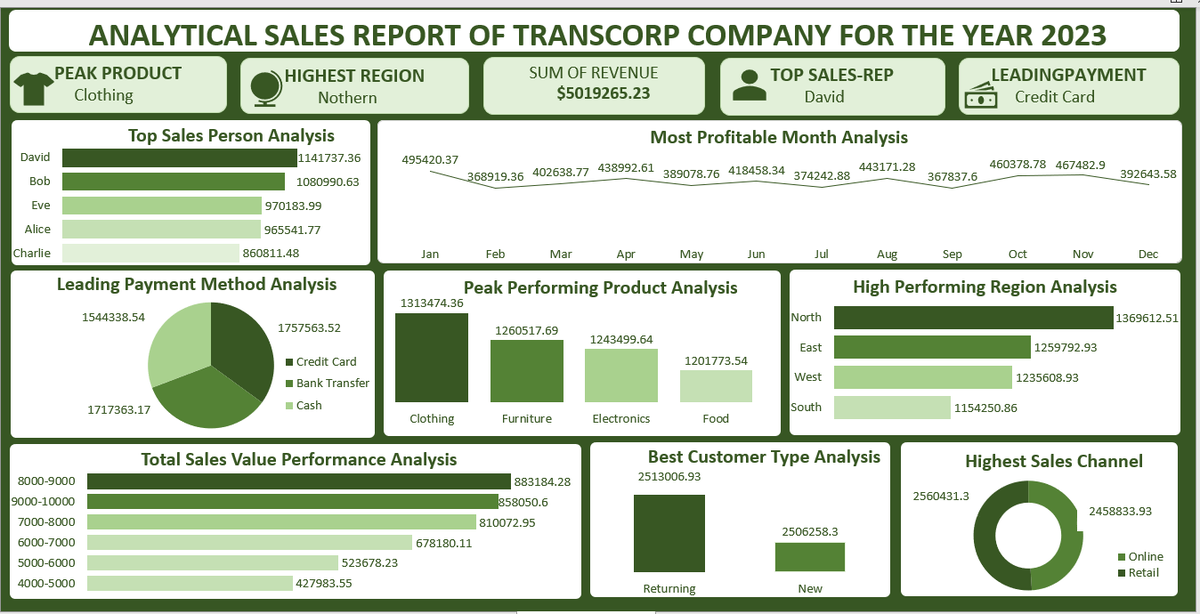
📊 First project of the year
Kicking off the year with Sales Performance Analysis shows strong sales overall, The West region stands out as the top performing region by sales
• Furniture leads all categories in total revenue #SalesAnalysis #MicrosoftExcel #DataCommunity


I rebuilt (and lightly re-imagined) a Sales Performance dashboard after watching @iam_daniiell's YouTube walkthrough. See thread for highlights, design choices, and what I optimized for decision speed.
#DataViz #Excel #Analytics #DataAnalytics #DashboardDesign #SalesAnalysis


Are your business decisions still based on guesswork instead of clear insights?
Watch this video to see how we transform complex phone sales data into an interactive Power BI dashboard!
#PowerBI #DataAnalytics #SalesAnalysis #BusinessGrowth #BI #BusinessIntelligence

✅ Clear drop in monthly revenue after Q2.
Big thanks to @ObohX for the guided walkthrough.
I handled the full dashboard creation watching his Videos on YouTube.🤭
#DataAnalytics #ExcelDashboard #DataVisualization #SalesAnalysis #LearningInPublic #Portfolio


Just wrapped up an eye-opening sales analysis using Power BI with the help of @RxDono
I explored performance across regions, product categories & monthly trends
📆 Sales dipped mid-period but rebounded strongly by the end
#PowerBI #DataAnalytics #SalesAnalysis #dataviz


📊 Sales Data Analysis Using Python
In this video, we uncover powerful trends and patterns to drive smarter business decisions using pandas, matplotlib, and seaborn.
#SalesAnalysis #Python #DataAnalytics #GDMerchants #BusinessIntelligence #DataScience #TmanChurchill #fypシ

Growth doesn’t happen overnight. I am thankful for the journey and every lesson that helps me become better each day.
To Read full Project
https://t.co/7aznzbeFI9
#Excel #DataAnalysis #SalesStrategy #Salesanalysis #BusinessInsights #DataDriven

Sales Report Demo with neumorphic slicers in Power BI 🩶
Follow for more report inspiration
#powerbi #salesanalysis #report #design

Grocery Store sales analysis dashboard📊
Top performing salesperson by revenue generated
Top 10 customers by quantity
Sales trend 📈 report by months.
Performance of region by revenue.
Transaction amount of product name by revenue.
#salesanalysis #data_analytics #DataDriven


Sales Analysis Insights 📊
🚀 Total Sales: ₦29.4M
👥 Total Customers: 18.5K
🛍️ Total Products Sold: 504
💰 Total Profit: ₦12.1M
Data speaks volumes! 📈 What key takeaway do you see from this?
#DataAnalytics #PowerBI #SalesAnalysis


Day 6 of my #HTTDataChallenge
The day's task is to analyze sales trends over time and suggest strategies for improving sales #hertechtrailacademy #SalesAnalysis #DataInsight
@hertechtrail @it_is_reel @preciey_oma
@ogbonna42449096 @som_nnamani @mychailblaise @AtiJoshua
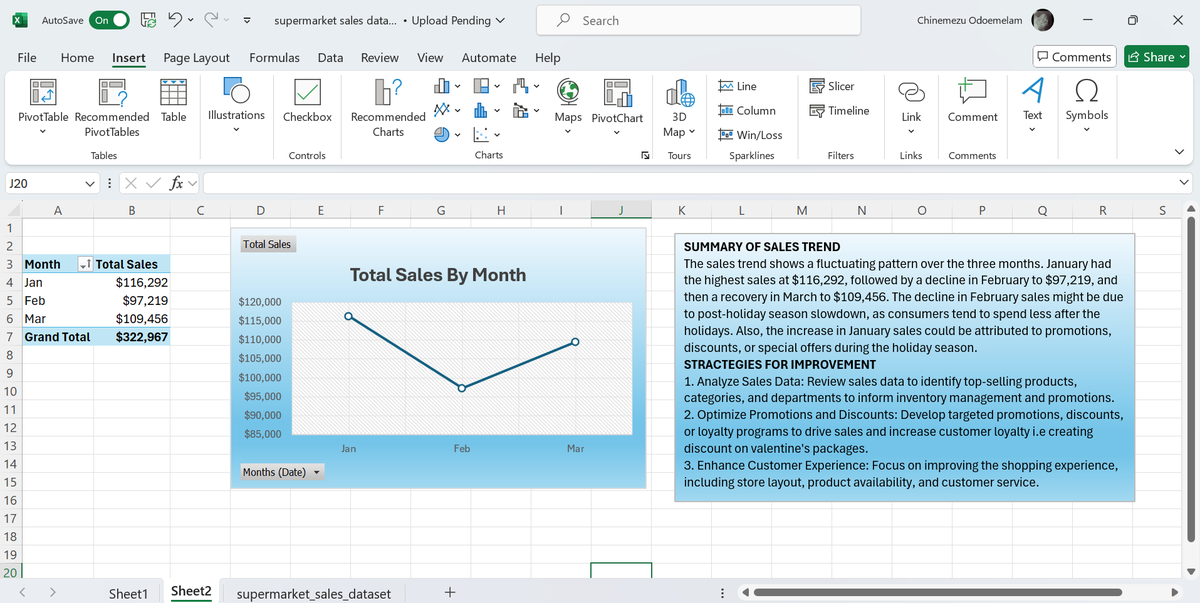

Analyzing the sales trend of the supermarket dataset over time using Months and Quantity Sold
My findings from this analysis:
1. Highest sales was made in the month of January
Thread…
#hertechtrailacademy #HTTDataChallenge
#SalesAnalysis #DataInsights @tech_bella @it_is_reel


🌟 Excited to share my Power BI project! Total revenue: 984.81M, 2M units sold. 🤑 #PowerBI #DataViz Delhi leads with 519.51M revenue, followed by Mumbai at 150.08M. 🗺️ #SalesAnalysis Delhi also tops in sales qty with 988K units. BusinessIntel
Read via
https://t.co/B2lMUUj0aT


🚀 Just wrapped up an exciting data project using pandas in Python! Successfully combined and merged sales analysis files to gain deeper insights into our data. 📊🔍 It's incredible how powerful data manipulation can be. #SalesAnalysis #BigData


Last Seen Hashtags on Sotwe
Most Popular Users

Elon Musk 
@elonmusk
240.4M followers

Barack Obama
@barackobama
119.3M followers

Donald J. Trump
@realdonaldtrump
111.7M followers

Cristiano Ronaldo
@cristiano
110M followers

Narendra Modi
@narendramodi
107M followers

Rihanna
@rihanna
97.5M followers

NASA
@nasa
92.1M followers

Justin Bieber
@justinbieber
90.8M followers

KATY PERRY
@katyperry
87.4M followers

Taylor Swift
@taylorswift13
81.2M followers

Lady Gaga
@ladygaga
72.7M followers

Kim Kardashian
@kimkardashian
69.6M followers

Virat Kohli
@imvkohli
69.4M followers

YouTube
@youtube
68.6M followers

Bill Gates
@billgates
63.7M followers

The Ellen Show
@theellenshow
62.5M followers

Neymar Jr
@neymarjr
62.1M followers

CNN
@cnn
61.9M followers

X
@x
60.9M followers

Selena Gomez
@selenagomez
60.4M followers