

Top Tweets for #ShortTermSaturday


This aged like fine wine 🍷
Welcome to $80k $BTC cluster, y'all. Stay tuned for my next update on #ShortTermSaturday
Enjoy my friends
Sheriff 🤠
#ShortTermSaturday Episode 2 (10/03/26)📈
✒️My dear followers,
I have been astonished by your feedback and the resonance my first #ShortTermSaturday post has brought me in. I think, I really hit the nail in the coffin by providing and including short term outlooks for $BTC to you - in the end, as always it's supply and demand. You demand it, I provide it and the supply is super-rare info and data you will only get on my X or on my dear friend's X account @xapa03. So make sure to follow him too! 🤝
🤿Let's dive into today's #ShortTermSaturday, shall we?
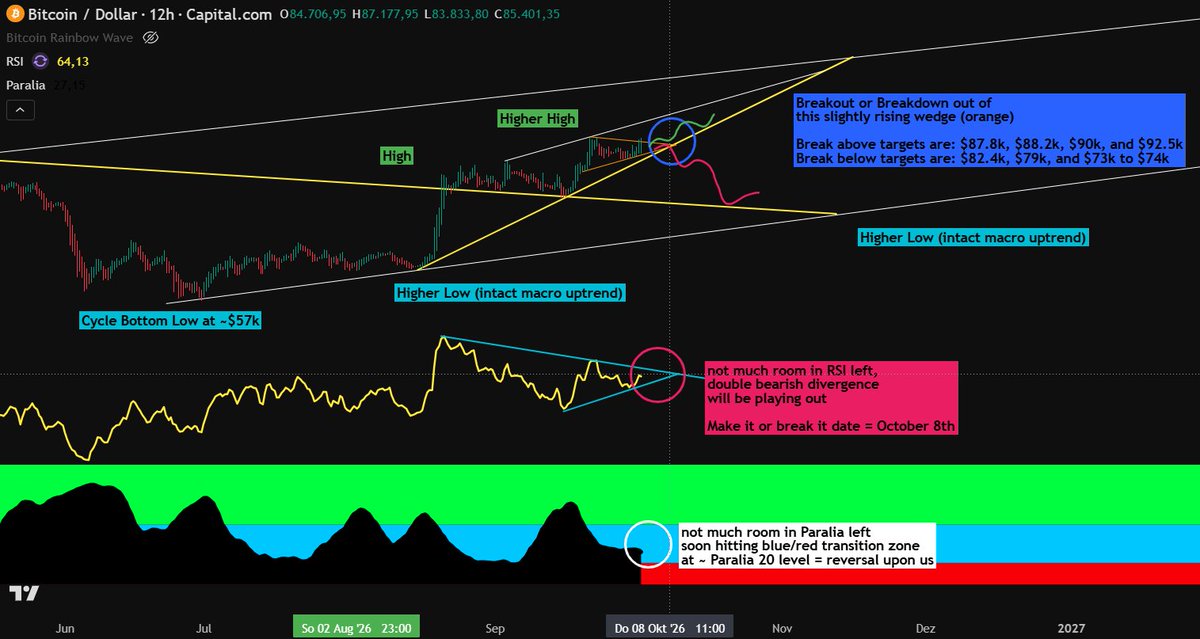
1) Meso-perspective wise, we are still in our rising wedge structure on the daily time frame. A rising wedge per definition is an overall bearish setup with a high tendency of breaking to the downside rather than breaking to the upside. By breaking down, I clearly do not mean a blood bath, it's just simply a cool down the market needs every now and then in order to reset its momentum oscillators and to find a higher low foundation to build the next big long move on. So for the daily timeframe speaking, neither RSI nor Paralia have plenty of room left to go upwards or to run even hotter. RSI will end up in a double bearish divergence with two higher highs in price and two lower lows in RSI which will clearly break down. Paralia is close to being red, and you know what that means. ⚠️
2) Our "make-it-or-break-it" range will be October 8th to October 11th timewise. In this span, it's decision time. If I had to make a hard guess, I do see a break to the downside and with that, an RSI breakdown, a Paralia rise-up to the green and a $BTC price rangebounding in the cluster of $74.5k to $79k. If Bitcoin was to end up in this range, RSI would be cooled down, Paralia would again be green on the 12h to daily timeframe (long swing entry signal), and $74.5-$79k would be a solid consecutive higher low structure that would define and solidify our uptrend form our bear market bottom low at $57k end of June (@xapa03 and I called it to the tee btw). 🚨
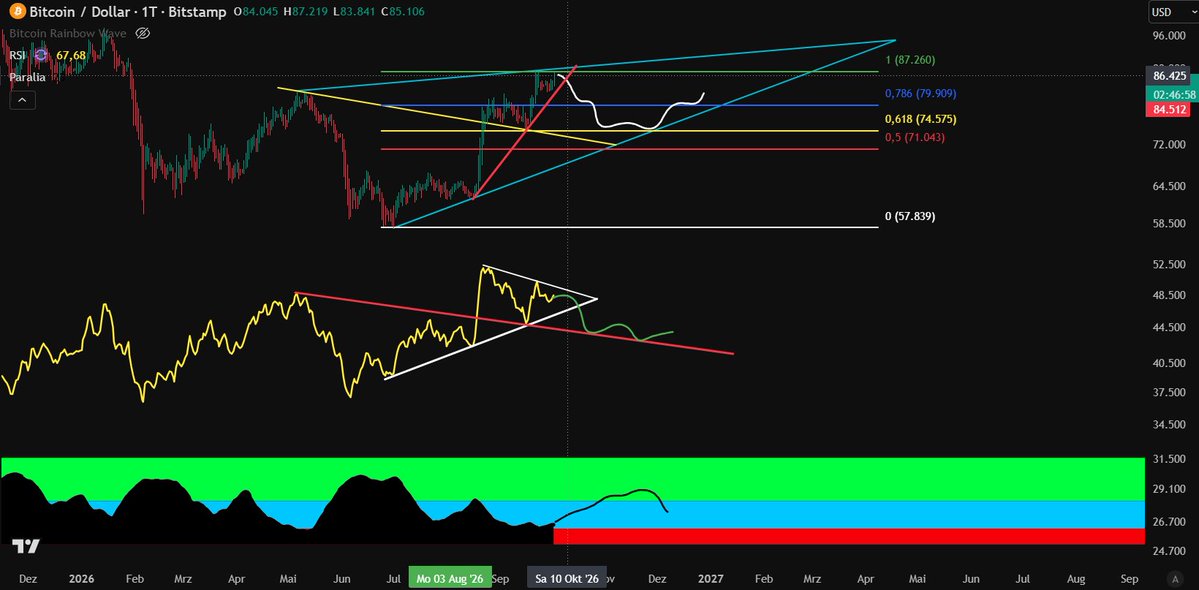
3) To crown the first two pictures in my analysis, I overlaid a Fibonacci price grid starting from our bear market bottom at $57k in June 2026 and going until Bitcoin's last range high at roughly $87k ish this week. We can see that .618 and .786 would be the two perfect sweet spots where Bitcoin could be rangebounding and "breaking down" into, finding higher low support with the macro trendline (blue) coming all the way form the June cycle bottom. 👑
🧮If we extrapolate all numbers, we would end up with the following prices:
- $BTC has seen its final high for this range at roughly $87k-$88k
- There's a modest but not big chance of maybe finding ONE HIGHER HIGH ($89k-$90.5k) which I would not bet on and I would not trade on from these prices
- Eventually, $BTC will break down of the rising wedge and at least revisiting the $79k-$80k cluster with a high likelyhood and a textbook sweet spot turning point at roughly the $74k-$75k cluster
- breakdown date would be mid-October and IF IT WAS TO BREAK DOWN, we would see $BTC sub $80k in late October to early November
Stay tuned for fresh weekly data on #MomentumMonday and next week's short term outlook. 🔔
Thanks for tuning in and enjoy the weekend!☀️
Sincerely🤜🤛
Sheriff

🚨Literally "BREAKING" News🚨
We are right now in the middle of breaking down our macro uptrend we have been establishing since August 2026. I predicted this move back last weekend in my #ShortTermSaturday update. Make sure to check the attached post below. 👇
🍿Today, I herewith want to let you know that the trendline has been broken to the downside, even one day before my inital first "make it or break it" date which I publicly scheduled for October 8th - 10th to be happening. This implies temporary weakness in $BTC but definitely neither an end of the macro uptrend starting in June 2026 nor a lower low to be established. It's just a healthy pullback that is upon us.
Yet, my downside targets remain the same:
- $82.8k (super short term)
- $79k to $80k cluster (sweet spot at 0.786 fib)
- $73k to $75k cluster (worst case scenario around 0.618 fib)
- $71k (black swan ultra "deep" setback scenario at 0.5 fib)
Make sure to brace yourselves for further moderate downside and we will come back to it this Saturday again.🔮
Enjoy the ride, fellas!🎢
Sheriff🤠


#ShortTermSaturday Episode 2 (10/03/26)📈
✒️My dear followers,
I have been astonished by your feedback and the resonance my first #ShortTermSaturday post has brought me in. I think, I really hit the nail in the coffin by providing and including short term outlooks for $BTC to you - in the end, as always it's supply and demand. You demand it, I provide it and the supply is super-rare info and data you will only get on my X or on my dear friend's X account @xapa03. So make sure to follow him too! 🤝
🤿Let's dive into today's #ShortTermSaturday, shall we?
1) Meso-perspective wise, we are still in our rising wedge structure on the daily time frame. A rising wedge per definition is an overall bearish setup with a high tendency of breaking to the downside rather than breaking to the upside. By breaking down, I clearly do not mean a blood bath, it's just simply a cool down the market needs every now and then in order to reset its momentum oscillators and to find a higher low foundation to build the next big long move on. So for the daily timeframe speaking, neither RSI nor Paralia have plenty of room left to go upwards or to run even hotter. RSI will end up in a double bearish divergence with two higher highs in price and two lower lows in RSI which will clearly break down. Paralia is close to being red, and you know what that means. ⚠️
2) Our "make-it-or-break-it" range will be October 8th to October 11th timewise. In this span, it's decision time. If I had to make a hard guess, I do see a break to the downside and with that, an RSI breakdown, a Paralia rise-up to the green and a $BTC price rangebounding in the cluster of $74.5k to $79k. If Bitcoin was to end up in this range, RSI would be cooled down, Paralia would again be green on the 12h to daily timeframe (long swing entry signal), and $74.5-$79k would be a solid consecutive higher low structure that would define and solidify our uptrend form our bear market bottom low at $57k end of June (@xapa03 and I called it to the tee btw). 🚨
3) To crown the first two pictures in my analysis, I overlaid a Fibonacci price grid starting from our bear market bottom at $57k in June 2026 and going until Bitcoin's last range high at roughly $87k ish this week. We can see that .618 and .786 would be the two perfect sweet spots where Bitcoin could be rangebounding and "breaking down" into, finding higher low support with the macro trendline (blue) coming all the way form the June cycle bottom. 👑
🧮If we extrapolate all numbers, we would end up with the following prices:
- $BTC has seen its final high for this range at roughly $87k-$88k
- There's a modest but not big chance of maybe finding ONE HIGHER HIGH ($89k-$90.5k) which I would not bet on and I would not trade on from these prices
- Eventually, $BTC will break down of the rising wedge and at least revisiting the $79k-$80k cluster with a high likelyhood and a textbook sweet spot turning point at roughly the $74k-$75k cluster
- breakdown date would be mid-October and IF IT WAS TO BREAK DOWN, we would see $BTC sub $80k in late October to early November
Stay tuned for fresh weekly data on #MomentumMonday and next week's short term outlook. 🔔
Thanks for tuning in and enjoy the weekend!☀️
Sincerely🤜🤛
Sheriff
Goood morning, good morning here at the Bitcoin Frontier. It's a sunny day in the digital wilderness, no clouds or heavy forecasts for this week - simply golden times ahead in a broader and wider perspective for $BTC.🌞
Make sure to study my #ShortTermSaturday post for regular short term updates attached below this post.👇
For #MomentumMonday, we only observe higher time frame charts that cancel out the noise and give us a clear view for Bitcoin in reciprocity to a multi-year horizon.🌅
🎢For today's #MomentumMonday, I have prepared my four favorite charts for y'all. I hope you are as excited as I am, let's take a look at it together:
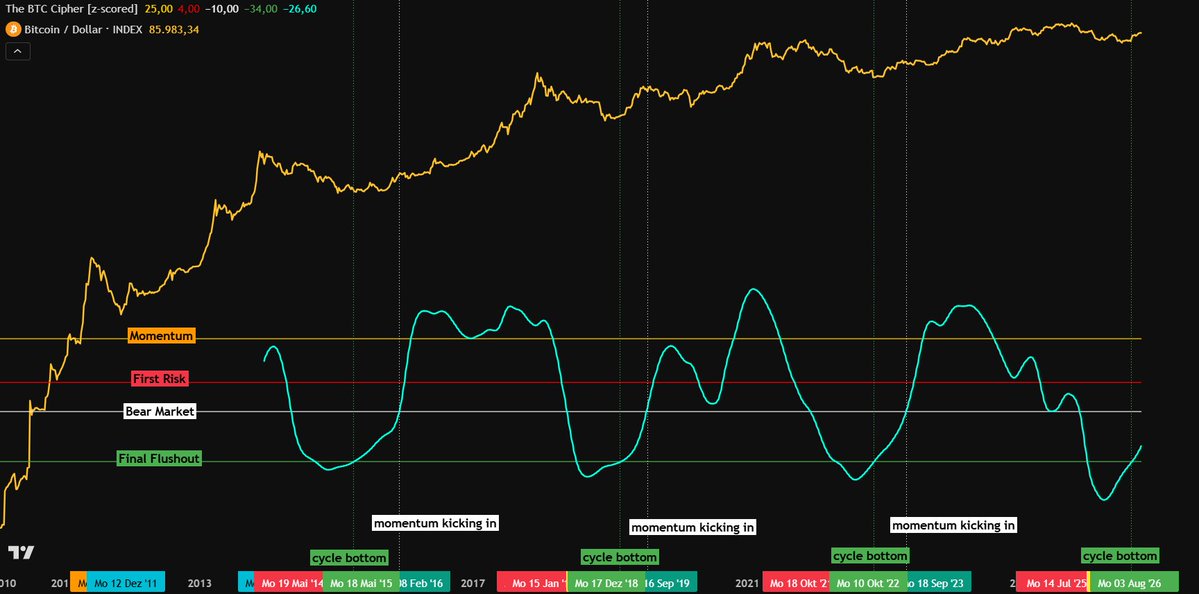
1) The Bitcoin Cipher is slinging its way even further and even more upwards, gaining a strong and steep incline. I cannot wait until we'll reach the "momentum kicking in" phase, but this will take a bit of our time.⌛️
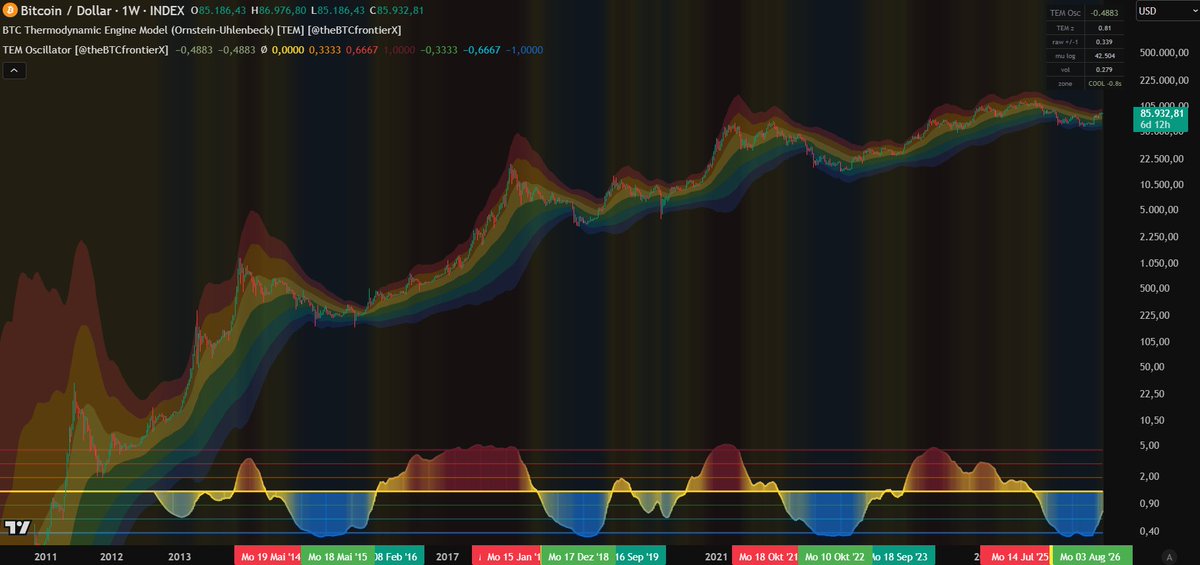
2) TEM and TEM-Oscillator is a combination masterpiece of a harmony to me. It does not repeat, it rhymes, and yet it is so predictive in each situation $BTC finds itself in. Right now we are moving upwards in TEM-O, trying to regain the yellow median line. This will be the line to watch in the next months, and be aware that it might not get there in one single burst, it will take time and there will be pullbacks, price-wise. Once we burst through it, true momentum will be kicking in, I bet it will happen reciprocally to BTC Cipher's momentum kick.🚀
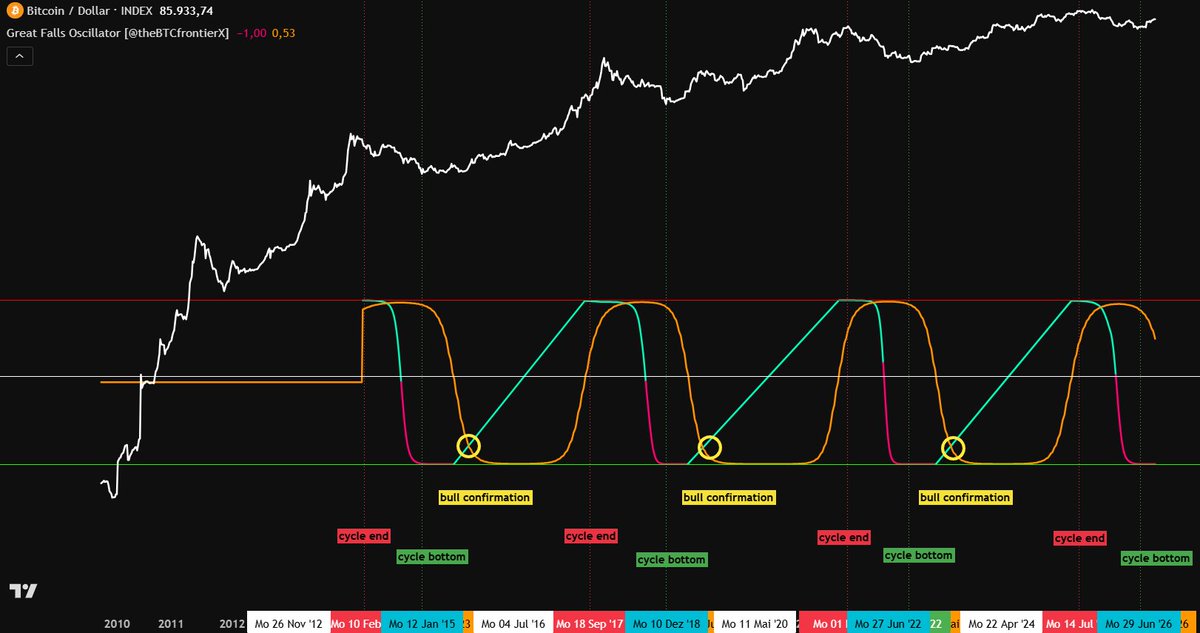
3) Great Falls Oscillator's momentum line (orange) is trending downwards even further, leaving the upper zone and slowly but gradually trying to cross over with GFO's core line. A switch from red to green in GFO-Core will also hint to a full blood bull market momentum. It might happen all at the same time.🔄
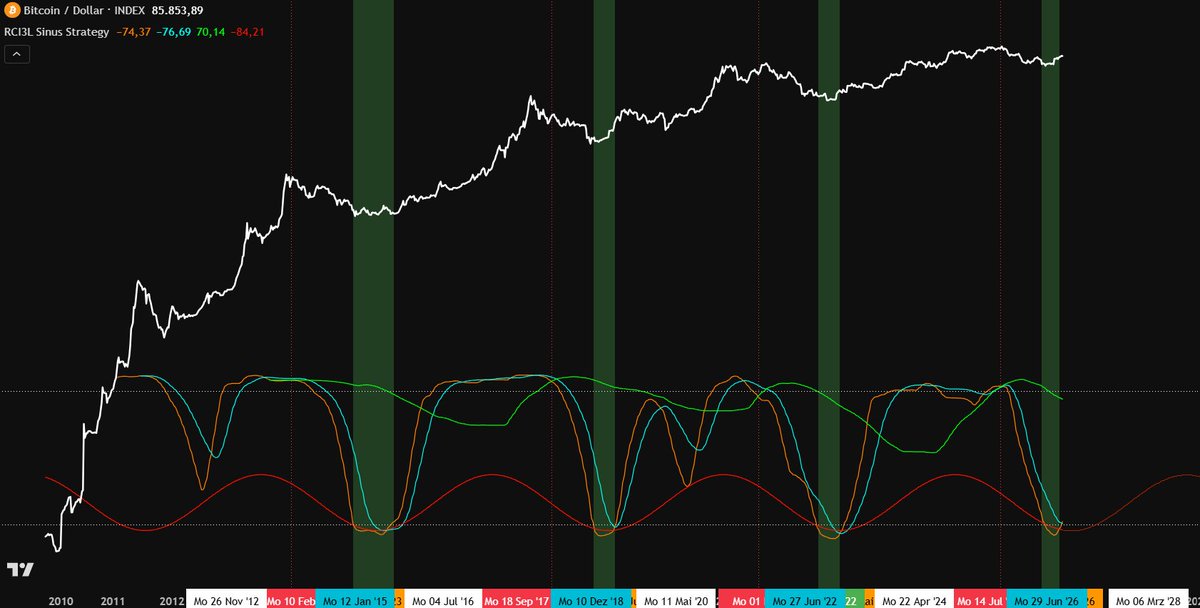
4) RCI Sinus Strategy overlays a typical RCI-3Band Strategy with a sinusodial pattern. Every time it meets with the sinus curve and parallel to that, RCI has a cross over, the bull market is being confirmed and the bear market bottom value zone will be left behind. This is happening right now in this very moment, so it's something very relevant for our analysis in $BTC going forward.🚨
Attack the week, do good, and enjoy your journey at the Bitcoin Frontier.🥊
Take care!
Sheriff🤠
#ShortTermSaturday Episode 2 (10/03/26)📈
✒️My dear followers,
I have been astonished by your feedback and the resonance my first #ShortTermSaturday post has brought me in. I think, I really hit the nail in the coffin by providing and including short term outlooks for $BTC to you - in the end, as always it's supply and demand. You demand it, I provide it and the supply is super-rare info and data you will only get on my X or on my dear friend's X account @xapa03. So make sure to follow him too! 🤝
🤿Let's dive into today's #ShortTermSaturday, shall we?
1) Meso-perspective wise, we are still in our rising wedge structure on the daily time frame. A rising wedge per definition is an overall bearish setup with a high tendency of breaking to the downside rather than breaking to the upside. By breaking down, I clearly do not mean a blood bath, it's just simply a cool down the market needs every now and then in order to reset its momentum oscillators and to find a higher low foundation to build the next big long move on. So for the daily timeframe speaking, neither RSI nor Paralia have plenty of room left to go upwards or to run even hotter. RSI will end up in a double bearish divergence with two higher highs in price and two lower lows in RSI which will clearly break down. Paralia is close to being red, and you know what that means. ⚠️
2) Our "make-it-or-break-it" range will be October 8th to October 11th timewise. In this span, it's decision time. If I had to make a hard guess, I do see a break to the downside and with that, an RSI breakdown, a Paralia rise-up to the green and a $BTC price rangebounding in the cluster of $74.5k to $79k. If Bitcoin was to end up in this range, RSI would be cooled down, Paralia would again be green on the 12h to daily timeframe (long swing entry signal), and $74.5-$79k would be a solid consecutive higher low structure that would define and solidify our uptrend form our bear market bottom low at $57k end of June (@xapa03 and I called it to the tee btw). 🚨
3) To crown the first two pictures in my analysis, I overlaid a Fibonacci price grid starting from our bear market bottom at $57k in June 2026 and going until Bitcoin's last range high at roughly $87k ish this week. We can see that .618 and .786 would be the two perfect sweet spots where Bitcoin could be rangebounding and "breaking down" into, finding higher low support with the macro trendline (blue) coming all the way form the June cycle bottom. 👑
🧮If we extrapolate all numbers, we would end up with the following prices:
- $BTC has seen its final high for this range at roughly $87k-$88k
- There's a modest but not big chance of maybe finding ONE HIGHER HIGH ($89k-$90.5k) which I would not bet on and I would not trade on from these prices
- Eventually, $BTC will break down of the rising wedge and at least revisiting the $79k-$80k cluster with a high likelyhood and a textbook sweet spot turning point at roughly the $74k-$75k cluster
- breakdown date would be mid-October and IF IT WAS TO BREAK DOWN, we would see $BTC sub $80k in late October to early November
Stay tuned for fresh weekly data on #MomentumMonday and next week's short term outlook. 🔔
Thanks for tuning in and enjoy the weekend!☀️
Sincerely🤜🤛
Sheriff
#ShortTermSaturday Episode 2 (10/03/26)📈
✒️My dear followers,
I have been astonished by your feedback and the resonance my first #ShortTermSaturday post has brought me in. I think, I really hit the nail in the coffin by providing and including short term outlooks for $BTC to you - in the end, as always it's supply and demand. You demand it, I provide it and the supply is super-rare info and data you will only get on my X or on my dear friend's X account @xapa03. So make sure to follow him too! 🤝
🤿Let's dive into today's #ShortTermSaturday, shall we?
1) Meso-perspective wise, we are still in our rising wedge structure on the daily time frame. A rising wedge per definition is an overall bearish setup with a high tendency of breaking to the downside rather than breaking to the upside. By breaking down, I clearly do not mean a blood bath, it's just simply a cool down the market needs every now and then in order to reset its momentum oscillators and to find a higher low foundation to build the next big long move on. So for the daily timeframe speaking, neither RSI nor Paralia have plenty of room left to go upwards or to run even hotter. RSI will end up in a double bearish divergence with two higher highs in price and two lower lows in RSI which will clearly break down. Paralia is close to being red, and you know what that means. ⚠️
2) Our "make-it-or-break-it" range will be October 8th to October 11th timewise. In this span, it's decision time. If I had to make a hard guess, I do see a break to the downside and with that, an RSI breakdown, a Paralia rise-up to the green and a $BTC price rangebounding in the cluster of $74.5k to $79k. If Bitcoin was to end up in this range, RSI would be cooled down, Paralia would again be green on the 12h to daily timeframe (long swing entry signal), and $74.5-$79k would be a solid consecutive higher low structure that would define and solidify our uptrend form our bear market bottom low at $57k end of June (@xapa03 and I called it to the tee btw). 🚨
3) To crown the first two pictures in my analysis, I overlaid a Fibonacci price grid starting from our bear market bottom at $57k in June 2026 and going until Bitcoin's last range high at roughly $87k ish this week. We can see that .618 and .786 would be the two perfect sweet spots where Bitcoin could be rangebounding and "breaking down" into, finding higher low support with the macro trendline (blue) coming all the way form the June cycle bottom. 👑
🧮If we extrapolate all numbers, we would end up with the following prices:
- $BTC has seen its final high for this range at roughly $87k-$88k
- There's a modest but not big chance of maybe finding ONE HIGHER HIGH ($89k-$90.5k) which I would not bet on and I would not trade on from these prices
- Eventually, $BTC will break down of the rising wedge and at least revisiting the $79k-$80k cluster with a high likelyhood and a textbook sweet spot turning point at roughly the $74k-$75k cluster
- breakdown date would be mid-October and IF IT WAS TO BREAK DOWN, we would see $BTC sub $80k in late October to early November
Stay tuned for fresh weekly data on #MomentumMonday and next week's short term outlook. 🔔
Thanks for tuning in and enjoy the weekend!☀️
Sincerely🤜🤛
Sheriff
✒️To my dear loyal fellas,
Sheriff's been listening to and answering to all of your comments, requests, and questions. Every time we interact with each other, my inner Bitcoin soul comes alive. And as Sheriff's been listening to his dear friends at the Bitcoin Frontier, many of you were requesting a lower time frame outlook by me.👂
I do have to admit that I am a higher time frame guy, I always have huge respect for the OGs mastering the LTF such as my good friend @xapa03. 🫶
But I want to answer your wishes of an LTF-setup analyzed by Sheriff and I want to meet you halfway with that.🤝
So I herewith proudly announce that from today going forward, you will now be presented a lower time frame setup each weekend. I will not draw a gazillion different trendlines or will change those lines that are already drawn in. I will simply give you updates on my thoughts that I have prepared just for you, my friends. 💡
⚠️Please be kind with me, please do never take these outlooks as financial advice, as I have been telling you for years, my content is for educational purpose only.🚨
🤿So without further a do, let's dive into my thoughts on Bitcoin in a lower time frame - Here is my first #ShortTermSaturday outlook:
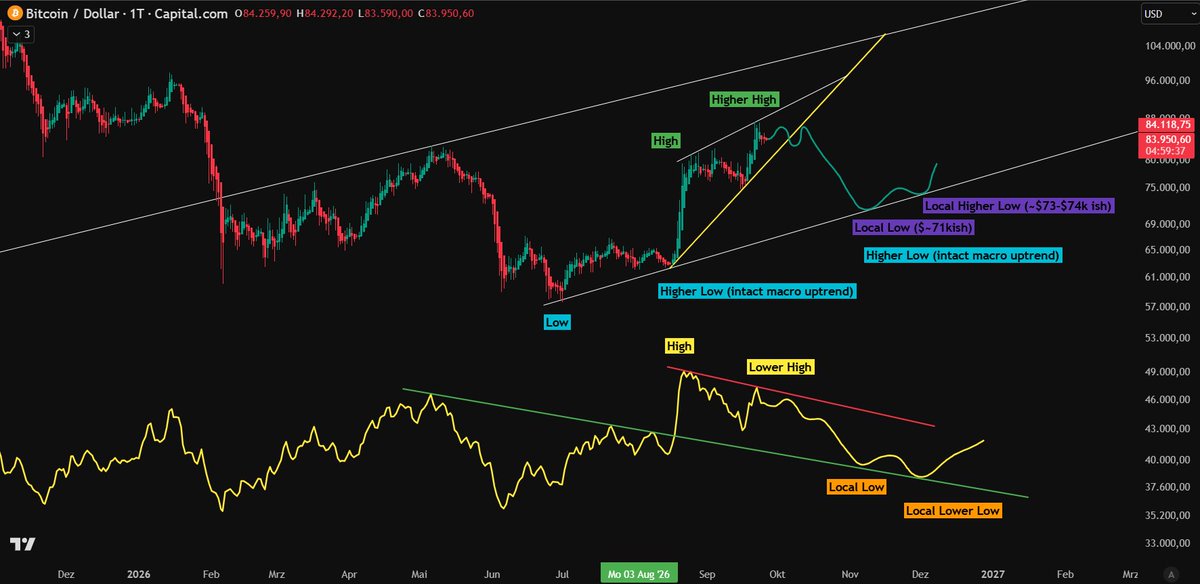
1) Bitcoin has found its cycle bottom at roughly $57k in June 2026. I have called this bottom perfectly. Make sure to check out my threads attached with my profile. From this cluster one, we have established a healthy uptrend with a higher high at $62.5k. This price cluster has functioned as a launchpad to an explosive move into our first high at $80k, followed by some rangebounding and a small correction on the yellow line which eventually pushed Bitcoin even higher into the $87k cluster to establish a higher high. This pattern has been built up in a bearish rising wedge which often tends to break to the downside (70/30).⚖️
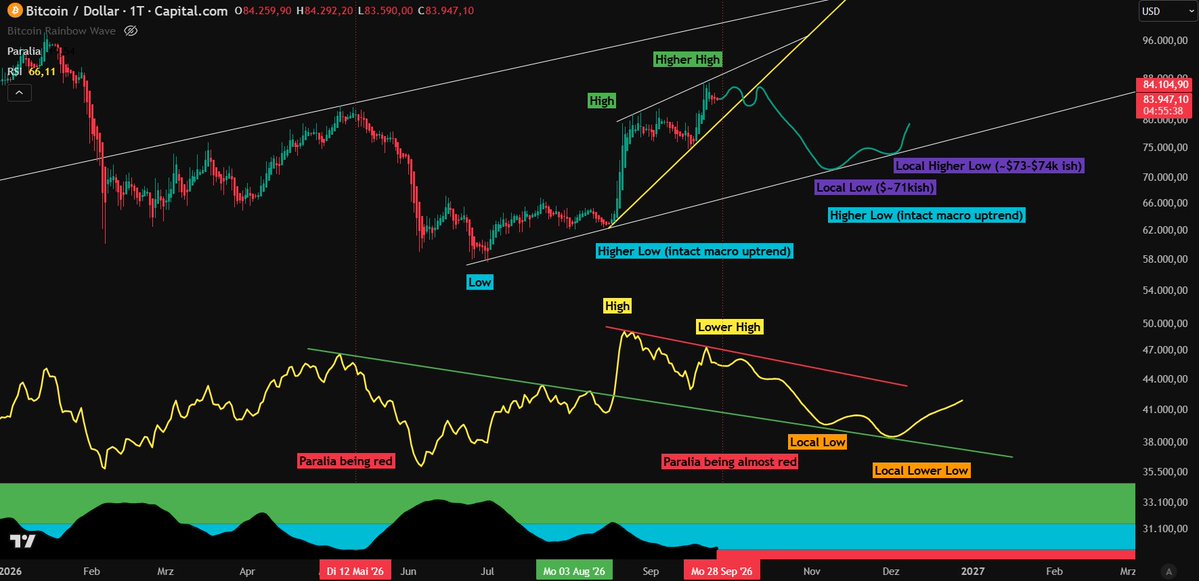
2) Parallel to this movement in price, my RSI setup (length 21, daily) has been establishing a super strong high at (RSI value 81, BTC price $80k), followed by a lower high in RSI (RSI value 73, BTC price $87k). This is textbook bearish divergence in an RSI setup. This bearish divergence is amplified by Bitcoin's current price action in its bearish rising wedge pattern. To crown this whole setup, my custom indicator "Paralia" has nearly hit its red level. In the second picture you can observe what usually happens when Paralia goes red in the daily timeframe. Take from that what you need. 📝
👁️Sheriff's current price outlook:
- there's a ~10% chance that we will boldly and strongly go above $87k, the air has been pushed out
- most likely, we will hit $85k to $87k again, forming a hidden double bearish divergence while RSI won't hit its upper trendline again
- RSI will plummet in value, most likely finding support at RSI value 38-40
- $BTC will lose the rising wedge lower trendline (yellow) beginning to mid October ($82k-$84k cluster) and will free fall into the lower to mid $70k as a super healthy correction (I'm already curious what reasons the herd needs for this correction)
- textbook targets for $BTC to find support on would be $71k to $74k in early to mid-November
- from this point on in a textbook scenario, RSI might go lower while $BTC will establish a local higher low which would result in a daily bullish divergence (purple boxes/orange boxes) and which would eventually act as Bitcoin's launchpad to $100k and beyond
From now on, I will come back to this setup every weekend. If it plays out, I will be happy. If it fails, I don't care at all. In the end, Bitcoin's a long term game. 🎲
Enjoy the weekend and all the best to you!
Sheriff 🤠
Last Seen Hashtags on Sotwe
anxiouspanda(***)***+filter:native_video
financialexclusions
Seen from United States
ensest
Seen from Turkey
forsakenr34
Seen from Indonesia
高要二中
Seen from Germany
runnutrition
Seen from United States
andeverythingelsetoo
Seen from United States
momandson
Seen from Denmark
minichat()
Seen from Netherlands
theconvoyshow
Seen from United States
Trends for you
Most Popular Users

Elon Musk 
@elonmusk
241.5M followers

Barack Obama
@barackobama
118.9M followers

Cristiano Ronaldo
@cristiano
114.6M followers

Donald J. Trump
@realdonaldtrump
111.8M followers

Narendra Modi
@narendramodi
107.1M followers

Rihanna
@rihanna
98.7M followers

NASA
@nasa
92.3M followers

Justin Bieber
@justinbieber
91.8M followers

KATY PERRY
@katyperry
90M followers

Taylor Swift
@taylorswift13
84M followers

Lady Gaga
@ladygaga
75.5M followers

Virat Kohli
@imvkohli
73.5M followers

Kim Kardashian
@kimkardashian
70.9M followers

YouTube
@youtube
68.8M followers

Neymar Jr
@neymarjr
66.5M followers

Bill Gates
@billgates
65.2M followers

Selena Gomez
@selenagomez
63.1M followers

The Ellen Show
@theellenshow
62.2M followers

CNN
@cnn
61.8M followers

X
@x
60.7M followers