Top Tweets for #dataVisualisation

I build predictive models, dashboards, and AI-powered systems that turn complex datasets into clear insights, smarter decisions, and measurable business results for client projects.
#datavisualisation
#dataanalysis
#Articificialintereligence
#SPSS
#IBM


Tableau forces a discipline Excel does not. You cannot put everything on a dashboard. The tool demands you choose what matters most.
That constraint makes you a better analyst.
Use Excel to think. Use Tableau to be understood.
#Tableau #DataVisualisation #DataAnalytics #KSTEPS

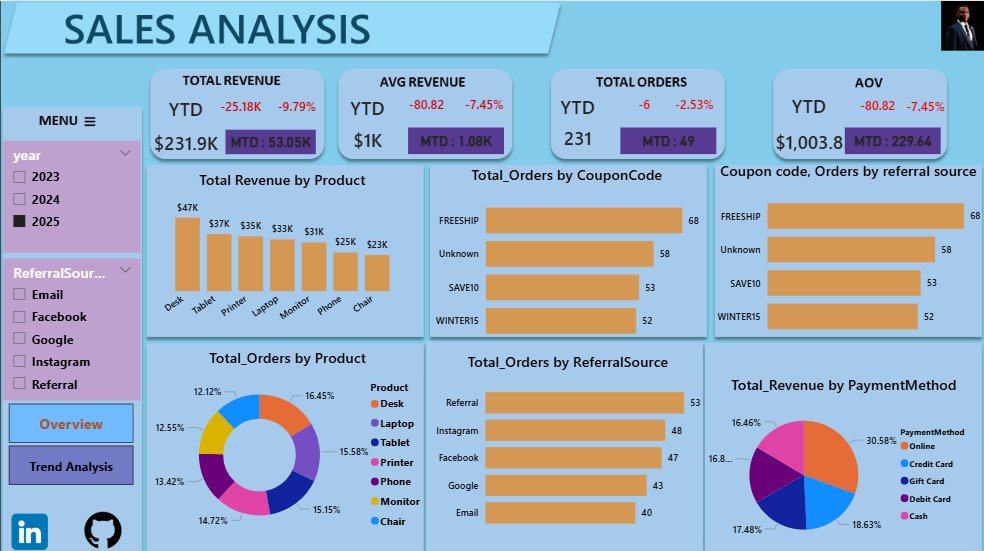
Instead, it highlights a shift in consumer behavior. By 2025, customers were pivoting entirely away from premium, high-ticket items to purchase less expensive, value-tier products.
This is the power of time intelligence!
#dataanalytics #datavisualisation
#buildinginpublic #HR


New Project Alert 🚀
Built an HR Analytics Dashboard to uncover workforce insights and employee trends, starting with the cover page,more visuals and insights dropping soon. 👀
#DataAnalytics #DataAnalyst #DataVisualisation


Most organisations don't lack data. They lack clarity.
A good visualisation helps audiences understand patterns, insights and trends in seconds.
Because information only creates impact when people understand it.
https://t.co/wZLcKN9MWo
#DataVisualisation #VisualCommunication

A 20-page report became a clear, professional 1-page dashboard 👀
Simplifying information makes it easier to understand, quicker to absorb, and far less overwhelming.
Good document design is about clarity, not clutter.
#DocumentDesign #DataVisualisation #ProfessionalDocuments


Indian ₹ Depreciation Against the US $
#IndianRupee #INR #USD #Dollar #CurrencyDepreciation #Forex #Economy #IndiaEconomy #ExternalDebt #TradeDeficit #EconomicTrends #Infographics #DataVisualisation


Day73 #100DaysofCode✅
Today learned visualzing programing language popularity trends with Matplotlib Learned how to clean & reshape data with Pandas create pivot table customizing line chart
@LondonAppBrewer #learnpython #DataVisualisation
ProjectDetail
https://t.co/kwjRV57tBw
⛽️Global fuel prices 2020-2026
Price shifts,regional gaps, and affordability tell the real story.
Tool used: Microsoft Excel 📊
@ezekiel_aleke #aprilchallengewithezekeil #DataVisualisation #DataAnalytics #Exceldashboard


Come learn the @infobeautiful ‘concept-driven’ approach to #datavisualisation & #infographics for max impact.
2 x virtual half days:
29th & 30th Apr 🇺🇸 USA timezone
Mon 27th Apr 🇬🇧 LDN in-person (SOLD OUT)
Deets: https://t.co/Vs0bqmoF9N
Reviews: #iibwab

Want to be Data Analyst in 2026
Crack these essential skills
#Sql #Analyst #Excel #Python #DataVisualisation #DataDriven

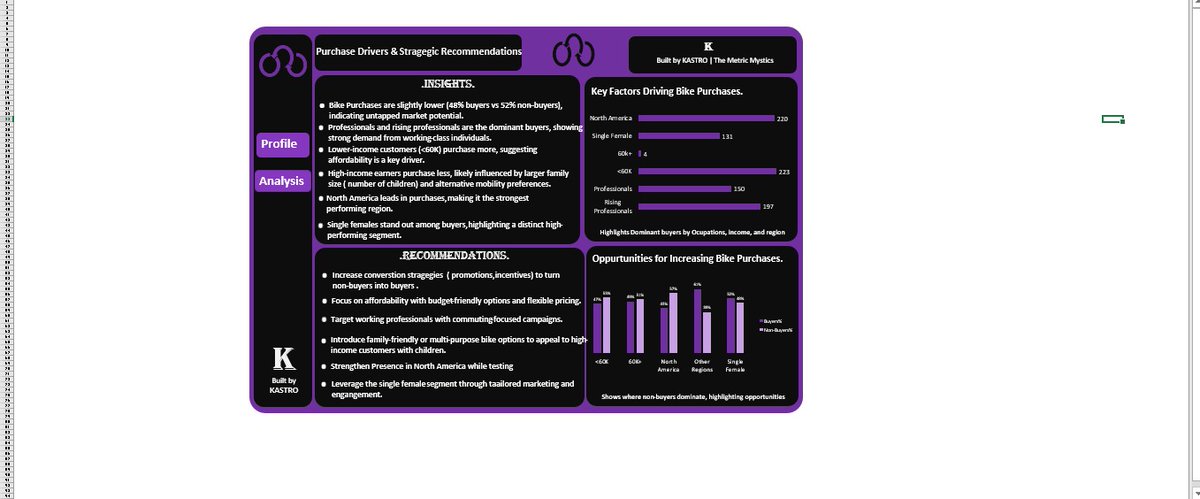
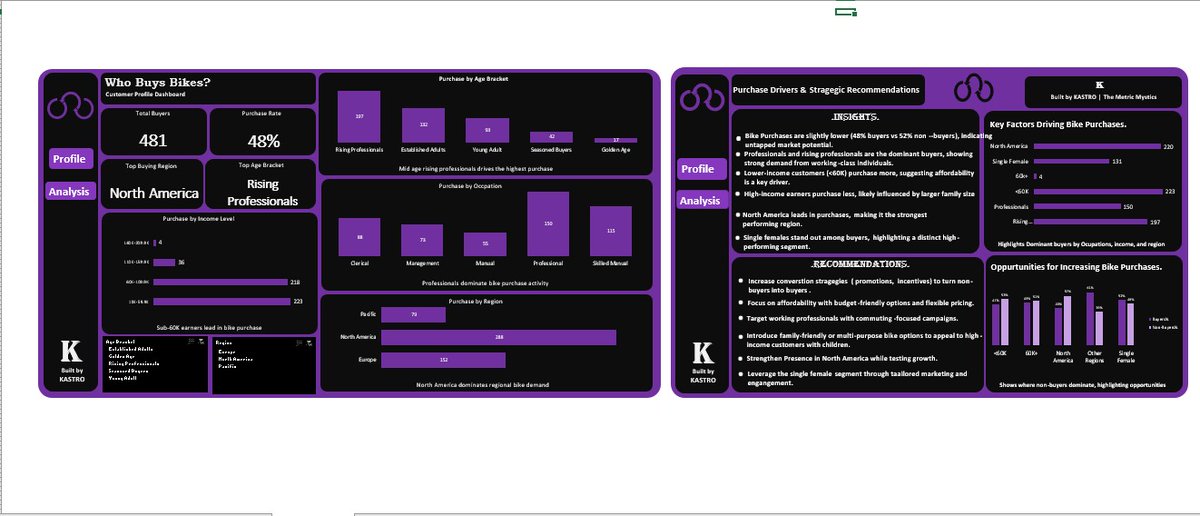
Buyers identified🤞. Drivers uncovered.✨️
Full bike purchase insights in one dashboard👌.
#DataVisualisation #DataAnalytics #Dashboard


Data visualisation CheatSheet
#DataVisualisation


Cooking something delicious 👩🍳🥣
Stay tuned 😉😎
#datafam #powerbi #dataanalytics #datanerd #webscrapping #DataDriven #datavisualisation #DAX


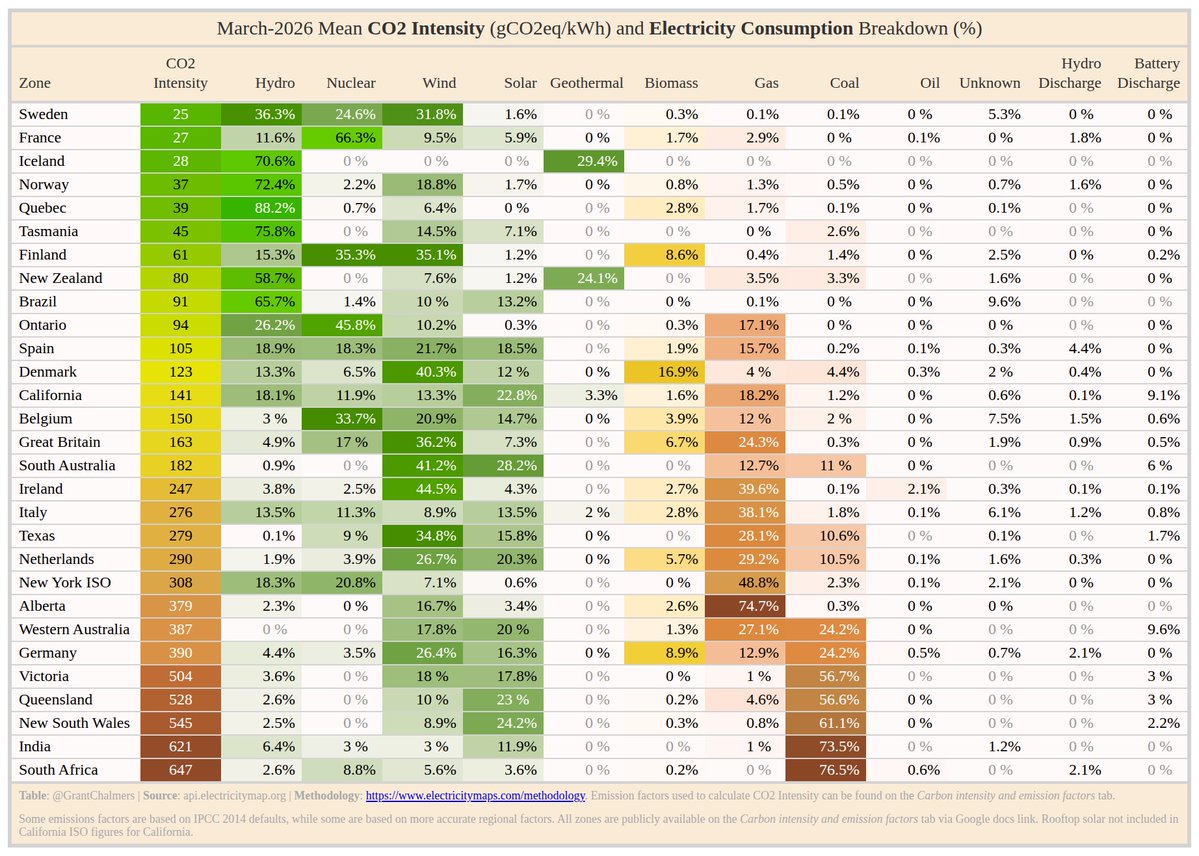
March 2026 mean CO2 intensity (gCO2eq/kWh) and power consumption breakdown (%).
#energytransition #electricity #datavisualisation
Methodology: https://t.co/WGuMYxPZwb h/t @ElectricityMaps
Come learn the @infobeautiful ‘concept-driven’ approach to #datavisualisation & #infographics for max impact.
2 x virtual half days:
25th & 26th Mar 🇬🇧 UK/EU/AUS
29th & 30th Apr 🇺🇸 USA timezone
Mon 27th Apr 🇬🇧 LDN in-person
Deets: https://t.co/Vs0bqmoF9N
Reviews: #iibwab


New Blog: From Data to Diagrams: Visual Approaches to Evaluating Marine Plan Systems.
Written by Rachel Holtby and Victor Owoyomi - CECAN Fellows
Read the full post here: https://t.co/R8lAG26seZ
#MarinePlanning #SystemsThinking #Evaluation #DataVisualisation
Come learn the @infobeautiful ‘concept-driven’ approach to #datavisualisation & #infographics for max impact.
2 x virtual half days:
25th & 26th Mar 🇬🇧 UK/EU/AUS
29th & 30th Apr 🇺🇸 USA timezone
Mon 27th Apr 🇬🇧 LDN in-person
Deets: https://t.co/Vs0bqmoF9N
Reviews: #iibwab

I also paid closer attention to accessibility and UX, something I’ll definitely carry into future projects.
Grateful for the learning and community over the past few weeks ❤️
Link to entry: https://t.co/27H3jijnqc
#PowerBI #DataVisualisation #Olympics #WomenInData
Trends for you
Most Popular Users

Elon Musk 
@elonmusk
240.3M followers

Barack Obama
@barackobama
119.3M followers

Donald J. Trump
@realdonaldtrump
111.6M followers

Cristiano Ronaldo
@cristiano
109.5M followers

Narendra Modi
@narendramodi
107M followers

Rihanna
@rihanna
97.4M followers

NASA
@nasa
92.1M followers

Justin Bieber
@justinbieber
90.7M followers

KATY PERRY
@katyperry
87.1M followers

Taylor Swift
@taylorswift13
81M followers

Lady Gaga
@ladygaga
72.5M followers

Kim Kardashian
@kimkardashian
69.5M followers

Virat Kohli
@imvkohli
69.1M followers

YouTube
@youtube
68.6M followers

Bill Gates
@billgates
63.6M followers

The Ellen Show
@theellenshow
62.5M followers

CNN
@cnn
61.9M followers

Neymar Jr
@neymarjr
61.7M followers

X
@x
60.9M followers

Selena Gomez
@selenagomez
60.2M followers