

Top Tweets for #DataVisualisation

A solid foundation for data analytics and future AI applications.
📷 Get your copy here: https://t.co/jLtRDwGTbY
#DataScience #KNIME #DataAnalytics #DataVisualisation #opensource #personalfinance #weatheranalysis #sportsprediction #financialdata


“Can I export this to Excel?” may be a dashboard’s most revealing UX signal. Natalia Przybyłkiewicz and Marcin discuss designing with users, prototyping first, and measuring what people actually do.
Listen: https://t.co/YaHd8jCw0s
#PowerBI #DataVisualisation

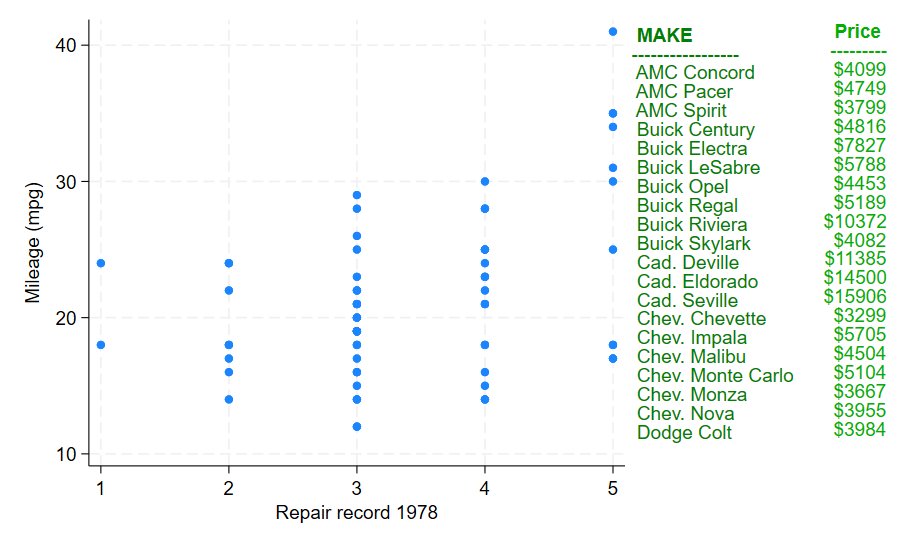
Use local macros and forvalues{} loops in @Stata to build side text for a scatter plot, adding make and price details beside the graph. https://t.co/dubr2H6nAf #Stata #DataVisualisation

GeoCarta
@geocarta
·
7h
Revivez le #17octobre : la journée où la France a marché contre la vie chère👉 Explorez la carte, les tendances et les images : https://t.co/ABEfC1vrf7 #17octobre #DataVisualisation #Cartographie #OpenData


Revivez le #17octobre : la journée où la France a marché contre la vie chère👉 Explorez la carte, les tendances et les images : https://t.co/ABEfC1vZ4F
#17octobre #DataVisualisation #Cartographie #OpenData

Data is only as powerful as the story it tells.
One key lesson I’ve learnt about data visualisation is that having the data is not enough. The way we present it determines whether people engage with, understand, and remember it.
#DataVisualisation #DataJournalism #Storytelling


📊 Curious about what’s new in Power BI this October 2026?
Explore the latest updates across Copilot and AI, reporting, and semantic models.
https://t.co/84CoMFuQ5R
#PowerBI #MicrosoftFabric #Copilot #BusinessIntelligence #DataAnalytics #Microsoft #DataVisualisation

Come learn the @infobeautiful ‘concept-driven’ approach to #datavisualisation & #infographics for max impact.
2 x virtual half days:
4th & 5th Nov 🇺🇸 USA timezone
9th Nov 🇬🇧 LDN in person
Deets: https://t.co/Vs0bqmoF9N
Reviews: #iibwab

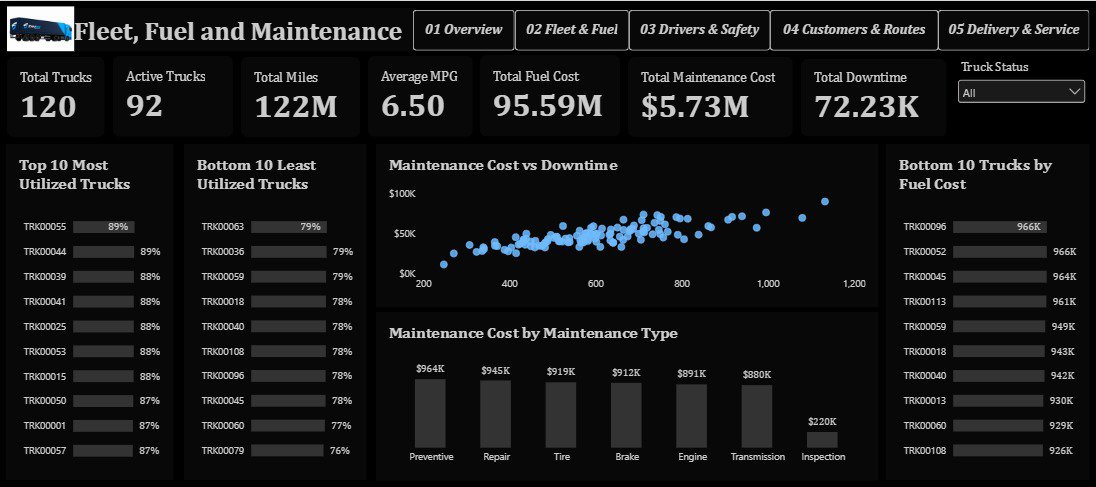
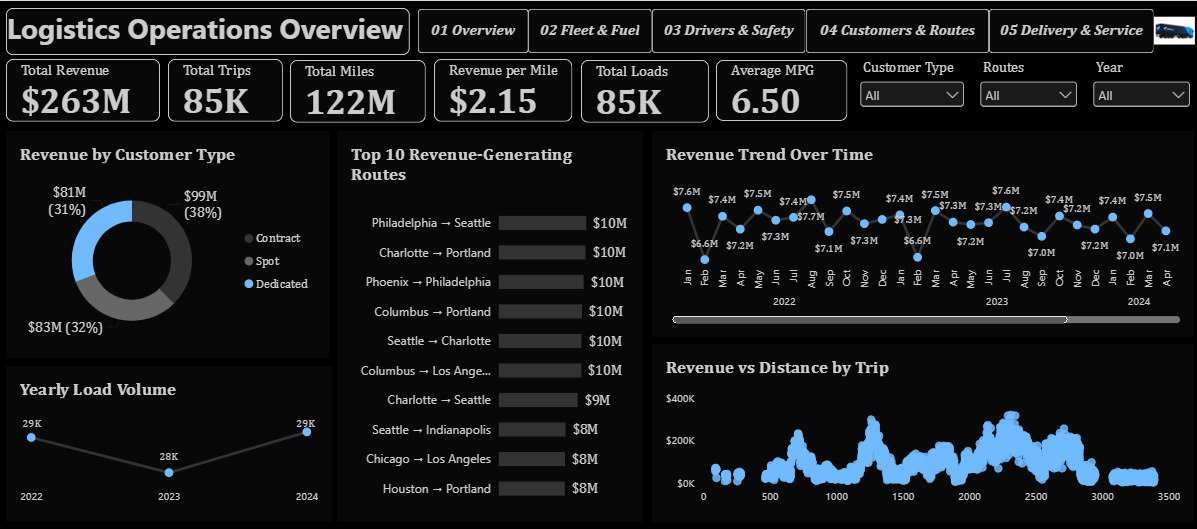
🎓 A milestone: My logistics capstone is ready for submission! 📊🚀
5 dashboard pages, but combined 4 in one picture as required by the capstone instructions.
Grateful to Mr. @ezekiel_aleke & @TechSphereAcad . 🙏🏾
#PowerBI #DataAnalytics #DataVisualisation



Done done done
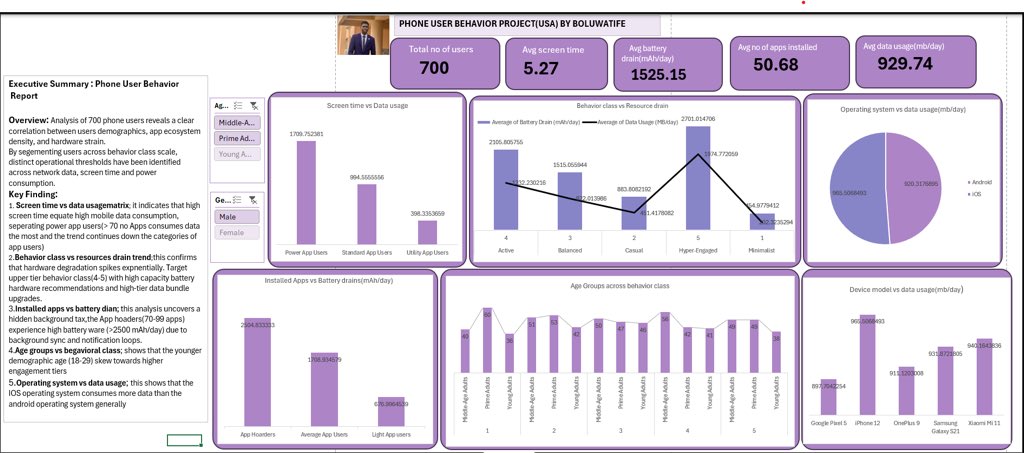
Just wrapped up this Phone User Behavior Analysis (USA) dashboard! 📱📊
#DataAnalytics
#DataScience
#DataVisualisation
#DataFam
Building a project from scratch is always a vibe.
Hands on this new project on user behavior and I’m cleaning my data,categorizing and doing necessary conditioning of column for my analysis .
Still cooking the analysis 👨🍳
#DataAnalytics #DataScience #DataFam


🌳 What does the data tell us about #Agroforestry in Europe?
📊 It’s time to explore the #ReForestResults.
Our Data Visualisation page turns ReForest findings into accessible visual insights.
👉 https://t.co/cl7C6C8QJ8
#ReForest #DataVisualisation #HorizonEurope


Excel on the left, Power BI on the right.
Same numbers, totally different energy. Which one are you picking? 🤔
#DataVisualisation #DataAnalytics #Excel #PowerBI #Data #ExcelVsPowerBI


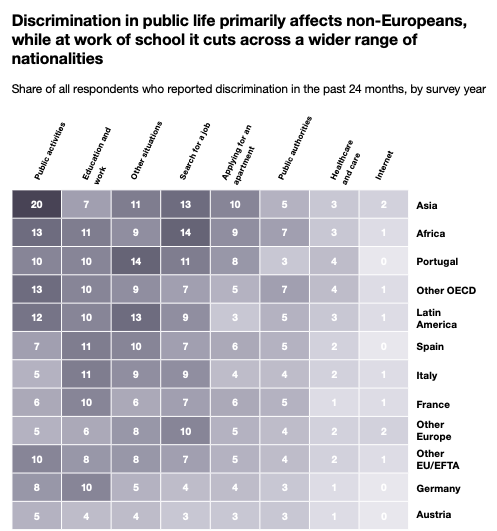
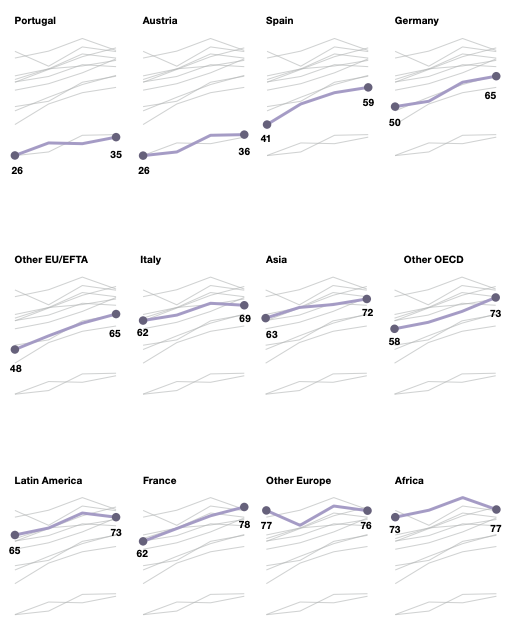
Proud to have built the #dataviz for the e-book "Insights from #Switzerland: The Migration-Mobility Survey" by NCCR - on the move 📊🇨🇭
💻 All the R #ggplot2 code used: https://t.co/a5YtbNVA1a
📖 E-book: https://t.co/MH7JBNoIS9
#rstats #datavisualisation
Come learn the @infobeautiful ‘concept-driven’ approach to #datavisualisation & #infographics for max impact.
2 x virtual half days:
4th & 5th Nov 🇺🇸 USA timezone
9th Nov 🇬🇧 LDN in person
Deets: https://t.co/Vs0bqmoF9N
Reviews: #iibwab
A density heat map in @Stata can show where observations cluster. This workflow uses `spgrid`, `spkde`, `grmap`, and `mylabels` with auto data. https://t.co/AXqHZsQCXX #Stata #DataVisualisation


We love playing with visionOS widgets and here's an example of Shane Brown and I exploring how simple status information can shortcut to richer 3D data visualisation. #visionos #widgets #spatialcomputing #applevisionpro #datavisualisation #3D


🌟 Data visualisation helps businesses understand complex data.
Zizo Insight turns data into dashboards that support better decisions at every level.
Clear insights drive smarter actions. https://t.co/GRVkTOa7QU
#DataVisualisation #BI #Analytics #Zizo


What are some really good examples of data visualization that uses physics simulation? #dataviz #datavisualization #datavis #datavisualisation

Day79 #100DaysofCode✅
Today I analysed Nobel Prize data with Pandas, Plotly & Seaborn Learned interactive donut chart, Choropleth maps, Sunburst chart, rolling average & regression analysis
@LondonAppBrewer #learnpython #DataVisualisation
Project Detail:
https://t.co/bjIh2OJMtq

New Project Alert 🚀
Built an HR Analytics Dashboard to uncover workforce insights and employee trends, starting with the cover page,more visuals and insights dropping soon. 👀
#DataAnalytics #DataAnalyst #DataVisualisation

Last Seen Hashtags on Sotwe
Most Popular Users

Elon Musk 
@elonmusk
241.5M followers

Barack Obama
@barackobama
118.8M followers

Cristiano Ronaldo
@cristiano
114.5M followers

Donald J. Trump
@realdonaldtrump
111.8M followers

Narendra Modi
@narendramodi
107.1M followers

Rihanna
@rihanna
98.7M followers

NASA
@nasa
92.3M followers

Justin Bieber
@justinbieber
91.8M followers

KATY PERRY
@katyperry
90M followers

Taylor Swift
@taylorswift13
84M followers

Lady Gaga
@ladygaga
75.5M followers

Virat Kohli
@imvkohli
73.5M followers

Kim Kardashian
@kimkardashian
70.9M followers

YouTube
@youtube
68.8M followers

Neymar Jr
@neymarjr
66.5M followers

Bill Gates
@billgates
65.3M followers

Selena Gomez
@selenagomez
63.1M followers

The Ellen Show
@theellenshow
62.2M followers

CNN
@cnn
61.7M followers

X
@x
60.7M followers