Top Tweets for #graphvisualizations

#GraphVisualizations uncover hidden patterns and relationships, making #data exploration intuitive and insightful. By integrating @Neo4j with Jupyter, you transform complex data into clear, actionable insights. #DataScience #DataAnalysis #GraphDataScience
https://t.co/L0Ucftqnaf


Tomorrow’s the day! #Nodes2024 by @neo4j is almost here! Join Dr. Benjamin Niedermann on November 7, 1:00 PM - 1:30 PM UTC for an insightful talk on “Advanced #GraphVisualizations in #Jupyter Notebooks.
Register here: https://t.co/BLEvVoKvjd
#Neo4j
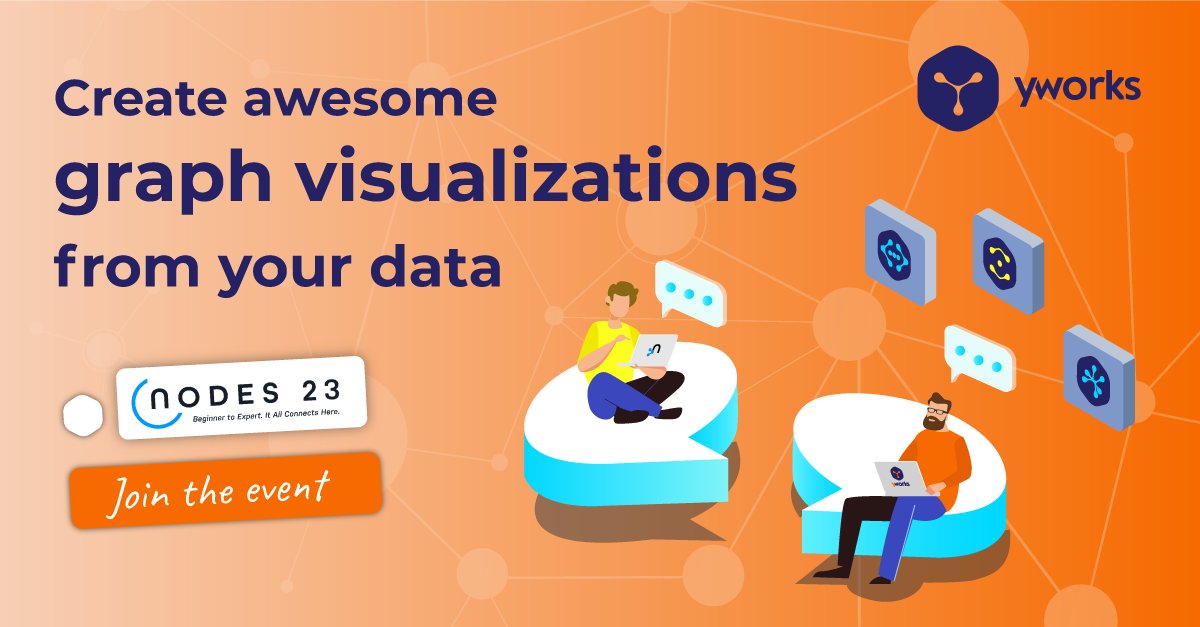
yFiles #React Components bring powerful #GraphVisualizations to your React applications. Discover more here: https://t.co/IYob2voVmy
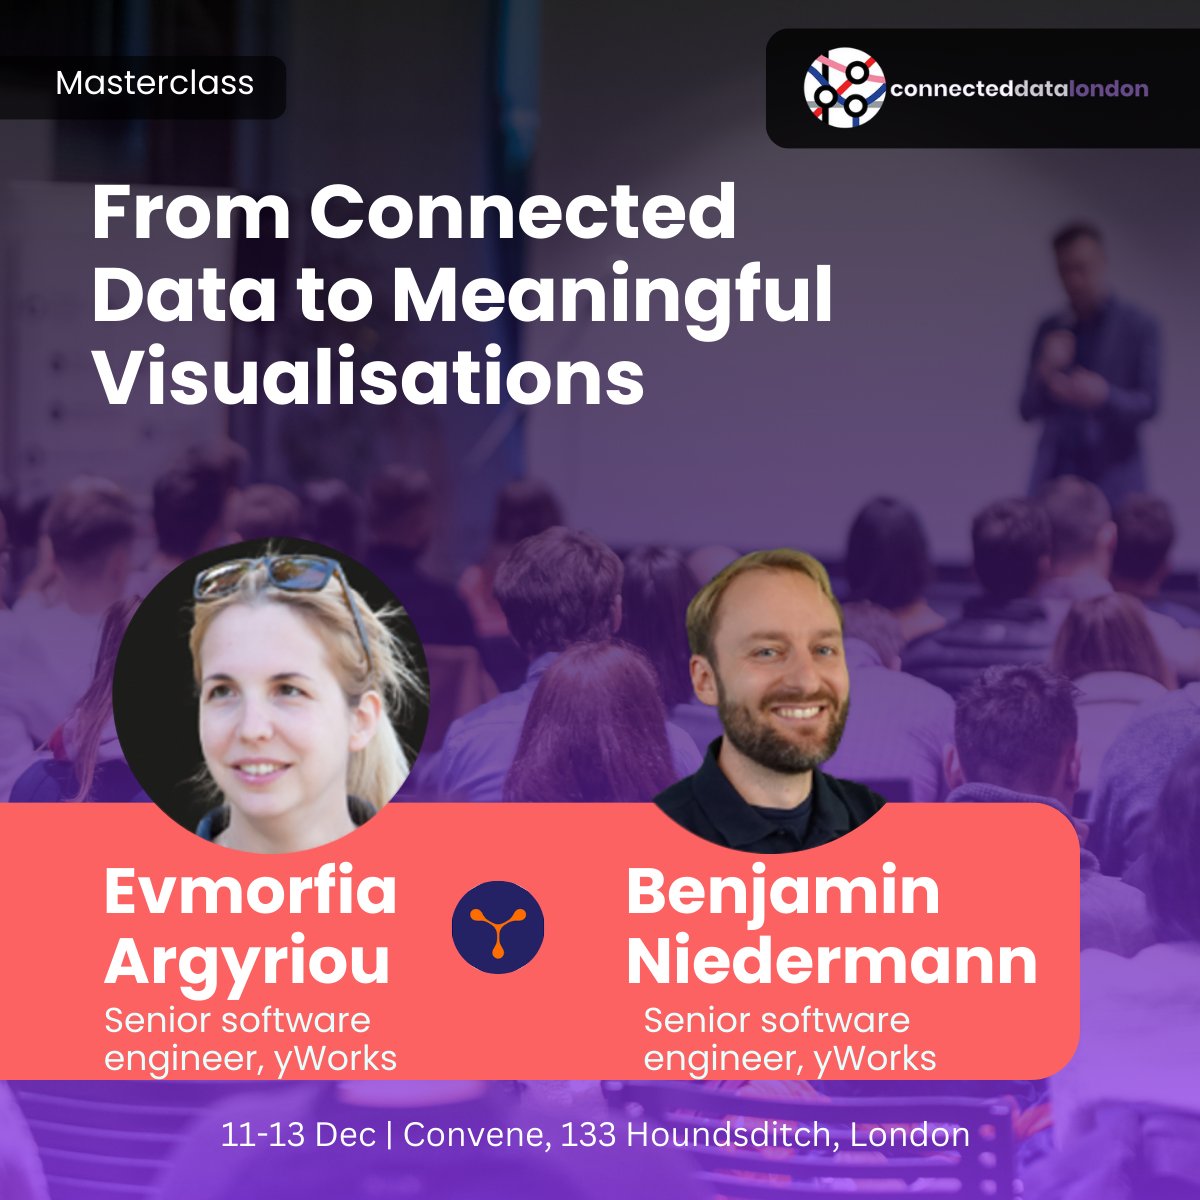
This December at @Connected_Data, Dr. Benjamin Niedermann will host a masterclass: "From Connected Data to Meaningful Visualizations." Learn to transform raw #data into insights using advanced #GraphVisualizations with #JupyterNotebook and @neo4j. Perfect for developers!
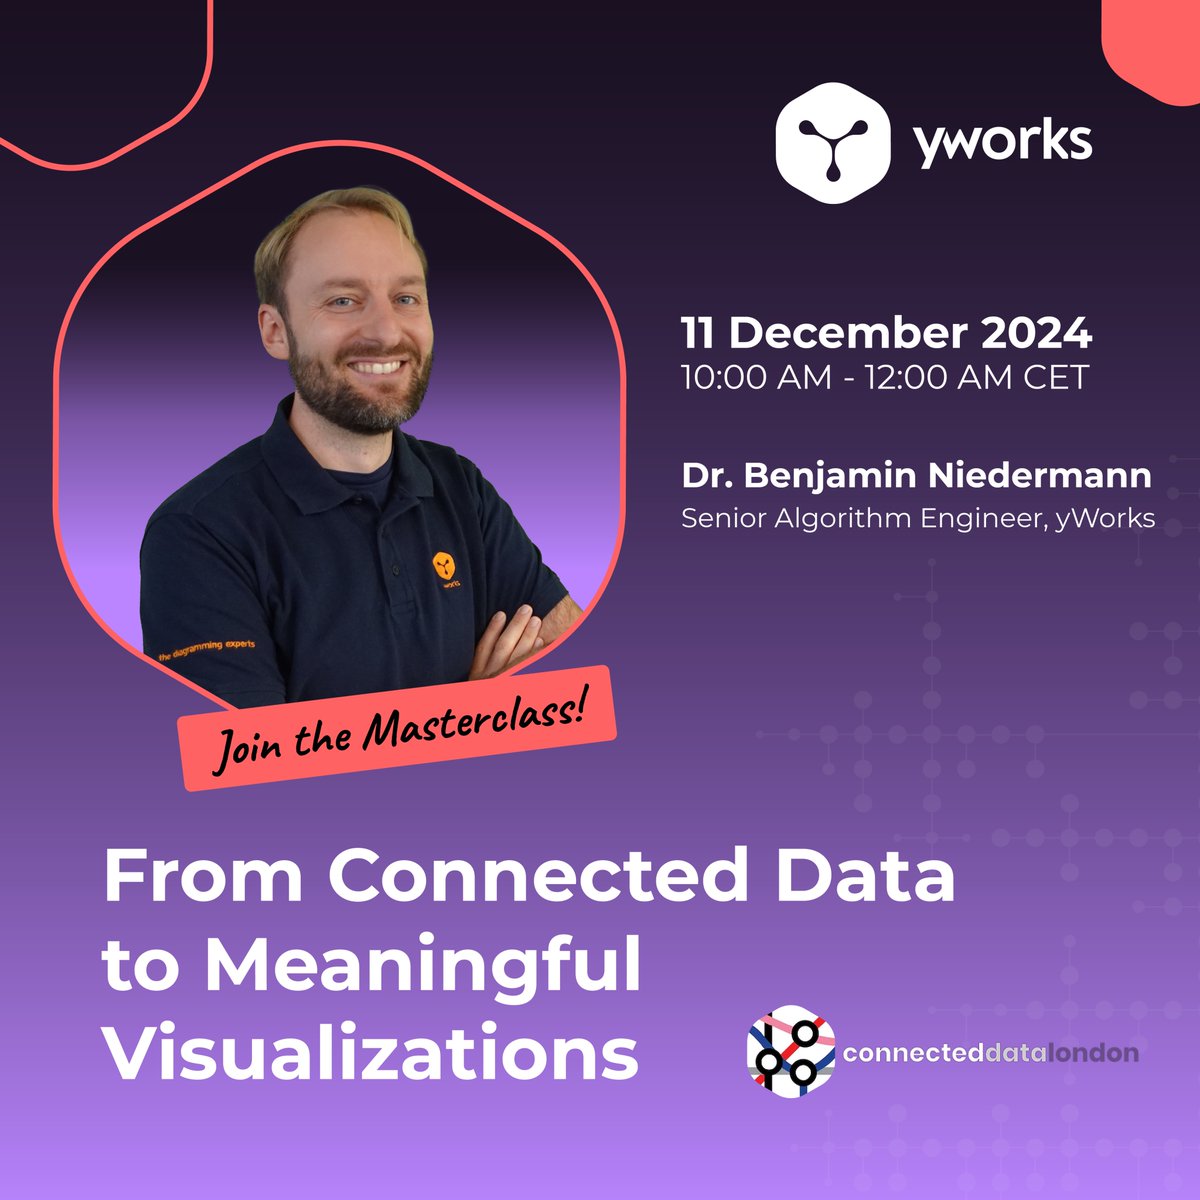
We look forward to sharing insights on meaningful #GraphVisualizations at #ConnectedDataLondon. See you there!

From Connected Data to Meaningful Visualisations
Graph visualisations make complex data more accessible, but creating a meaningful graph visualisation is far from trivial. In this masterclass, we present a pipeline for transforming raw data into a visualisation that answers specific user questions.
This class is designed for anyone working in data analysis, including data scientists, application developers, and researchers. We use free tools accessible to everyone.
By the end of the masterclass, participants will have gained hands-on experience in transforming raw data into meaningful graph visualisations.
Techniques of data analysis allow users to extract valuable insights from raw data. By exploring this data, they can answer specific questions, identify patterns, and make informed decisions. Graph visualisations enhance this process by making complex data more accessible.
In this masterclass, you will discover how to transform raw data into meaningful graph visualisations, covering the entire pipeline from data to the final visualisation. First, we provide an overview of how to identify key questions that can be answered with graph visualisations.
Then, using Jupyter Notebook—a popular and free tool for data analysts—and Neo4j databases, you will learn how to prepare data and apply graph analysis algorithms such as centrality and other relevant measures.
Finally, you will explore how to select the appropriate visualisation style, focusing on what should be emphasised and how information can be effectively encoded in the visualisation.
https://t.co/DmeVlryedl
#DataViz #CDL24 #DataScience #GraphDB #Notebook #OpenSource #Masterclass #Tutorial #ConnectedData #visualization
Dr. Benjamin Niedermann will speak at #NodesTalk 2024, hosted by Neo4j, on November 7, from 1:00 to 1:30 PM (UTC). Join him for "Advanced #GraphVisualizations in #JupyterNotebooks" and learn how to create engaging #DataVisualizations!
#NODES2024 #Neo4j #DataVisualization
Dr. Benjamin Niedermann, one of our experts in layout algorithms, speaks at #NodesTalk2024 by @neo4j on Nov 7, 1:00-1:30 PM! Join his session on 'Advanced #GraphVisualizations in #Jupyter Notebooks' for real-world #data insights.

Unlock the power of #JavaScript graph visualization libraries! These tools enable developers to seamlessly build interactive applications with insightful #graphvisualizations for different use cases.
👉Access our white paper now: https://t.co/0KLvPd05vO
#Technology
Discover Ogma, the all in one #JavaScript library for large-scale interactive #graphvisualizations. It comes equipped with everything you need to easily visualize and analyze your graph data. 👩💻 Kickstart it now directly within the Ogma Playground: https://t.co/pU4kUPC8Vm
Do you want your users to uncover connections within complex data? Add graph capabilities to your projects with Ogma, the all-in-one #JavaScript library for large-scale interactive #graphvisualizations.💡
Learn more: https://t.co/9OdVr7xduz

Easily improve your #NetworkGraphs with #EntityResolution. Learn how to get better #GraphAnalytics and #GraphVisualizations. https://t.co/CmCKQmjxzl #GraphDatabase #KnowledgeGraphs#RelationshipGraphs #DataVisualization #DataAnalysis
🧐 Do you want your users to uncover connections within complex data? Add graph capabilities to your projects with Ogma, the all-in-one #JavaScript library for large-scale interactive #graphvisualizations. Start now with a free trial: https://t.co/Rw40tOrKR1
Need better #DecisionIntelligence? Learn how our partners @Linkurious and Aptitude Global use #EntityResolution, #GraphVisualizations and analytics to deliver real-time insights and faster, easier investigations! #FraudDetection #DataManagement #DataAnalysis #SenzingPartner
Check out our brand new whitepaper in collaboration with Aptitude Global & @Senzing to discover how #entityresolution can help organizations gain a comprehensive view of their data and unlock hidden relationships. 🔑
https://t.co/KhWqgVZqLR
#RiskMitigation #DecisionIntelligence
Did you miss Sebastian's #Nodes2023 talk on graph visualizations with #Neo4j databases? No worries! You can watch it here https://t.co/SwXjVvIou8. The talk covers the generation of impressive #GraphVisualizations from the #data in your Neo4j #databases.
Struggling with complex #NetworkGraphs? Watch Senzing CEO @JeffJonas discuss how using #EntityResolution with your #GraphDatabase improves #GraphVisualizations and downstream analytics. #DataVisualization #DataAnalysis https://t.co/CmCKQmjxzl
Join us in just one hour at @Neo4j #Nodes2023!
Our CTO, Sebastian, will share the keys to creating stunning #GraphVisualizations from your #Neo4j data. https://t.co/nf6ga7V0P1

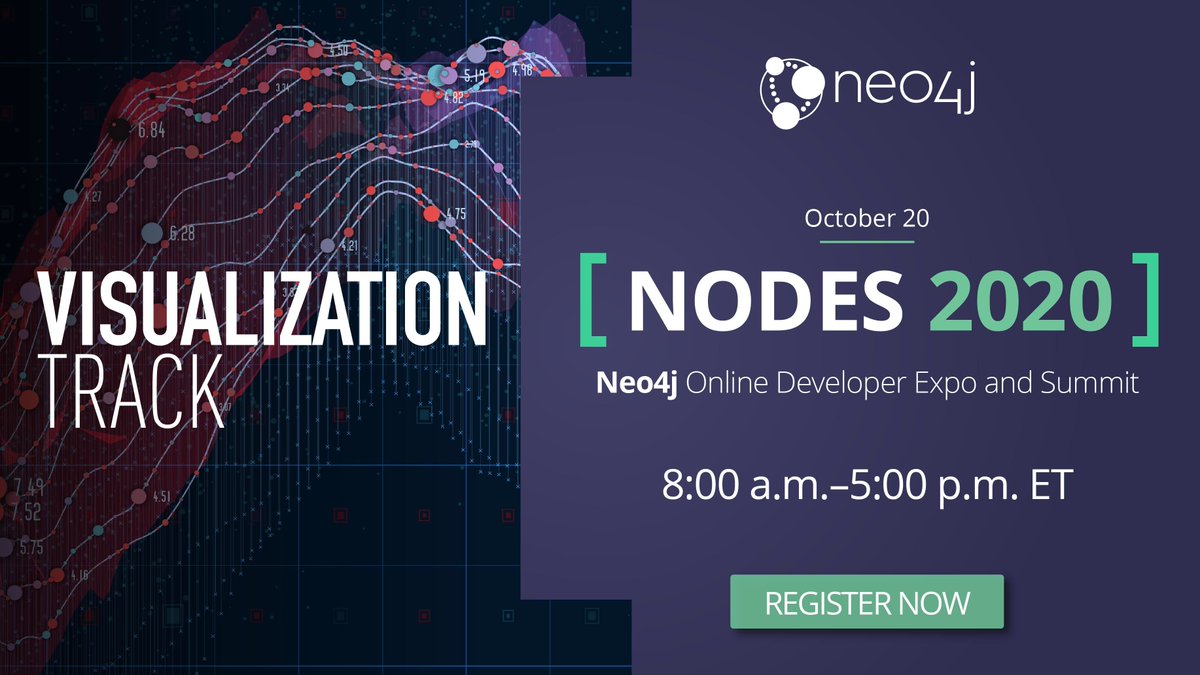
Don't miss @graph_aware's Miro Marchi and Michal Trnka at #NODES2020 on October 20!
"10+ Entity States in Graph Visualization And How To Make The Best Of Them"
Save your seat: https://t.co/1lfZDVo6ti
#visualization #graphvisualizations #graphtechnology

Curved links offer a slick new way to add clarity and character to connections in your #graphvisualizations. Want your #cybersecurity app to stand out from the crowd? Find out more: https://t.co/x2zAFdk0QJ
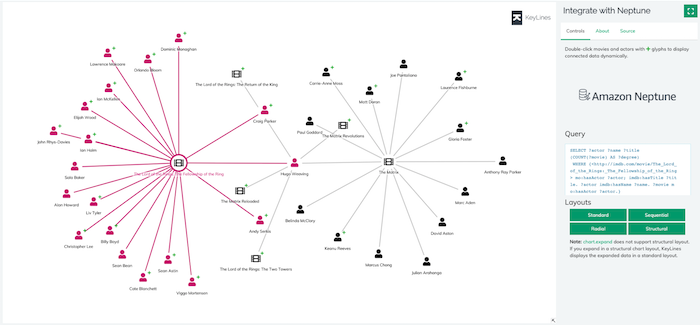
#KeyLines + @AmazonNeptune + SPARQL = powerful, scalable #graphvisualizations. Learn how to integrate your Neptune DB with our toolkit technology in this new-look developer tutorial: https://t.co/w7VN3YnwfO
If your #graphvisualizations contain thousands of nodes, how can analysts find the insight they need quickly and easily? Discover 5 ways to solve your big graph data challenge: https://t.co/a5ObCsgvkG
Trends for you
Most Popular Users

Elon Musk 
@elonmusk
240.1M followers

Barack Obama
@barackobama
119.3M followers

Donald J. Trump
@realdonaldtrump
111.6M followers

Cristiano Ronaldo
@cristiano
108.8M followers

Narendra Modi
@narendramodi
106.9M followers

Rihanna
@rihanna
97.2M followers

NASA
@nasa
92.1M followers

Justin Bieber
@justinbieber
90.5M followers

KATY PERRY
@katyperry
86.7M followers

Taylor Swift
@taylorswift13
80.5M followers

Lady Gaga
@ladygaga
72.1M followers

Kim Kardashian
@kimkardashian
69.3M followers

YouTube
@youtube
68.6M followers

Virat Kohli
@imvkohli
68.4M followers

Bill Gates
@billgates
63.4M followers

The Ellen Show
@theellenshow
62.5M followers

CNN
@cnn
61.9M followers

Neymar Jr
@neymarjr
61M followers

X
@x
60.9M followers

CNN Breaking News
@cnnbrk
59.9M followers