

Top Tweets for #gridExtra

📊📈📉📊📈📉#Rstats
Struggling with multiple plots on a single page in #Rprogramming? 🤔 Check out these tips to make it easier:
1. Use the #ggplot2 package for creating plots with a single command. 📊
2. Use the #gridExtra package to arrange multiple plots on a single page. 📈
3. Use the #cowplot package to create complex layouts with multiple plots. 📉
Here's an example code snippet to get you started:
```
library(ggplot2)
library(gridExtra)
library(cowplot)
plot1 <- ggplot(data = mtcars, aes(x = mpg, y = hp)) +
geom_point()
plot2 <- ggplot(data = mtcars, aes(x = mpg, y = wt)) +
geom_point()
grid.arrange(plot1, plot2, ncol = 2)
```
Try it out and simplify your #dataVisualization! 📊👀 #RStats #DataScience #DataViz #ProgrammingTips
📊📈📉📊📈📉
By using these tips and packages, you can create professional-lookingplots and simplify your data visualization process in R programming. Give it a try and see how it can improve your work! 🚀

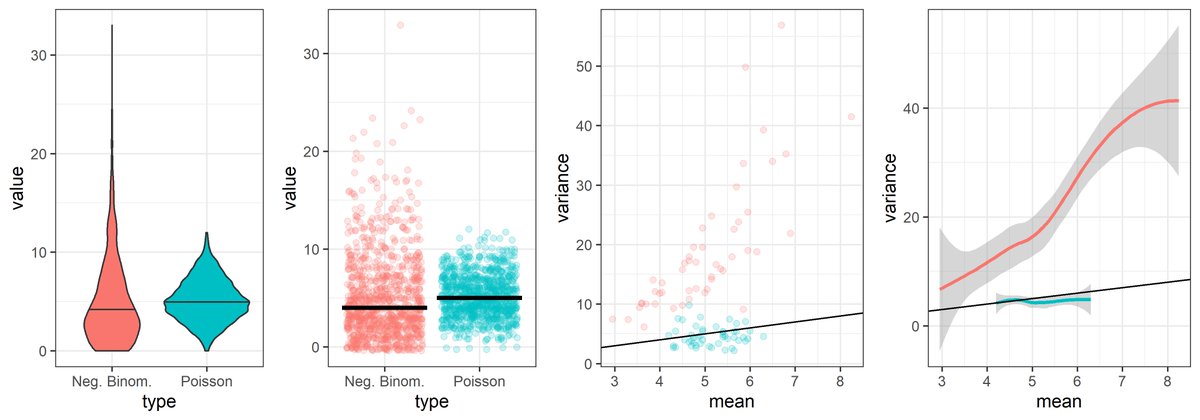
My newest gist shows how to simulate and plot Poisson and Negative Binomial distributions with #Rstats #ggplot #gridExtra #statistics #simulation https://t.co/omgLwRFq98


Not the prettiest, but learnt a lot of data wrangling stuff with #dplyr and also about using the package #countrycode and #gridExtra
Any tips/advice welcome! Code here: https://t.co/gma2mlMX5T
#RLadies #IzzyLearnsToCode #IzzyLearnsR #RStats

先輩の千葉での発表のグラフを作成。だいぶ慣れたと思ったけど、思わぬところで引っかかって苦戦した。今回は #ggplot2 に加えて #gridExtra も使用。まだまだだけど経験値は積めているかな。もっと早く作れるようになりたい。


showing the data next to the plot ismade possible by #gridExtra , tableGrob, textGrob, and grrid.arrange. #ggplot2 #rstats


If you came to last week's presentation on mapping with #ggmap here is the vignette for #gridExtra for making beautiful composite maps :) https://t.co/xIZUcEv2yV

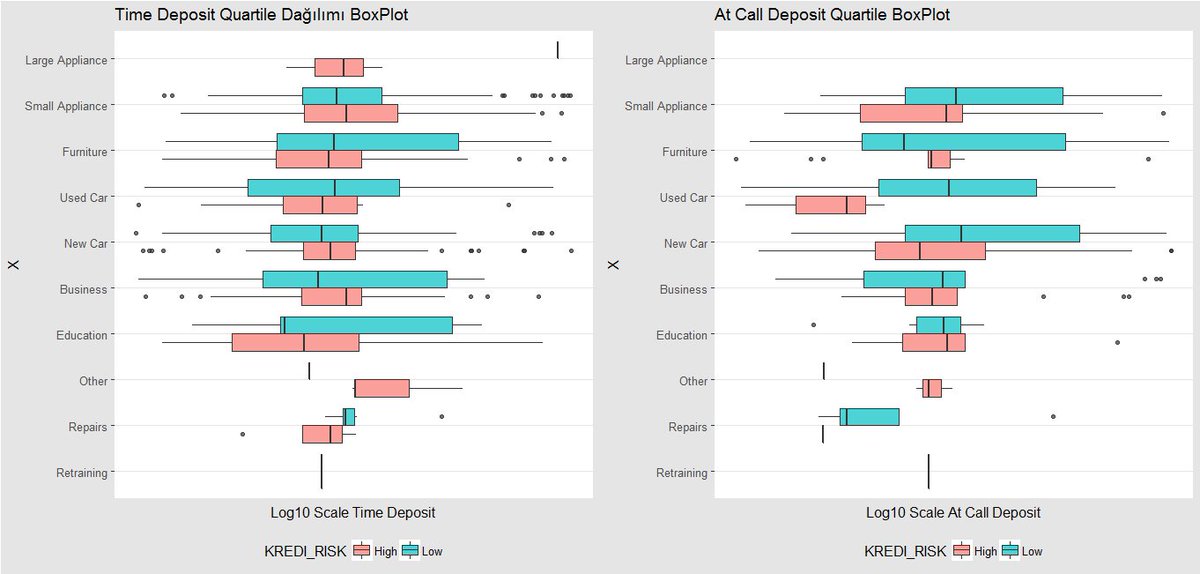
#MITLoansRiskDataSet #DataLabTarining color_group #investmentreason
X<-reorder(ks$KREDI_RISK,ks$VADELI_MEV)
Y<-reorder(ks$KREDI_RISK,ks$VADESIZ_MEV)
grid.arrange(p1+tlb,p2+tlb,ncol=2)
#gridExtra #boxplot #ggplot2 @rstatsbot1234 #casestudy @MIT #rstats #DataViz @DataLabTR


#MITLoansRiskDataSet #DataLabTarining
X<-reorder(ks$YATIRIM_NEDEN,ks$VADELI_MEV)
Y<-reorder(ks$YATIRIM_NEDEN,ks$VADESIZ_MEV)
grid.arrange(p1+tlb,p2+tlb,ncol=2)
#libray #gridExtra #boxplot #ggplot2
#casestudy @MIT #DataLabTraining #statisticalmethods #rstats #DataViz @DataLabTR

Here is the #patchwork an interesting #rstats alternative to #gridExtra for multi-panel plots in #ggplot2. #rstats #dataviz #DataScience https://t.co/vvnT3XilAH


@jebyrnes Looks super easy! I've used grid.arrange(plot1, plot2, ncol=1) before from package #gridExtra with #ggplot2 with similar outcome

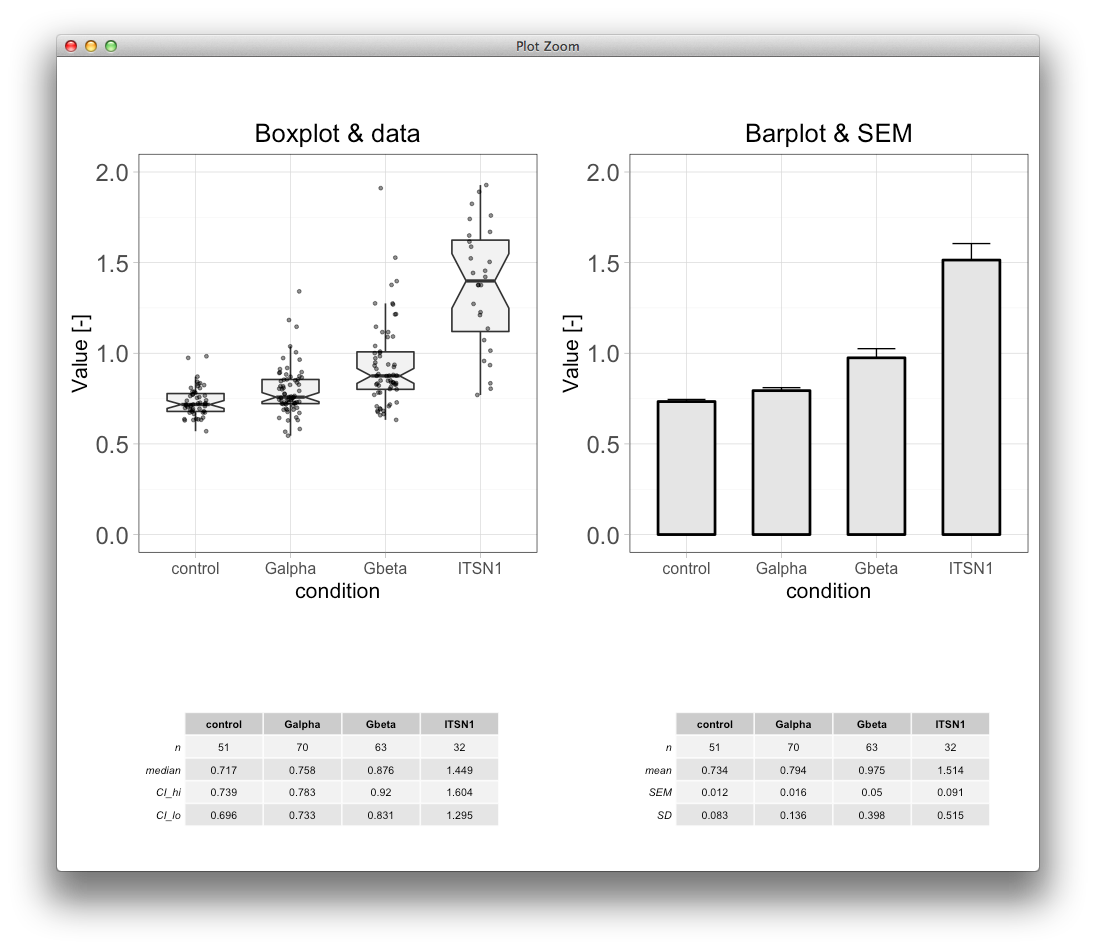

Ever had problems aligning the axes of multiple plots using #ggplot2 and #gridExtra? Here's an awesome tip https://t.co/uK93A02Arp

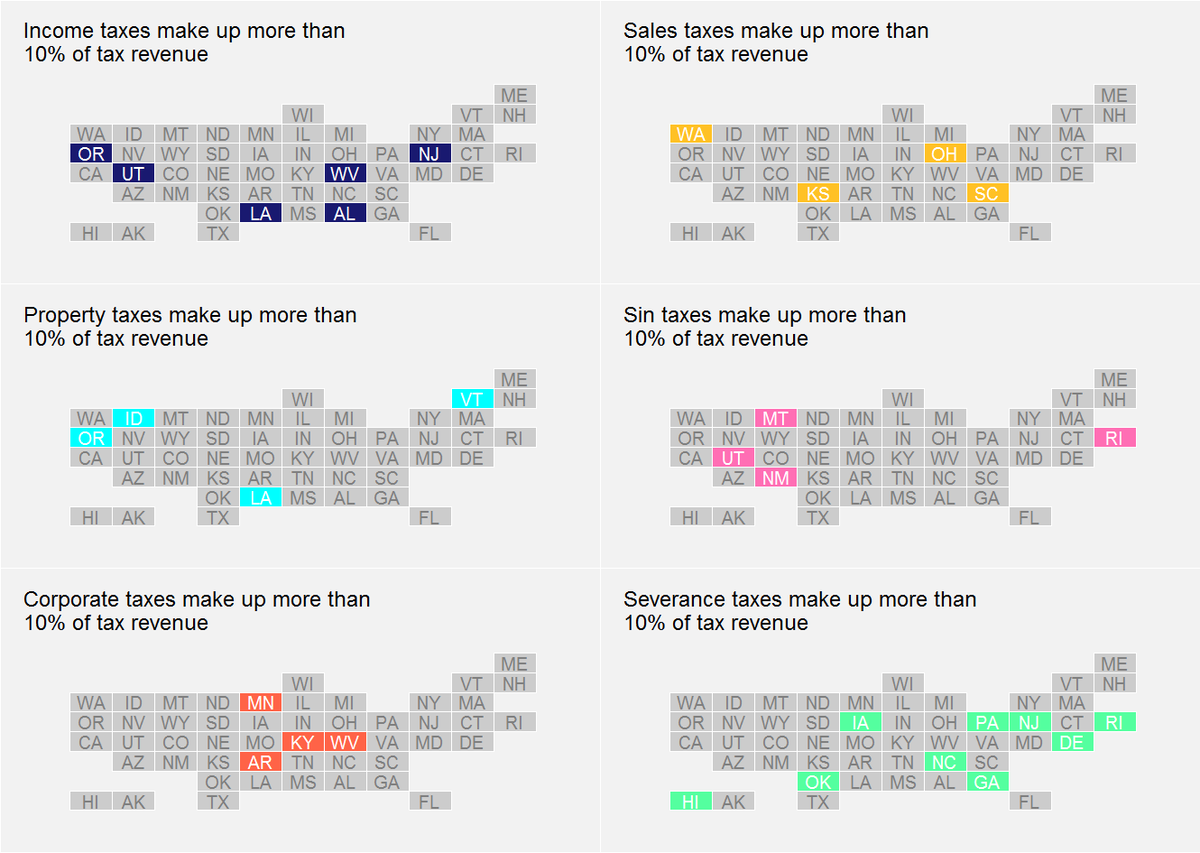
.@bruce_swihart, try #ggplot2 (geom_tile) & #gridExtra in #rstats. First trial below. title coloring a challange.
Trends for you
Most Popular Users

Elon Musk 
@elonmusk
241.1M followers

Barack Obama
@barackobama
119.1M followers

Cristiano Ronaldo
@cristiano
112.5M followers

Donald J. Trump
@realdonaldtrump
111.8M followers

Narendra Modi
@narendramodi
107.1M followers

Rihanna
@rihanna
98.2M followers

NASA
@nasa
92.2M followers

Justin Bieber
@justinbieber
91.3M followers

KATY PERRY
@katyperry
88.7M followers

Taylor Swift
@taylorswift13
82.6M followers

Lady Gaga
@ladygaga
74.1M followers

Virat Kohli
@imvkohli
71.6M followers

Kim Kardashian
@kimkardashian
70.3M followers

YouTube
@youtube
68.7M followers

Bill Gates
@billgates
64.5M followers

Neymar Jr
@neymarjr
64.5M followers

The Ellen Show
@theellenshow
62.4M followers

CNN
@cnn
61.8M followers

Selena Gomez
@selenagomez
61.8M followers

X
@x
60.8M followers