

Top Tweets for #grtusd

Muhtemelen uzayan 5 içinde Ending diyagonal bitişi ile tamamlayacak görünüyor.
GRTUSD
#grtusd #ai #yapayzeka

Sanırım aşağı yönlü devam edecek!

🌌 AI Analysis for $GRT #GRTUSD | 1D https://t.co/XonKmgcCkz
- The probability of further downward movements is high as long as no clear bullish reversal is recognizable. I expect that the price will initially test the support level at 0.02670 USD and potentially also fall to 0.02630 USD.
- Only when a strong reaction and confirmation on H4/H1 becomes visible in this area can a long setup be considered – the target would then initially be 0.03260 USD.
- However, if the price rises above the equilibrium level of 0.03200 USD and settles there, I would change my expectation to an increase towards 0.03710 USD.
- For a short after manipulation above 0.03714 USD (false breakout), an entry after bearish confirmation and a target at 0.03260 USD and 0.02670 USD would be sensible.
📝 This is not investment advice but is for educational purposes only.
📊 Get detailed free analysis of any coin on any timeframe you want. Try Finora AI - Your Trade Buddy for free → https://t.co/kMPco9FZVU

🌌 AI Analysis for $GRT #GRTUSD | 1D https://t.co/XonKmgc4v1
- The probability of further downward movement remains high as long as the price stays below 0.03170 USD and 0.03360 USD – these two levels should act as resistance 🚩
- Ideal for a short entry would be confirmation in the form of a rejection pattern at the mentioned resistances. Example: The price tests 0.03170 USD briefly, forms a clear pin bar or a bearish engulfing, then a short can be placed. Take-profit zone would be 0.02960 USD to 0.02670 USD. The stop-loss should be above the local swing high.
- A long setup only presents itself if a fakeout occurs below 0.02670 USD, which is immediately bought back (liquidity sweep). Confirmation would be, for example, a bullish pin bar or a strong rise on smaller time frames. Entry would be directly after the confirmation candle, take-profit at 0.03170 USD and 0.03360 USD. The stop-loss below the last swing low.
- Bias only changes when the price clearly closes above 0.03360 USD and volume comes in there – that wou...
📊 Get detailed free analysis of any coin on any timeframe you want. Try Finora AI - Your Trade Buddy for free → https://t.co/kMPco9Fs6m

🌌 AI Analysis for $GRT #GRTUSD | 1D https://t.co/XonKmgc4v1
- Currently, it looks like we have seen a liquidity absorption at the last swing low (0.02670–0.02630). If the price breaks down again there and is immediately bought back (strong reversal candle!), I expect a short-term upward movement to at least 0.03170 – with potential up to 0.03430.
- If the momentum remains weak and sustainably breaks 0.02630, I expect further lows.
- For a long entry, one should definitely wait until the price dips below the last low and then forms a clear reversal formation (e.g., strong pin bar on daily or 4-hour basis, or a significant bullish engulfing). An entry directly without such confirmation is highly risky!
- For shorts, I would wait for a false breakout above 0.03430 or ideally 0.03710, followed by a clear rejection and weak candles, and then trade downwards.
- My bias: cautiously bullish short-term long chance after sweep and reversal at the low, medium-term still bearish as long as 0.03710 is not convincingly reclaimed....
📊 Get detailed free analysis of any coin on any timeframe you want. Try Finora AI - Your Trade Buddy for free → https://t.co/kMPco9Fs6m
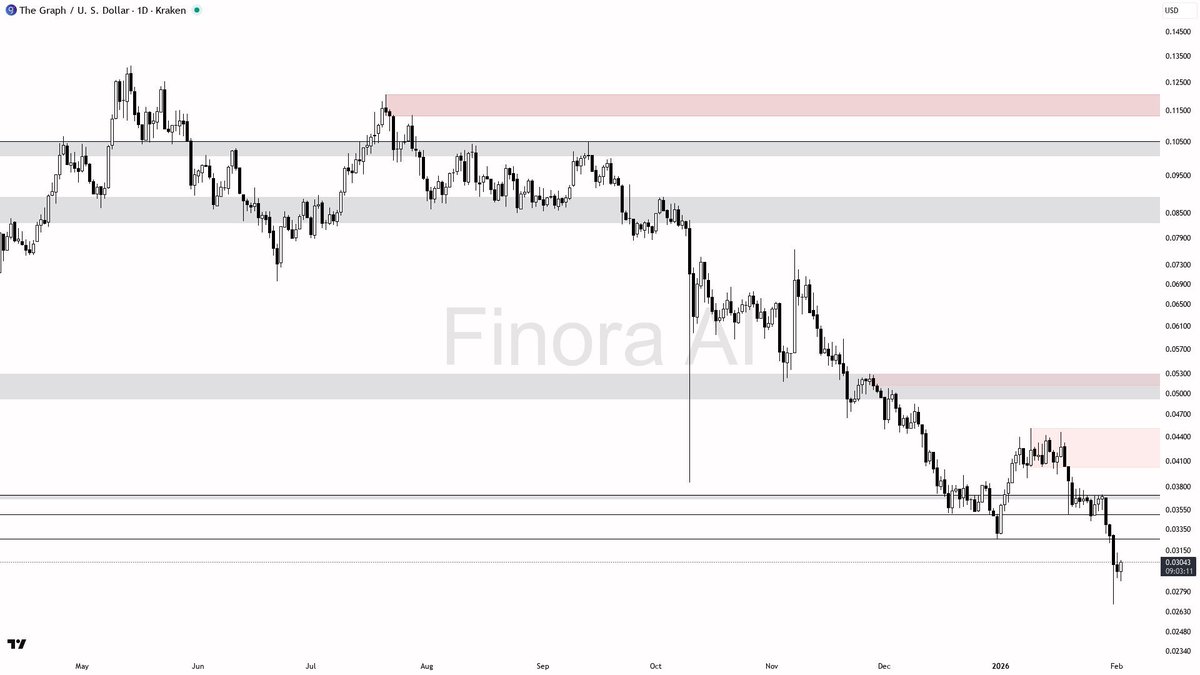
🌌 AI Analysis for $GRT #GRTUSD | 1W https://t.co/XonKmgc4v1
- As long as no bullish reversal formation appears on a weekly basis, I remain clearly bearish. The next targets are at $0.02950 and $0.02590, possibly even lower.
- Only when the price rises clearly back above $0.03430 and closes above $0.04470 could the picture change and a run towards $0.06630 become possible.
- Currently, no hasty longs – only after a clear reversal and liquidity theft below the last low would a long setup be justifiable. Otherwise, the short scenario prevails.
📝 This is not investment advice, but is for educational purposes only.
📊 Get detailed free analysis of any coin on any timeframe you want. Try Finora AI - Your Trade Buddy for free → https://t.co/kMPco9Fs6m


وعليكم السلام ورحمة الله وبركاته زملائي
نحن الآن سنقوم بتحليل الذهب
وننتظر أفضل دقّة ⭐
هل الشراء على الذهب أم البيع على الذهب؟
كونوا متابعين وجاهزين وانتظروا الإشارة ✨
!#manta #btc #eth #xrp #SuiNetwork #bonkyubon #pol #pepe #GRTUSD


📈 LONG: #GRTUSD | $GRT | 1W
GRT may see an 80-100% price surge.
🚀 More signals → https://t.co/Exen6ac84a


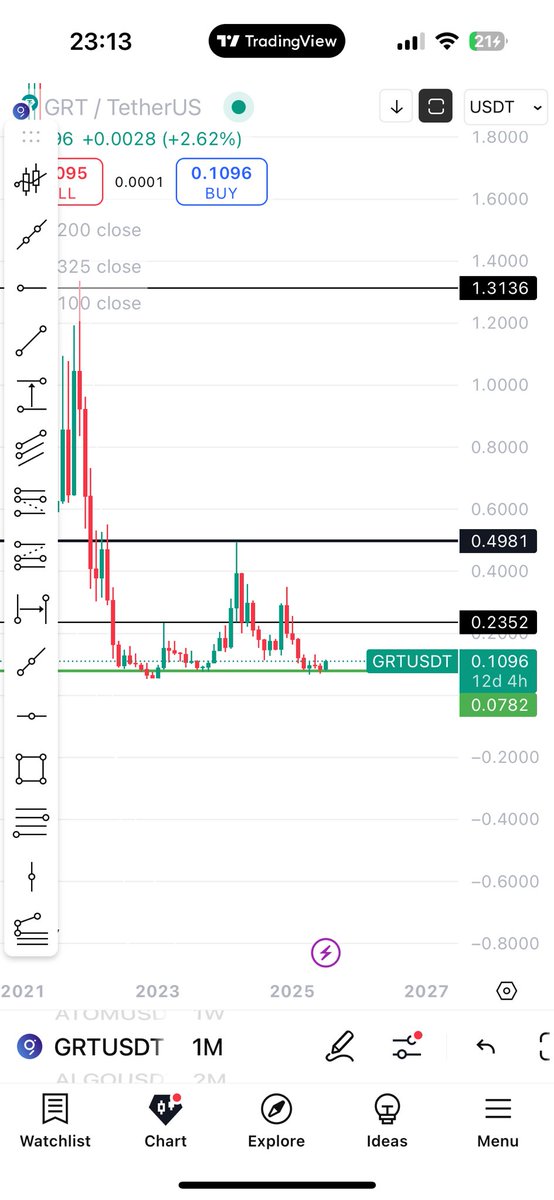
🔥 $GRT Update on Monthly 🔥
GRT here looks promising to touch at least 0.23 zone and after that to try and see higher prices.
Up until now more than 35% on this position.
#GRT #Altseason #charts #grtusd #altcoins

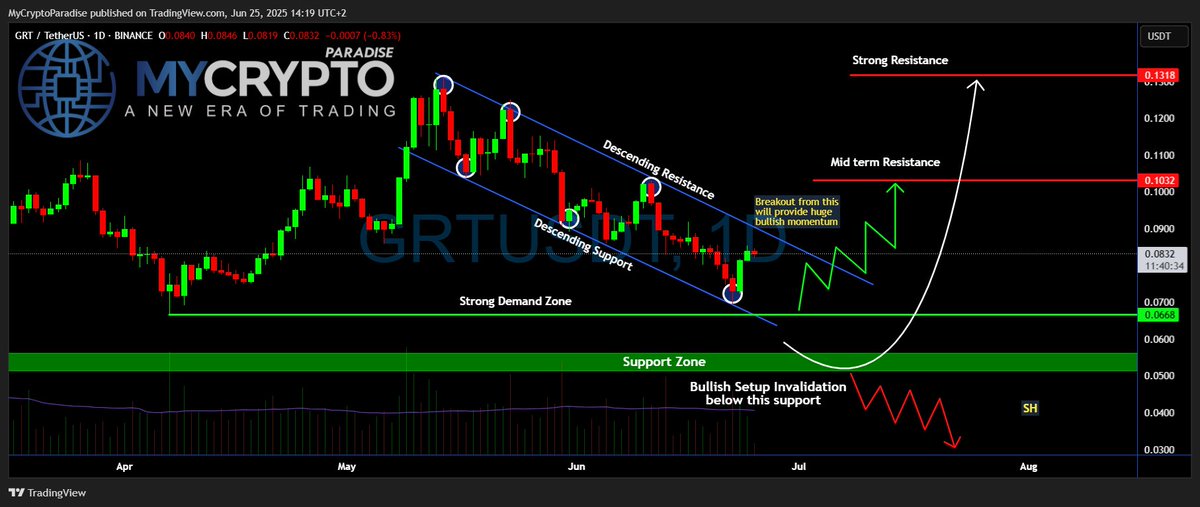
Yello, Paradisers! Are we looking at a clean breakout setup that could send #GRT flying or is this the perfect trap to wipe out early bulls? Let's see the latest #GRTUSDT moves:
💎The daily chart on #GRTUSD is showing a perfectly formed descending channel, with price now hovering just above the lower boundary—a zone that has consistently held as strong descending support. After multiple rejections from the upper boundary and rebounds off the lower trendline, the price has now shown its first serious signs of momentum since bottoming in the strong demand zone
💎This structure has been in play since early May for #TheGraph, with each bounce from the support line giving temporary relief, only for the price to get slapped down at the descending resistance. But this most recent bounce looks different—it’s happening directly above a well-defined demand zone between $0.0668–$0.0700, a level that has historically attracted strong buyer interest.
💎A breakout above the descending resistance trendline, ideally with a strong daily close above $0.085–$0.090, would invalidate the bearish pressure and likely trigger a sharp leg up. The mid-term resistance sits around $0.1032, and clearing that would open the door to a retest of $0.1318, a level that previously acted as a strong rejection zone.
💎If the price fails to reclaim the descending channel and rolls over again, especially losing $0.0668 on a daily close, the bullish structure would be invalidated. That would shift focus toward the support zone at $0.053, and if that breaks, the next target becomes $0.0300—a brutal drop that would liquidate most late longs and signal deeper downside.
Stay disciplined. The next big opportunity will come to those who wait, not those who chase.
MyCryptoParadise
iFeel the success🌴

GRT USDT Strong Support Level and Next Targets ( Trading Signals ) 🚀 Mar 26, 2025 https://t.co/TTc6nQtpws #grtusdt #grtusd #cryptonews #cryptotrading

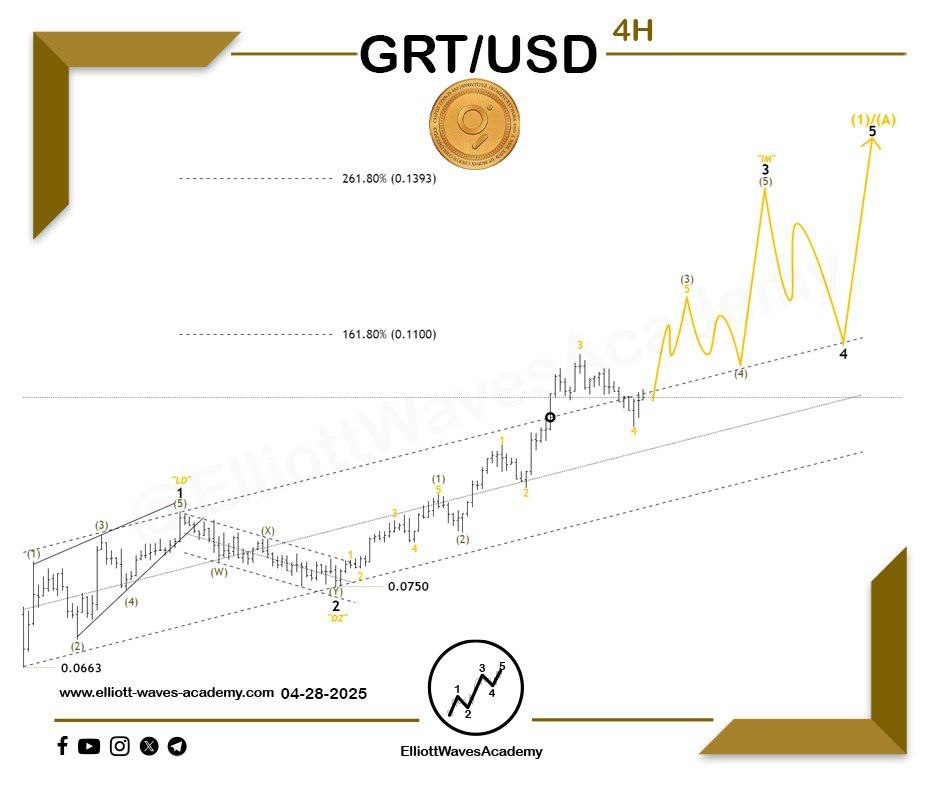
The Expected Path for the Cryptocurrency #GRTUSD 🇺🇸 on the 4-Hour Timeframe
📈 An impulsive upward wave
🏹 The pair has broken out of the main price channel through the sub-waves of wave (3) of wave 3. Given the impulsive nature of the upward wave, we expect the following:
1. Reaching the 161.8% extension of wave 1 as one of the targets for wave 3, which may extend to the 261.80% level.
2. Wave 4 is expected to form sideways due to the sharp nature of wave 2, which formed in a steep structure.
3. Another upward movement through wave 5, forming an impulsive wave of a higher degree.
For Our Daily Premium Analysis 👉 : https://t.co/pzApvDSbYX
For Our Educational Program 👉 :
https://t.co/CRUph7e5PO
#elliottwave #tradingview #technicalanalysis #swingtrading #waveanalysis #BTCUSD #cryptocurrencies #btctrading #forexdubai #forexeurope #forexuk #ETHUSD #tradingstrategies #priceactiontrader #ethereumtrading #ethereuminvestment #ethereumprice #bitcoinsignals #priceactiontrading #forexmalaysia #forexespanol #forexfrance #tradingacademy #forexaustralia #bitcointrading #Dogecoin #GRTUSDT

Check out my #GRTUSD analysis on @TradingView: https://t.co/fmtMSeQrfH COMME GRT C EST UN ACTIF BAISSIER COMME JASMY MEME FORMAT DONC PEU REFAIRE LOWLOW

📈 LONG : #BINANCE | #GRTUSDT | $GRT | #GRTUSD | #GRT
Point of attraction noted in the charts, emphasizing strength.
🔔 Signal: https://t.co/kRW74azfKI
#cryptocurrency #cryptotrading


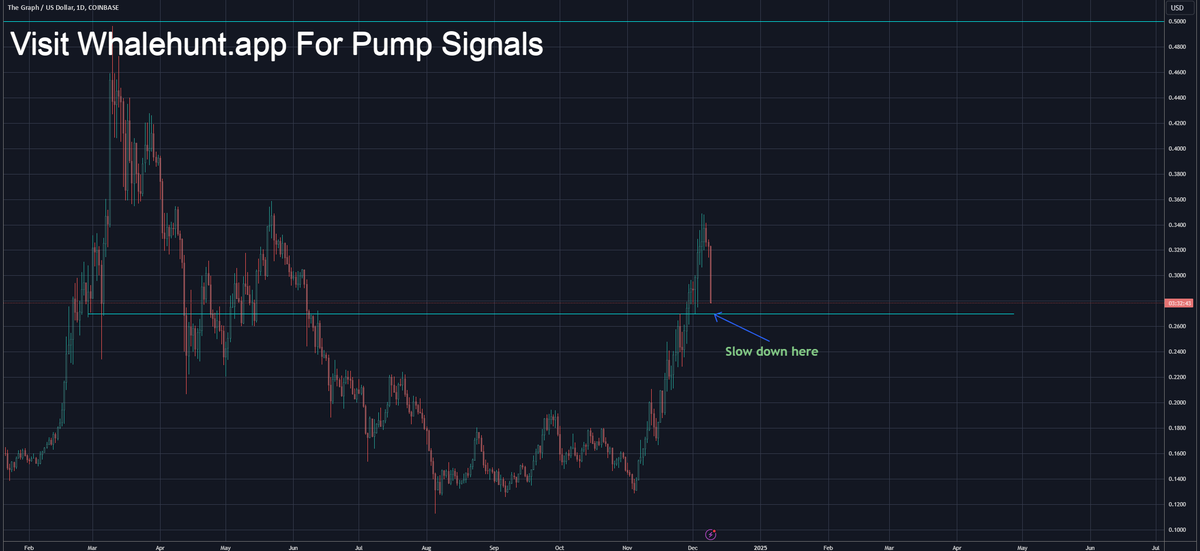

#GRTUSD
🚨 $GRT Elliott-Wellen-Update 🚨
🟢 Primäres Szenario:
Die Welle ii (grün) wurde im Bereich zwischen 0.237$ und 0.124$ abgeschlossen. $GRT befindet sich aktuell in der impulsiven Welle iii (grün) und zeigt starkes Momentum! 💪
🔝 Ziel: Überwindung der 0.496$-Marke und Abschluss der Welle iii(grün) im Bereich 1.25$ - 1.7$.
👉 Wahrscheinlichkeit: 75%
1. Alternatives Szenario:
Sollte $GRT zwischen 0.336$ und 0.449$ eine Korrektur in Form der Welle Alt 2 (weiß) bilden, könnte dies zu einem Rückfall unter 0.0765$ führen.
👉 Wahrscheinlichkeit: 25%
Zusammenfassung:
🔝 Primärziel für Welle iii(grün): 1.25$ - 1.7$
⚠️ Alternatives Szenario: Rückgang unter 0.0765$




Most Popular Users

Elon Musk 
@elonmusk
241.7M followers

Barack Obama
@barackobama
119M followers

Cristiano Ronaldo
@cristiano
114.2M followers

Donald J. Trump
@realdonaldtrump
111.8M followers

Narendra Modi
@narendramodi
107.2M followers

Rihanna
@rihanna
98.7M followers

NASA
@nasa
92.4M followers

Justin Bieber
@justinbieber
91.8M followers

KATY PERRY
@katyperry
89.9M followers

Taylor Swift
@taylorswift13
83.8M followers

Lady Gaga
@ladygaga
75.3M followers

Virat Kohli
@imvkohli
73.2M followers

Kim Kardashian
@kimkardashian
70.8M followers

YouTube
@youtube
68.8M followers

Neymar Jr
@neymarjr
66.2M followers

Bill Gates
@billgates
65.1M followers

Selena Gomez
@selenagomez
63M followers

The Ellen Show
@theellenshow
62.3M followers

CNN
@cnn
61.8M followers

X
@x
60.7M followers