Top Tweets for #labplot

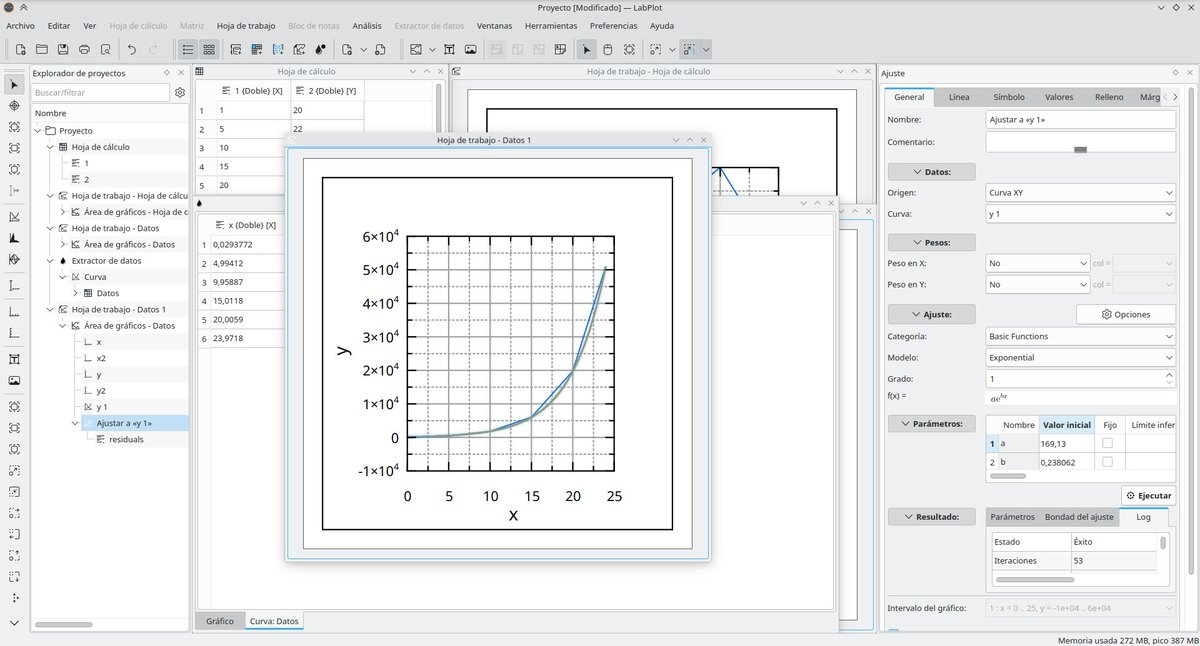
We completed our @NGIZero Core funded project!
👉https://t.co/OP5La27y0l
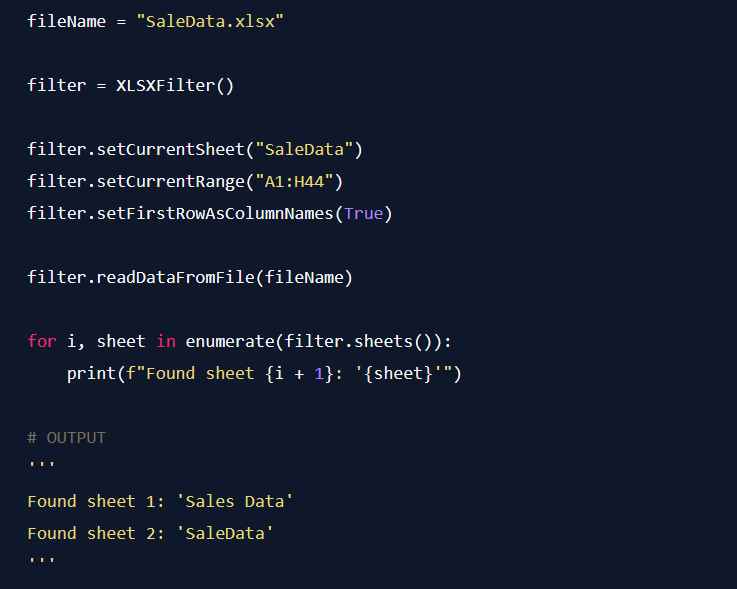
Coming soon to #LabPlot: Python scripting, live data analysis, and a suite of 13 statistical hypothesis tests like t-Tests, ANOVA or Chi-Square.
#OpenSource #Statistics #Python #NGIZero #DataAnalysis


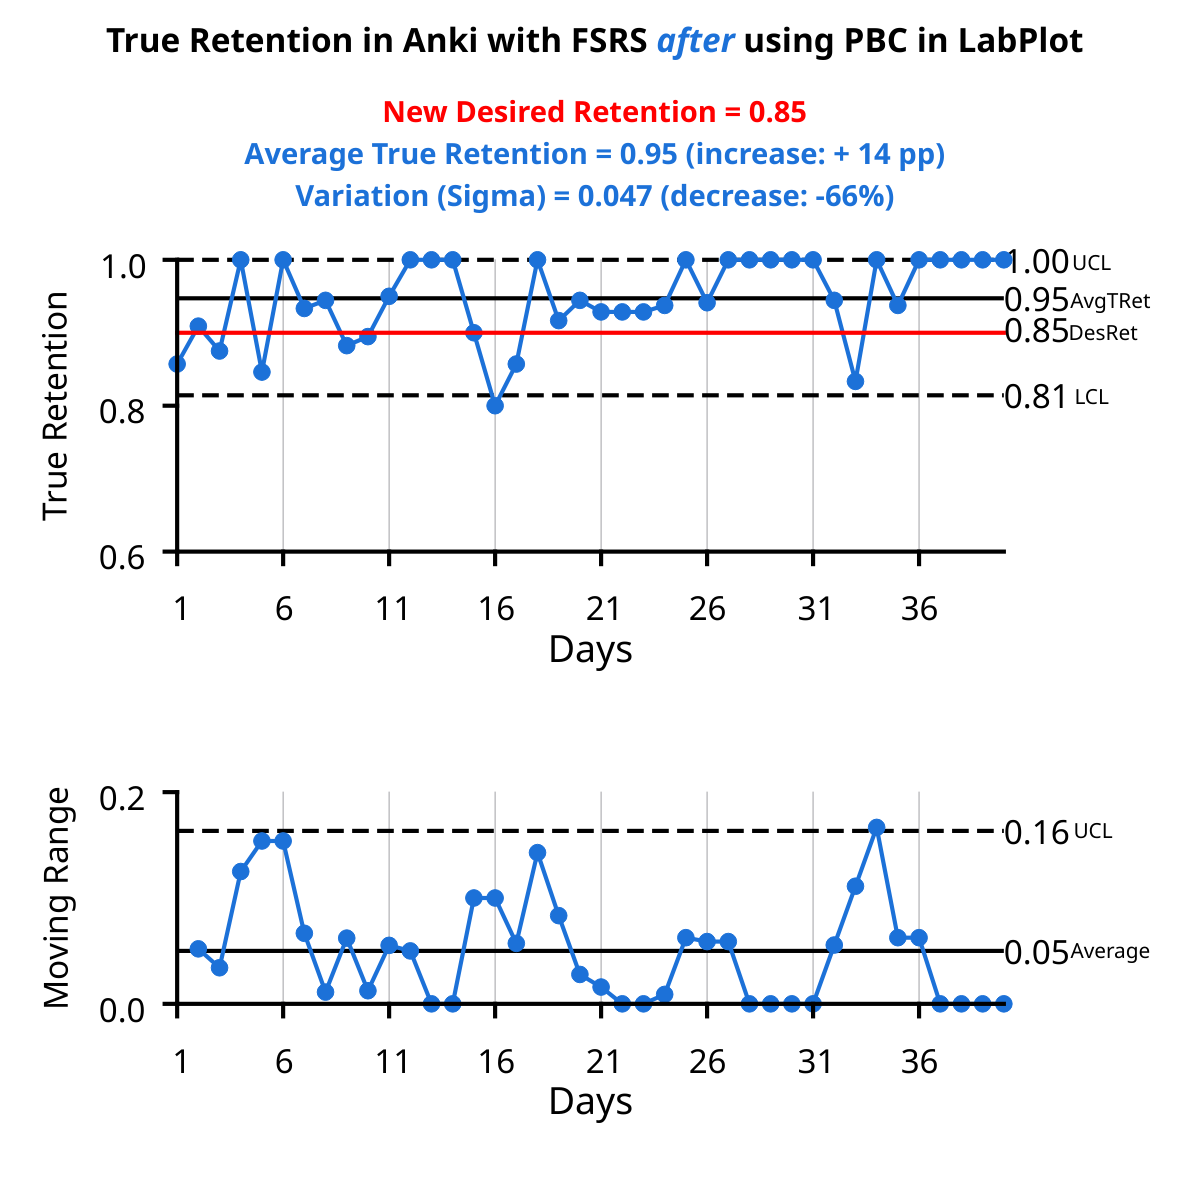
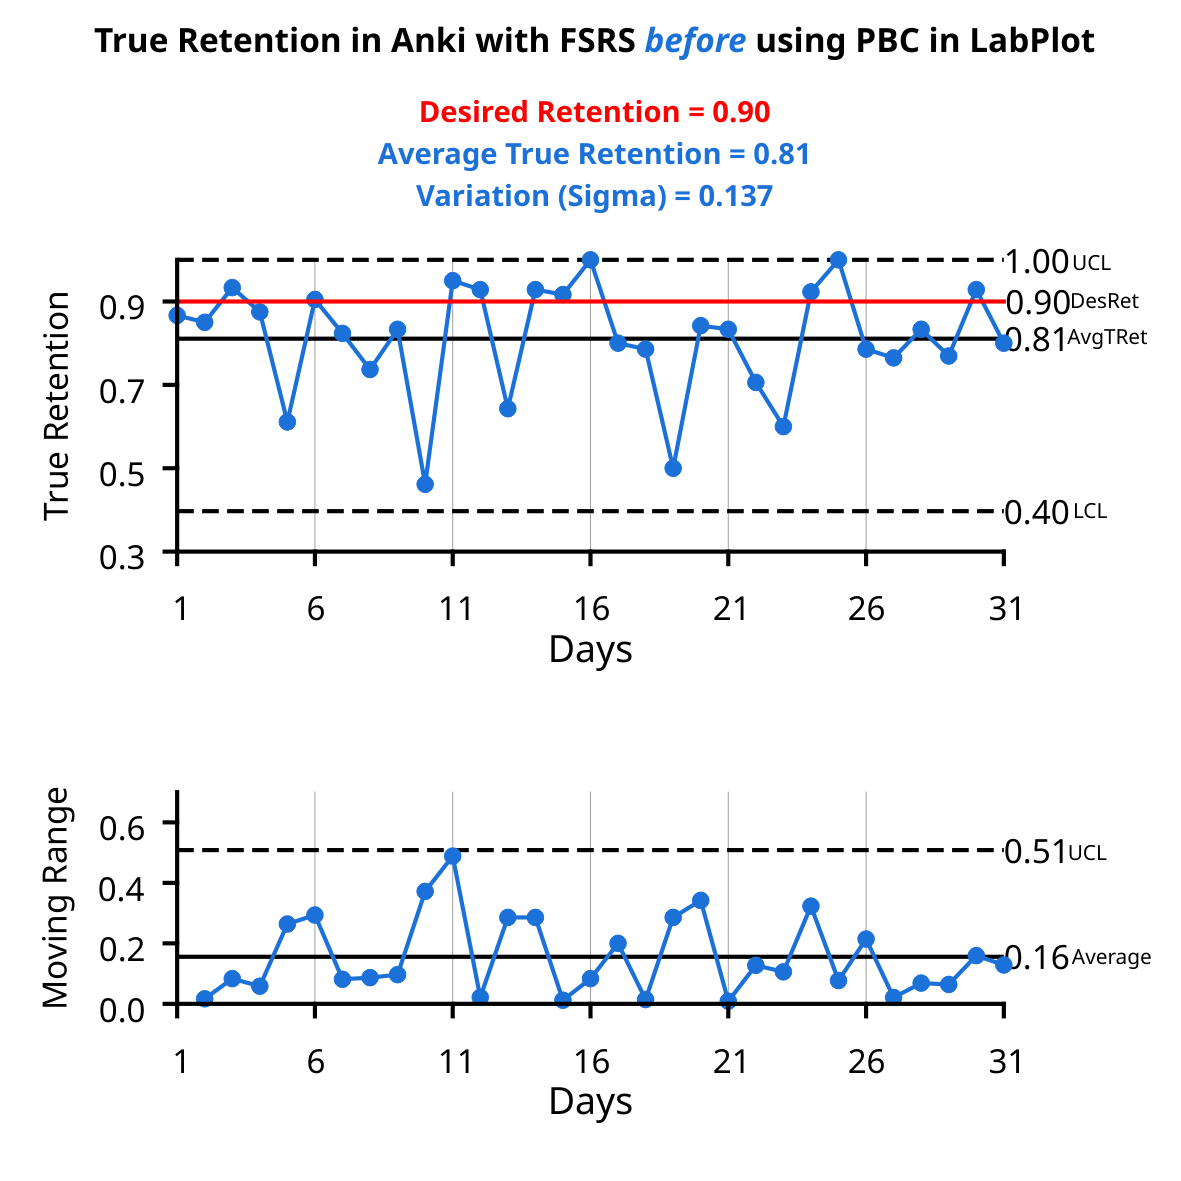
A food for thought: The same algorithm used in #Anki (#FSRS), but two radically different processes. Two #XmR charts made in #LabPlot demonstrate the value of an interaction between Process Behavior Charts and a human mind.
@JarrettYe
#study #learning #SpacedRepetition #SRS
#LabPlot, the project for #statisticians, #researchers, #scientists, #engineers, #educators and #students, publishes version 2.12 of its #FREE comprehensive #dataAnalysis and #visualization tool.
https://t.co/kfGZ4MKN1o


Improving UX is as important as developing new features.
When duplicating an object in the project explorer, it's now possible in #LabPlot [dev] to place the copy right below the original object.
➡️https://t.co/DfuX06K6Mz
#FreeSoftware #OpenSource #FOSS #DataAnalysis #KDE #UX
New #LabPlot Documentation 📚🚀
We have been working on transferring LabPlot's documentation to a new format. The manual still needs to be supplemented with new content, so we encourage everyone to contribute.🙂
Read more here:
https://t.co/9E8t0cwl8D
#FreeSoftware #OpenSource


Should the legend text color follow the plot (line, symbol etc.) color or have a uniform color? Which one do you prefer?
#LabPlot (nightly) supports both cases.
#DataAnalysis #DataVisualization #Color #Plot #Chart #EdwardTufte #Sparklines #OpenSource #FreeSoftware #FOSS #FLOSS

Two examples of using #LabPlot for visualization and analysis of #LiveData.
1\ Visualizing #LiveData from a #SerialPort in #LabPlot
#DataVisualization #DataAnalysis #Robotics #Engineering #FreeSoftware #OpenSource #Arduino #IoT #HomeAssistant #RaspberryPi #Automation
A new feature has been recently merged into the dev branch of #LabPlot - the new visualization: Run Chart.
The comparison between a Process Behavior Chart (XMR) and a Run Chart:
#DataAnalysis #Statistics #Quality #ControlChart #OpenSource #Business #FreeSoftware #Deming #Lean


"#LabPlot es una solución de código abierto que ofrece una amplia gama de funcionalidades para la visualización de datos científicos y el análisis de datos."
➡️ https://t.co/VMG7KYEZ8z
#DataVisualization #DataAnalysis #OpenSource #Engineering #Science
Color Blind Awareness Day – 6th September!
There are multiple color maps that are color-vision deficiency friendly and many of them are already available in #LabPlot.
Read more:
➡️https://t.co/fHKLZJP04F
#Color #Vision #Visualization #Accessibility #FreeSoftware #OpenSource

Have you seen this short video on plotting real time data using #LabPlot?
https://t.co/m42lld1YY5
#RealTime #LiveData #SensorData #Sensors #DataVisualization #Plotting #Graphs #OpenSource #FreeSoftware #FOSS #Robotics #Engineering #Science #Research
Have you seen this video tutorial on how to extract plots, curves and data points from images using #LabPlot's Data Picker tool ?
Data Picker has been available in LabPlot since the version 2.2, but we renamed it to Data Extractor.
https://t.co/2n8Xthp7T1
#PlotDigitizer #Data
#LabPlot is currently fully available in British English, Catalan, Dutch, Galician, German, Polish, Slovenian, Spanish, Swedish and partially available in French, Italian, Ukrainian, Russian and other languages.
#Translation #OpenSource #FreeSoftware #FOSS #KDE

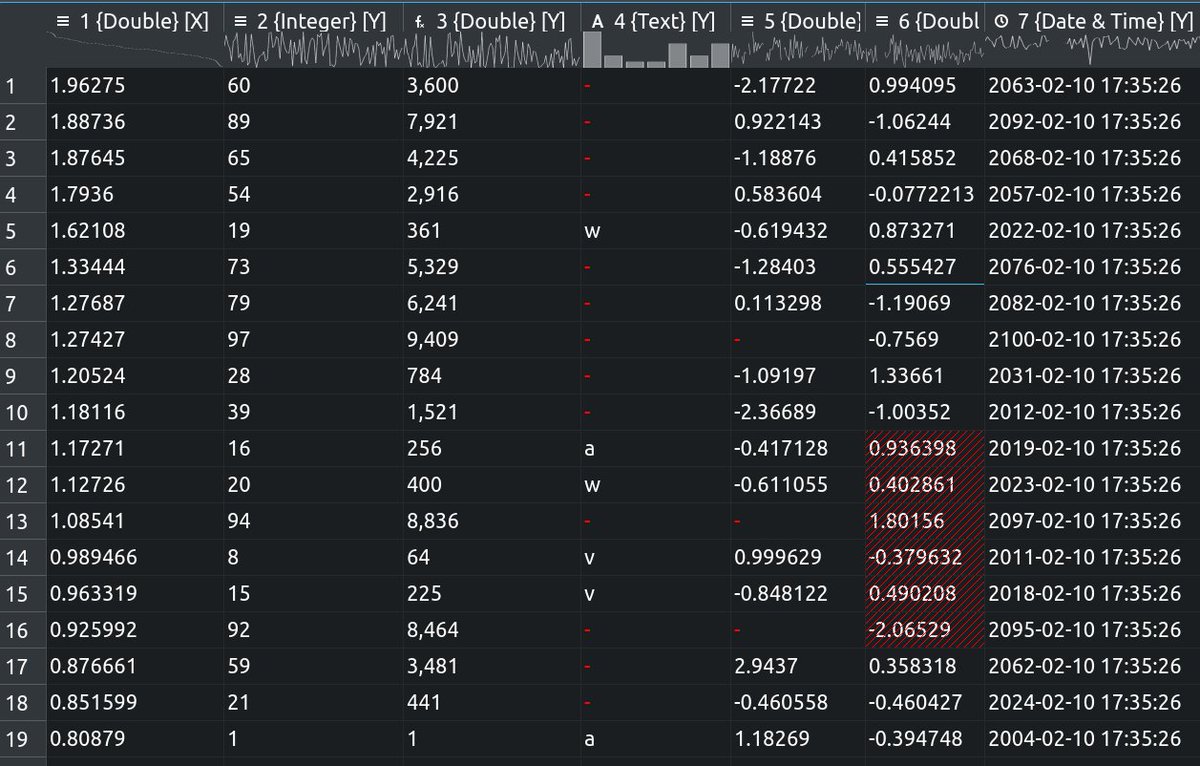
You can also display #sparklines in the header of a spreadsheet in #LabPlot, an open source and cross-platform data visualization and analysis software.
#EdwardTufte
@EdwardTufte suggests two principles for making efficient plots:
▶️ Erase non-data-ink, within reason.
���️ Erase redundant data-ink, within reason.
In #LabPlot you can apply #Tufte's theme for plots with a single click via Theme > Tufte.
#DataVisualization #DataAnalysis

This page contains a list of external resources mentioning #LabPlot and its usage in various areas.
➡️ https://t.co/6pBS9TfVfU
If you are aware of other resources that should be listed, please contact us!
#Research #Physics #Medicine #Chemistry #Biology #Engineering #Robotics

An open access article by W. Morales González and J. E. Hernández-Ruiz: Experiencias en el uso del software LabPlot en el procesamiento analítico y gráfico de datos experimentales
➡️ https://t.co/GwahJXHf4P
#LabPlot #Students #Physics #Chemistry #Science #DataAnalysis

Last Seen Hashtags on Sotwe
Most Popular Users

Elon Musk 
@elonmusk
240.2M followers

Barack Obama
@barackobama
119.3M followers

Donald J. Trump
@realdonaldtrump
111.6M followers

Cristiano Ronaldo
@cristiano
109M followers

Narendra Modi
@narendramodi
107M followers

Rihanna
@rihanna
97.3M followers

NASA
@nasa
92.1M followers

Justin Bieber
@justinbieber
90.6M followers

KATY PERRY
@katyperry
86.8M followers

Taylor Swift
@taylorswift13
80.6M followers

Lady Gaga
@ladygaga
72.2M followers

Kim Kardashian
@kimkardashian
69.4M followers

YouTube
@youtube
68.6M followers

Virat Kohli
@imvkohli
68.6M followers

Bill Gates
@billgates
63.4M followers

The Ellen Show
@theellenshow
62.5M followers

CNN
@cnn
61.9M followers

Neymar Jr
@neymarjr
61.1M followers

X
@x
60.9M followers

Selena Gomez
@selenagomez
59.9M followers