Top Tweets for #matplotlibpyplot

Data Visualization for Data Analysis and Analytics
#datavisualization #datavisualisation #dataanalysis #datanalytics #python #datavisualization #dag #matplotlib #matplotlibpyplot #microsoftpowerbi


Revising Javascript After A Long Time || hecoin45
#coding #programming #75hard #75hardchallenge #coding #challenges #matplotlib #matplotlibpyplot #seaborn #python #datascience #data #dataanalytics #datascientist #machinelearning #machine
How To Revise A Coding Language :-

Tutorial #25 . . . . . .
Set gridlines properties
#matplotlib #matplotlibpyplot #python #pythonlearning #rizwancode #pythoncode #programmings #DataAnalytics #DataVisualization #DataScientists #plot_labels #programmers #plt #line_graph #DataScience #data

Tutorial #24 . . . . . .
How to add a grid line horizontally to a graph?
#matplotlib #matplotlibpyplot #python #pythonlearning #rizwancode #pythoncode #programmings #DataAnalytics #DataVisualization #DataScientists #plot_labels #programmers #plt #line_graph #DataScience #data

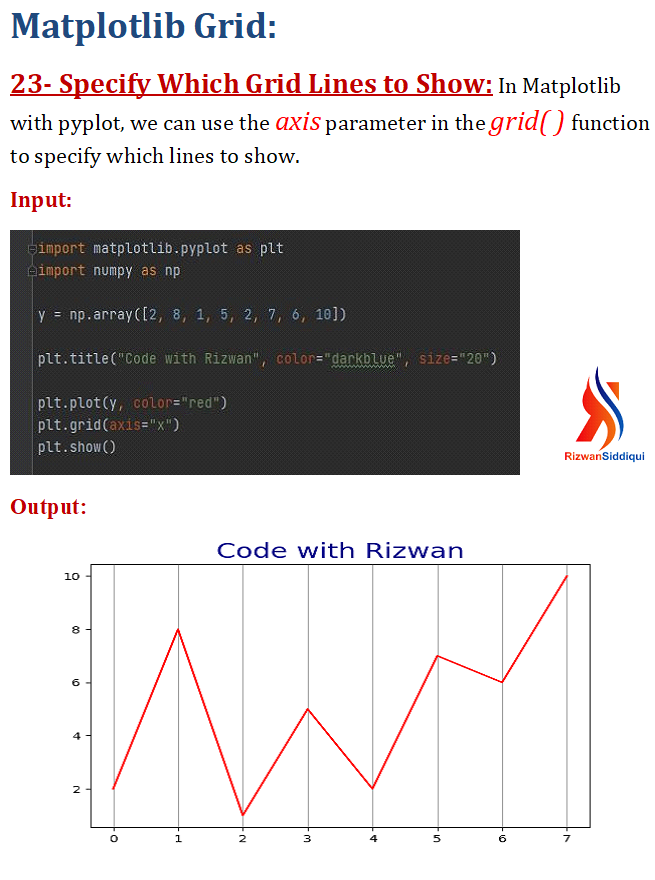
Tutorial #23 . . . . . .
How to add a grid line vertically to a graph?
#matplotlib #matplotlibpyplot #python #pythonlearning #rizwancode #pythoncode #programmings #DataAnalytics #DataVisualization #DataScientists #plot_labels #programmers #plt #line_graph #DataScience #data
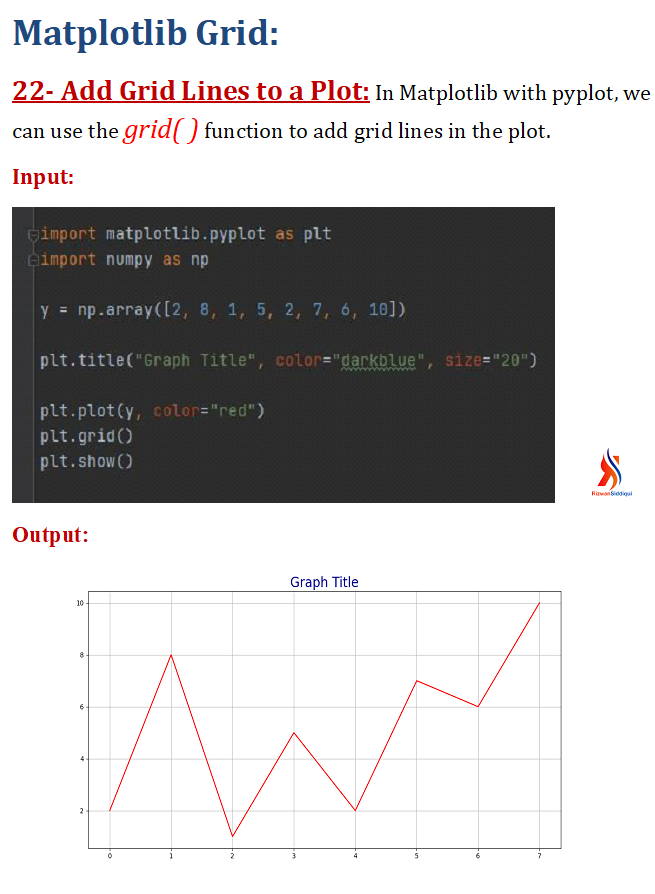
Tutorial #22 . . . . . .
How to add the gridlines in the graph?
#matplotlib #matplotlibpyplot #python #pythonlearning #python3 #rizwancode #pythoncode #programmings #DataAnalytics #DataVisualization #DataScientists #plot_labels #programmers #plt #line_graph #DataScience #data
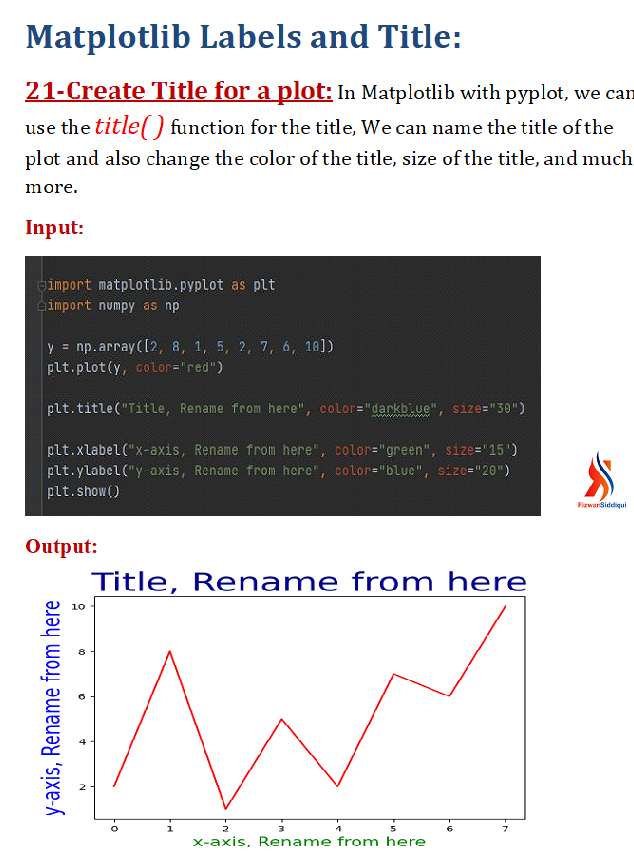
Tutorial #21 . . . . . .
How to create Title for the graphs?
#matplotlib #matplotlibpyplot #python #pythonlearning #python3 #rizwancode #pythoncode #programmings #programmer #plot #plots #graph #plot_labels #programmers #plt #line_graph #line_plot #plot_title #title #graph_title
Tutorial #14 ........ How to change the line style of a graph? #Matplotlib #Python #numpy #linestyle #matlib #python_programming #programmer #programming #coding #lines #programminglife #graphs #graphs_in_python #matplotlibpyplot #pyplot #math

Tutorial #11
How to change the marker face color in a graph.
#python #matplotlib #markerfacecolor #program #programmer #programmers #programming #programmings #programmerlife #matplotlibpyplot #DataAnalytics #DataVisualization #graph #graph_in_python #graphs_in_matplotlib

Tutorial #10
How to set the color of the line in a graph.
#python #matplotlib #marker_in_python #program #programmer #programmers #programming #programmings #programmerlife #matplotlibpyplot #DataAnalytics #DataVisualization #graph #graph_in_python #graphs_in_matplotlib


Customizing the colour of data points in scatter plot in Matplotlib Python
#matplotlib #python #pythonprojects #pythonlearning #pythonprogramming #pythons #matplotlibpyplot #aipython #coding #jupyternotebook #jupyter #scatter #plot #statistics #colors #colours #datavisualization
Learn to create a simple scatter plot in Matplotlib Python
#matplotlib #python #pythonprojects #pythonlearning #pythonprogramming #pythons #matplotlibpyplot #aipython #coding #jupyternotebook #jupyter #scatter #plot #statistics
How to display 2 or more plots on the same Graph in Matplotlib Python
#python #matplotlib #aipython #ai #datavisualization #dataanalytics #datascience #pythonlearning #pythonprogramming #plot #pyplot #matplotlibpyplot
Automatic X-axis assignment for a plot in Matplotlib Python.
#python #pythonlearning #pythonprogramming #pythonprojects #pythons #jupyternotebook #jupyter #matplotlib #matplotlibpyplot #IDE #codeeditor #plot #axis #datavisualization #datascience
@matplotlib @PythonHub
Format the line style of a plot using several line type, color and width in Matplotlib Python
#python #pythonprogramming #aipython #code #codinglife #codingforkids #codingforbeginners #matplotlibpyplot #matplotlib #pyplot #line #graph #jupyternotebook #jupyter #datavisualization
Assigning X and Y label to a plot in Matplotlib Python
#aipython #ai #python #matplotlib #matplotlibpyplot #pythonprogramming #pythons #pythonlearning #IDE #plotlabel #label #labels #datavisualization #datascience #plot

Last Seen Hashtags on Sotwe
diyarbakırpasif
Seen from Turkey
พี่น้องเย็ดกัน
Seen from Thailand
darari_remix_outnow
Seen from Korea
nolimit ()
Seen from Brazil
macrophilia
Seen from United Kingdom
หนังโป็
Seen from Thailand
Blockchain
Seen from Colombia
equusgornazo
Seen from Brazil
smg4nsfw karen
Seen from United States
DelhiRentControlAct1958
Seen from Brazil
Trends for you
Most Popular Users

Elon Musk 
@elonmusk
240.1M followers

Barack Obama
@barackobama
119.3M followers

Donald J. Trump
@realdonaldtrump
111.6M followers

Cristiano Ronaldo
@cristiano
108.9M followers

Narendra Modi
@narendramodi
107M followers

Rihanna
@rihanna
97.3M followers

NASA
@nasa
92.1M followers

Justin Bieber
@justinbieber
90.6M followers

KATY PERRY
@katyperry
86.8M followers

Taylor Swift
@taylorswift13
80.6M followers

Lady Gaga
@ladygaga
72.1M followers

Kim Kardashian
@kimkardashian
69.4M followers

YouTube
@youtube
68.6M followers

Virat Kohli
@imvkohli
68.5M followers

Bill Gates
@billgates
63.4M followers

The Ellen Show
@theellenshow
62.5M followers

CNN
@cnn
61.9M followers

Neymar Jr
@neymarjr
61M followers

X
@x
60.9M followers

CNN Breaking News
@cnnbrk
59.9M followers