Top Tweets for #mbengineering

#MBENGINEERING
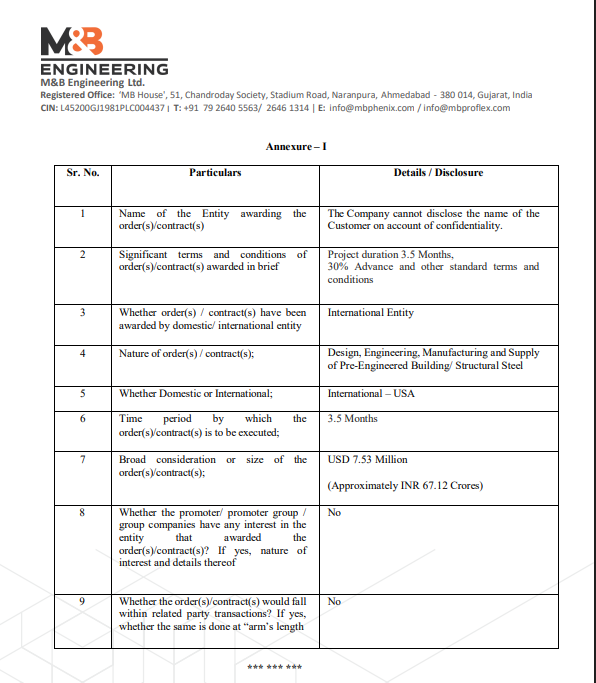
🚨 BIG INTERNATIONAL ORDER ALERT! 🌍🏗️
M&B Engineering Ltd has secured a massive global contract!
💼 Order Value: USD 7.53 Million (~₹67.12 Crores)
🏢 Market Cap: ₹2,280 Cr
🌎 Client: Confidential (USA-based international entity)
📦 Scope: Design, Engineering, Manufacturing & Supply of Pre-Engineered Buildings / Structural Steel
⏳ Execution Timeline: 3.5 Months
💸 Terms: 30% Advance + standard conditions
🔥 This deal strengthens M&B Engineering’s global presence and showcases India’s engineering prowess on the world stage!
➡️All content shared is for educational purposes only. Do your own research or consult your financial advisor before acting on it.

A massive IPO shareholder lock-in has ended, releasing 19.2 million shares worth over ₹1,265 crore into the market from:
➡️NSDL
➡️Sri Lotus Developers
➡️M & B Engineering
#IPOLockin #StockMarket #NSDL #LotusDevelopers #MBEngineering

PEB (Pre-Engineered Building ) Stocks :
👉EPack Prefab
👉Pennar Industries
👉Interarch Building
👉M&B Engineering
Keep a tab on 👆stocks.
#epack #pennar #Interarch #mbengineering

#MarketsWithBS | Why did M&B Engineering share price rise 4% in trade today? Details here 👇
#Stocks #markets #stockmarket #sharemarket #MBEngineering
https://t.co/mUlYmdVmTq

M & B ENGINEERING lands a big export deal!
✅ Secures USD 24.14M order for pre-engineered buildings & structural steel from the USA
✅ Project duration: 39 weeks with 10% advance payment
✅ Strengthens the company’s global footprint
#MBEngineering #ExportNews #StructuralSteel #EngineeringExcellence #InvestorUpdate
✅ M & B Engineering sees Abakkus Growth holding a 2.03% stake in Q2 📊
✅ Bengal Finance & Investment holds a 1.27% stake in the company during Q2 💼
#MBEngineering #Q2Update #Investments #Stakeholding #Abakkus #BengalFinance

M & B Engineering : 407
Today, On 14.10.2025
360 one asset management BOUGHT 5,21,620 shares at ₹404/- per share.
Keep on Radar.
#mbengineering


M&B ENGINEERING LTD wins ₹98 Cr+ domestic order for Pre-Engineered Steel Building
🛠️ Scope: design, engineering, manufacturing, supply & erection
⏳ Project timeline: 6 months; 15% advance payment agreed
#MBEngineering #SteelBuilding #Infrastructure

Pre Engineered Building (PEB) demand is outpacing supply, pushing companies into fresh capex. But a lot is being overlooked.
I deep dived into the supply side, exports, margins, tariffs & capacity wars. Covered these players.
#InterarchBuilding
#MBEngineering
#PennarIndustries
PEBs are being hyped, twisted, and misrepresented. When I get the time, I’ll cut through the nonsense with a no-filter deep dive video. Watch out for it - or don’t, your loss :)
Companies I’ll cover:
#InterarchBuildingSolutions
#PennarIndustries
#MBEngineering

🚨‼️ M&B Engineering Q1FY26 Highlights #MBEL #MBEngineering
🔹 FY26 growth guidance: ≥25% YoY, margins sustainable at 14%, exports driving upside.
🔹 Exports focus: 20% of revenue by FY27; FY26 exports expected 3x FY25, primarily US → EBITDA 25–27% vs domestic 10–12%.
🔹 Gross margins: Domestic PEB 30–32%, ProFlex 32–34%, Exports 40%+.
🔹 Revenue deferred: ₹28.5cr (Q1 dispatch, booked in Q2).
🔹 Order book: ₹843cr | New Q1 wins: ProFlex ₹80cr, Phenix ₹196cr | Pipeline ₹500–600cr
🔹 FY26 new order target: ₹2200cr (~₹100cr/mo)
🔹 US tariffs: 50% absorbed by customers; M&B competitive at $2.5–2.6k/tn vs $3.5–3.6k/tn locally.
🔹 Capex: Sanand +20k tons (Q1FY27), Cheyyar 2nd phase (Q1FY28)
🔹 Working capital: 55 days, expected to normalize H2.
💡 Takeaway: Strong export push, robust order pipeline, margin expansion in sight, and disciplined capex plan.
#MBEL #MBEngineering #Q1FY26 #Earnings #Exports #OrderBook #Margins #Growth #Capex #Steel #Infrastructure #Manufacturing #IndiaGrowth #ExportsStory #Nifty #StocksToBuy #StockMarket


EPS calculations for #mbengineering are simple and well explained in the image below.
Feel free to assign a 40x P/E or any multiple you prefer the model is flexible.
If you have questions or want to discuss assumptions, the comment section is open.
Focus on the thought process, not just the multiples.
Valuation Analysis on M&B Engineering for FY26 - FY27
As you folks have already read about the business and listened to management commentary for the upcoming years, let’s not waste time on repeats.
Instead, let’s directly deep dive into how the numbers look - EPS growth, PAT & approx. return potential.
1. What the FY25 Numbers Say
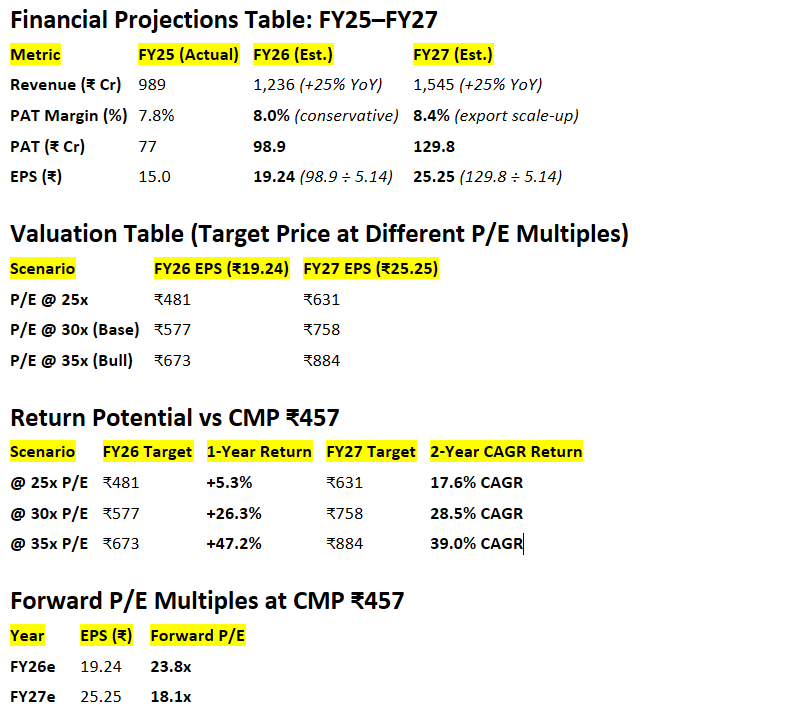
FY25 Revenue: ₹989 Cr | PAT: ₹77 Cr | EPS: ₹15
CMP: ₹457 | Market Cap: ₹2,619 Cr
FY26 & FY27 revenue growth estimated at 25% CAGR
2. Assumptions for Estimates :
PAT margin: 8% (FY26), 8.4% (FY27)
Exports are targeted at 20-22 % of revenue by FY27
Total outstanding shares: 5.14 Cr
FY26 PAT: ₹98.9 Cr → EPS: ₹19.24
FY27 PAT: ₹129.8 Cr → EPS: ₹25.25
Forward P/E: 23.8x (FY26),
Forward P/E : 18.1x (FY27)
Quick notes:
This all depends heavily on execution and how exports ramp up. I’ve been as conservative as possible in my assumptions.
Also, P/E multiples are subjective.
If I’m using 25x or 30x, don’t get hung up on the number - you could assign 100x if you want.
The focus should be on the thought process , not just the final valuation.
#stockmarketindia #EPS @SureshKBN @ujwal_kr @tsatwork @TheAlpha10X @vishan_khadke @soicfinance @sachprat07 @sriranganek @EquityValueIn @vandit_jain1994 @VTGCapital


M&B Engineering
#MBEL
#MBEngineering
Q1FY26 Concall Poiners:
FY26 Guidance:
Conservatively atleast 25% growth over FY25 with better margins
(30% should be doable IMHO looking at execution track record and completion timelines)
Further scope for margin expansion by few bps
14% is sustainable
Exports focus
20% of total revenues from exports targeted for FY27
FY26 should see better margins as exports will inch up higher
FY26 Exports are expected to be 3x the FY25 export revenue
Expects EBITDA margin improvement in FY26 due to a higher export mix and due to new capacities
Exports (primarily the US) lead to significantly higher /better margins, with OPM of 25–27%, compared to domestic margins of 10–11% for the PEB division and 11–12% for the ProFlex(Roofing) division.
Weighted average EBITDA margin is 13–14% which is sustainable
Domestic PEB gross margins are sustainable at 30–32%, ProFlex at 32–34%, and exports at 40% and above
Gross margins for Q1 FY26 were slightly lower than of Q1 FY25, due to a lower export contribution in the quarter (deferred to Q2)
28.5cr revenue which are dispatched, but hasn't been booked
Deferred to Q2FY26 (Exports+Domestic)
Order book of 843cr
Phenix (PEB): 634cr (7-8 months execution)
ProFlex (Roofing): 209cr (4-5 months execution)
Export orders pending: 123cr, primarily for the U.S. market
Should be relaxed in FY26
Q1FY26 new orderwins
ProFlex segment at 80cr
Phenix segment at 196cr
500-600cr pipeline
Both exports and domestic are seeing strong enquiries
Targets a minimum of 2200cr in new orders for FY26, with an average monthly order inflow of 100cr
Export Strategy and Tariffs:
US imposes a 50% tariff on steel products,which is borne by US customers. Despite this, M&B remains competitive, quoting $2500–2600/tn compared to U.S. local manufacturers quote of $3500–3600 per ton
US Margins vs Indian margins:
US Margins are 1.5–2x higher than in India
Emerging markets:
Canada is an emerging market, with three orders already in execution.
Africa is identified as a future growth market with solid potential
Capexplans and utilization:
Current PEB capacity:
72000 tons at Sanand and 32000 tons at Cheyyar.
Cheyyar plant is expected to reach 50–60% utilization in FY26
Sanand: Adding 20000 tons ( to be commissioned by Q1FY27)
Cheyyar: Second phase to be operational by Q1FY28
Working Capital:
WC increased to 55 days in Q1FY26 , due to higher inventory (due to imported raw materials) and extended creditor terms
Expected to normalise in H2

🚀 M & B Engineering Ltd Q1 FY26 Concall Notes #MBEL
✅ Guidance (Conservative):
- 25% topline growth over FY25
- 20% YoY topline growth FY27 onwards
- Targeting 3x exports over FY25, subject to sectorial tariffs (reciprocal tariffs not applicable) (FY27 Exports to be 20% of Revenue Mix)
- EBITDA Margins are sustainable & will increase further with rise in share of exports in coming years
✅ Revenue:
- Q4/H2 revenues are generally higher than Q1/H1 revenues – with average split between H1 & H2 revenues 40:60 (de-growth in Q1 FY26 over Q4 FY25 revenues is not comparable)
- Q1 FY26 revenue is excl. domestic revenue of Rs 12.77 Cr & export revenue of Rs 15.79 Cr, representing dispatches made but not booked as per INDAS revenue recognition principles (to be booked as in Q2)
- Exports realisation will go up, domestic will be maintained
- Sales Quantity Q1: Phenix 14,822 MT & Proflex 3,21,050 SQM
✅ Margins:
👉 Gross Margins:
- Phenix: 32-33%
- Proflex: 33-34%
- Exports: >40%
- Strick RM procurement policies help in maintaining margins
- PEB: RM procured domestically, Proflex: RM imported from one supplier (better credit terms helps in improving WC Cycle)
👉 EBITDA Margins:
- US Margins: 25-27% | India Margins: 10-11% | Prolex: 11-12% (Average: 13-14%)
- Complex jobs command higher margins
- Margins are higher in US
- Currently executing 3 orders from Canada
✅ Order Book:
- Total as of 1st July'25 Rs 843 Cr - Phenix (PEB) Rs 634 Cr & Proflex (Roofing Systems) Rs 209 Cr
- Phenix OB includes export orders of Rs 123 Cr & domestic orders of Rs 510 Cr
- Q1 Order Inflows: Rs 96.8 Cr PEB & Rs 80 Cr Proflex
- Average OB Execution Period: Phenix around 7 to 8 months & Proflex around 4 to 5 months
- Average Order Value: PEB ranges from Rs 5 Cr to 100+ Cr, Proflex ranges from Rs 50 lakhs to 15 Cr
- Exports mainly to North America, few to Canada (Africa to be added in 1-2 years)
✅ Expansion:
- Implementation of the Brownfield PEB expansion project at Sanand involving (additional PEB capacity of 20,000 TPA commenced & expected to be commissioned in Q1 FY27)
- Cheyyar Expansion: Another 20,000 MTPA capacity will be added in Cheyyar Facility, this should get completed by Q1 FY28
- Also, in process of evaluating available options for increasing Proflex capacity by procuring additional mobile plants in FY26
✅ Capex:
- Capex incurred in Q1 FY26 Rs 6.27 Cr
- Balance Capex planned to be incurred in FY26 is estimated at Rs 45 Cr
- Additional Rs 25-30 Cr Capex planned (excluding IPO)
✅ Utilisation:
- Post full Capacity Expansion: 75-78%
- Targeting Incremental Revenues: 4x of Capex
- Sanand optimum capacity to be reached this year
- Targeting 60-70% Utilisation for Cheyyar (FY26)
⭐️ Overall good call & good management clarity

@nid_rockz Detailed Concall Notes from today's Q1 FY26 Concall
#MBEL #mbengineering
https://t.co/9qNbUsOBYD
🚀 M & B Engineering Ltd Q1 FY26 Concall Notes #MBEL
✅ Guidance (Conservative):
- 25% topline growth over FY25
- 20% YoY topline growth FY27 onwards
- Targeting 3x exports over FY25, subject to sectorial tariffs (reciprocal tariffs not applicable) (FY27 Exports to be 20% of Revenue Mix)
- EBITDA Margins are sustainable & will increase further with rise in share of exports in coming years
✅ Revenue:
- Q4/H2 revenues are generally higher than Q1/H1 revenues – with average split between H1 & H2 revenues 40:60 (de-growth in Q1 FY26 over Q4 FY25 revenues is not comparable)
- Q1 FY26 revenue is excl. domestic revenue of Rs 12.77 Cr & export revenue of Rs 15.79 Cr, representing dispatches made but not booked as per INDAS revenue recognition principles (to be booked as in Q2)
- Exports realisation will go up, domestic will be maintained
- Sales Quantity Q1: Phenix 14,822 MT & Proflex 3,21,050 SQM
✅ Margins:
👉 Gross Margins:
- Phenix: 32-33%
- Proflex: 33-34%
- Exports: >40%
- Strick RM procurement policies help in maintaining margins
- PEB: RM procured domestically, Proflex: RM imported from one supplier (better credit terms helps in improving WC Cycle)
👉 EBITDA Margins:
- US Margins: 25-27% | India Margins: 10-11% | Prolex: 11-12% (Average: 13-14%)
- Complex jobs command higher margins
- Margins are higher in US
- Currently executing 3 orders from Canada
✅ Order Book:
- Total as of 1st July'25 Rs 843 Cr - Phenix (PEB) Rs 634 Cr & Proflex (Roofing Systems) Rs 209 Cr
- Phenix OB includes export orders of Rs 123 Cr & domestic orders of Rs 510 Cr
- Q1 Order Inflows: Rs 96.8 Cr PEB & Rs 80 Cr Proflex
- Average OB Execution Period: Phenix around 7 to 8 months & Proflex around 4 to 5 months
- Average Order Value: PEB ranges from Rs 5 Cr to 100+ Cr, Proflex ranges from Rs 50 lakhs to 15 Cr
- Exports mainly to North America, few to Canada (Africa to be added in 1-2 years)
✅ Expansion:
- Implementation of the Brownfield PEB expansion project at Sanand involving (additional PEB capacity of 20,000 TPA commenced & expected to be commissioned in Q1 FY27)
- Cheyyar Expansion: Another 20,000 MTPA capacity will be added in Cheyyar Facility, this should get completed by Q1 FY28
- Also, in process of evaluating available options for increasing Proflex capacity by procuring additional mobile plants in FY26
✅ Capex:
- Capex incurred in Q1 FY26 Rs 6.27 Cr
- Balance Capex planned to be incurred in FY26 is estimated at Rs 45 Cr
- Additional Rs 25-30 Cr Capex planned (excluding IPO)
✅ Utilisation:
- Post full Capacity Expansion: 75-78%
- Targeting Incremental Revenues: 4x of Capex
- Sanand optimum capacity to be reached this year
- Targeting 60-70% Utilisation for Cheyyar (FY26)
⭐️ Overall good call & good management clarity

#MBEL #MBEngineering
M&B EngineeringQ1 FY26 Concall Highlights:
👉FY 2026 & Future Outlook :
▫️ Revenue growth is projected to be near ~25%, with FY26 expected to be more aggressive due to capacity expansions and export growth
💠Exports are expected to be 3x the FY25 export revenue in FY26
💠Long-term goal is for exports to contribute at least 20% of the top line by FY27
💠Claims to adopt a conservative guidance approach due to global volatility and uncertainties in trade policies
▫️Expects EBITDA margin improvement in FY26 due to a higher export mix and due to new capacities
💠Exports (primarily the U.S.) yield significantly higher margins, with EBITDA margins of 25–27%, compared to domestic margins of 10–11% for the PEB division and 11–12% for the ProFlex division. Weighted average EBITDA margin is 13–14%
💠Domestic PEB gross margins are sustainable at 30–32%, ProFlex at 32–34%, and exports at 40% and above
💠Gross margins for Q1 FY26 were slightly lower than of Q1 FY25, due to a lower export contribution in the quarter (3cr booked, with 15cr in transit)
👉Current order book and pipeline:
▫️Order book: 843cr
💠Phenix (PEB): 634cr (7-8 months execution)
💠ProFlex (Roofing): 209cr (4-5 months execution)
▫️Export orders pending: 123cr, primarily for the U.S. market
▫️Q1 New Orders/Projects:
💠ProFlex: 80cr
💠Phenix: 196cr
💠Clients include Vishakha Glass (solar glass manufacturing plant), Adani Group, and Japanese EPC contractors for industrial units
💠Indian Railways projects, including Vande Bharat train depot sheds and Road Under Bridges (RUBs), with an outstanding order value of 35cr for ProFlex (mix of Vande Bharat and platform projects)
▫️Pipeline:
💠Estimates a pipeline of 500cr plus, including both domestic and export orders. Export pipeline specifically includes $20–25 million in potential orders
💠Win / hit ratio for bids is 12–15% for domestic projects, while U.S. orders involve focused negotiations rather than a standard hit ratio
💠Targets a minimum of ~2200cr in new orders for FY26, with an average monthly order inflow of 100cr across:
▫️Indian Railways : Conversion of ~20,000 level crossings into RUBs, Vande Bharat depot sheds;
▫️Agri-warehousing: Government mandates for Primary Agricultural Credit Societies to use ProFlex roofing
▫️Export Markets: Expansion in the U.S. (East Coast presence with general contractors), Canada (post-certification), and plans to enter Africa
👉 Others :
▫️Export Strategy and Tariffs:
💠U.S. imposes a 50% sectoral tariff on steel products (increased from 25% in Jun'25), which is borne by U.S. customers. Despite this, M&B remains competitive, quoting $2,500–2,600 per ton compared to U.S. local manufacturers’ $3,500–3,600 per ton
💠U.S. operations focus on manufacturing and supply, with installation handled by general contractors. Margins in the U.S. are 1.5–2x higher than in India
💠Canada is an emerging market, with three orders already in execution. Building a sales and marketing infrastructure in Canada post-CWB certification
💠Africa is identified as a future growth market
▫️Capacity Expansion:
💠Current PEB capacity: 72,000 tons at Sanand and 32,000 tons at Cheyyar. Cheyyar plant is expected to reach 50–60% utilization in FY26
💠Expansion plans: Sanand: Adding 20,000 tons (operational by Jun'26)
💠Cheyyar: Second phase to be operational by Jun'27
💠ProFlex: Adding equipment in Q4 FY26 and further in FY27 to meet demand
▫️Total CapEx: 130cr + 25–30cr from internal accruals
💠Optimal capacity utilization is 75–78% due to the complex nature of PEB projects and the mobility of ProFlex plants (14 mobile plants, each with a max capacity of 100,000 sqm/year)
▫️Working Capital:
💠Working capital cycle increased to 55 days in Q1 FY26 , driven by higher inventory (due to imported raw materials) and extended creditor terms
💠ProFlex raw material (PPGS Steel) is imported from a Korean supplier with $10 million annual open credit. PEB raw materials are sourced domestically from JSW, ArcelorMittal, and others, with 30–35 days credit extended to 180–270 days via buyers’ credit
💠Nearly debt-free after repaying ~60cr of loans post-IPO
💠Working capital turnover is 5–6x, and maintains a conservative approach to protect margins by securing raw materials early
▫️ Certifications and Market Advantage:
💠Sanand facility is the only PEB facility in India with AISC certification. Also recently received Canadian Welding Bureau certification, mandatory for the Canadian market
💠These provide a competitive edge, also early mover advantage in the U.S. market (since 2017) and established relationships strengthen its position
💠In-house erection teams for PEB projects, unlike competitors who outsource, enhancing margins
M&B Engineering
#MBEL
#MBEngineering
Inv PPT:
Highest ever Q1
Solid YoY uptick across revenue, EBITDA, PBT and PAT
69% revenue growth
107% EBITDA growth
132% PBT and PAT growth
Q4 is the strongest quarter
H2 forms 60% of revenue
H1 has 40% contribution
Q1FY26 domestic rev of 12.77cr and exports revenue of 15.79cr representing dispatches made,but not booked as revenue yet
Implies:
28.5cr rev are deferred to Q2FY26
Orderbook at 843cr
Phoenix(PEB) at 634cr
Proflex(Roofing Systems) at 209cr
123cr exports order
Capex:
Brownfield PEB Expansion
20,000 TPA , Sanand
Q1FY27 commisioning
Plans to increase Proflex capacity this year


Tomorrow #MBEngineering 's declaring result. #Interarch is right that these margins look fishy as they went from 6 to 13 just for IPO.
Tomorrow MB will sustain these margins to provide exit to anchors/pre-ipo. Next quarter they will be back to 8-9% levels..magically w/o warning

Interarch Building Products calls themselves as Mercedes of P&B Industry;
Says M&B has done some "wonders" to get 13% margins (Interarch operates at 9%)
"I do not know how anybody is making more than us because nobody gets an order higher than us. If anybody does, it 1s only Kirby. But we have never got an order at a lower price than anybody else. People have to beat us in price by a great margin to get the order that they get. So, I do not know, maybe M&B Engineering has done some wonders to get 13%."


Last Seen Hashtags on Sotwe
pijatBogor
Seen from Indonesia
killarney
Seen from United States
CockTsAnalFucks
Seen from Saudi Arabia
GROWwithLiijop
Seen from United States
BBC nut
Seen from United States
Shagorpass
Seen from United States
nolimit()****filter:native_video
reazioneacatena
Seen from Italy
arab boobs
Seen from France
notcircumcised
Seen from Malaysia
Trends for you
Most Popular Users

Elon Musk 
@elonmusk
240.2M followers

Barack Obama
@barackobama
119.3M followers

Donald J. Trump
@realdonaldtrump
111.6M followers

Cristiano Ronaldo
@cristiano
109.4M followers

Narendra Modi
@narendramodi
106.9M followers

Rihanna
@rihanna
97.4M followers

NASA
@nasa
92.1M followers

Justin Bieber
@justinbieber
90.7M followers

KATY PERRY
@katyperry
87.1M followers

Taylor Swift
@taylorswift13
80.9M followers

Lady Gaga
@ladygaga
72.4M followers

Kim Kardashian
@kimkardashian
69.5M followers

Virat Kohli
@imvkohli
68.9M followers

YouTube
@youtube
68.6M followers

Bill Gates
@billgates
63.5M followers

The Ellen Show
@theellenshow
62.5M followers

CNN
@cnn
61.9M followers

Neymar Jr
@neymarjr
61.6M followers

X
@x
60.9M followers

Selena Gomez
@selenagomez
60.2M followers