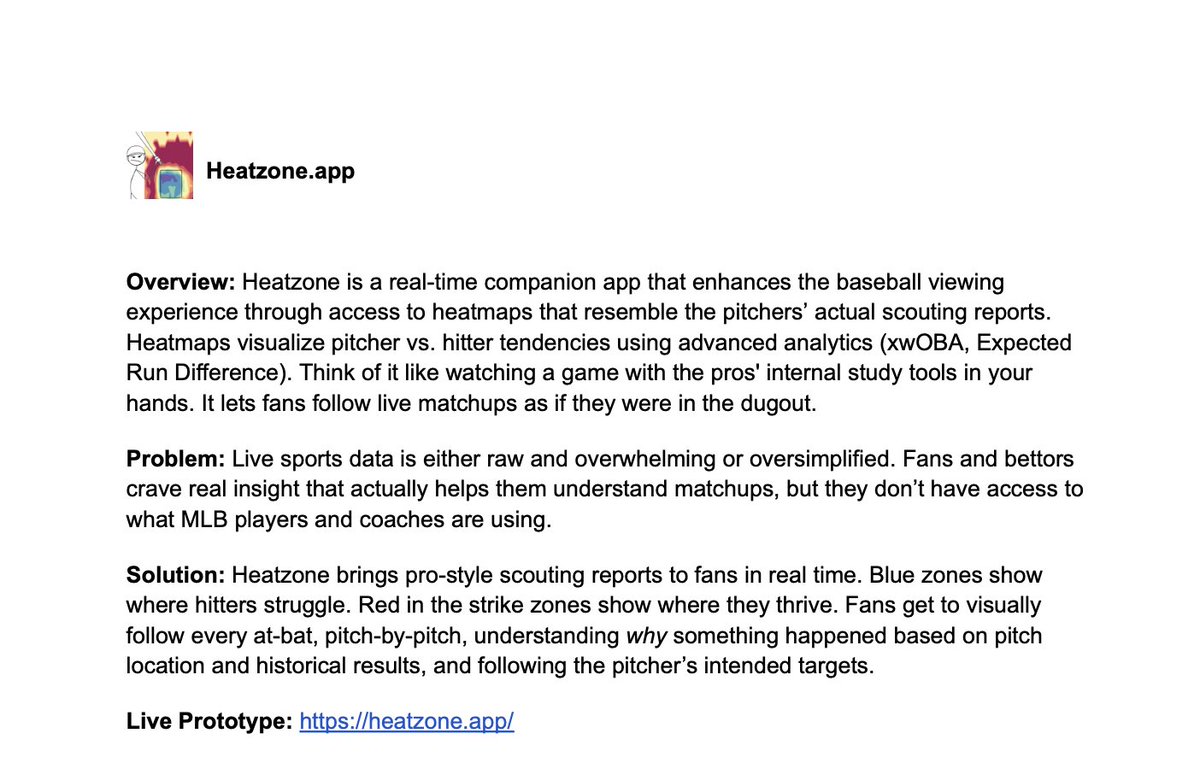
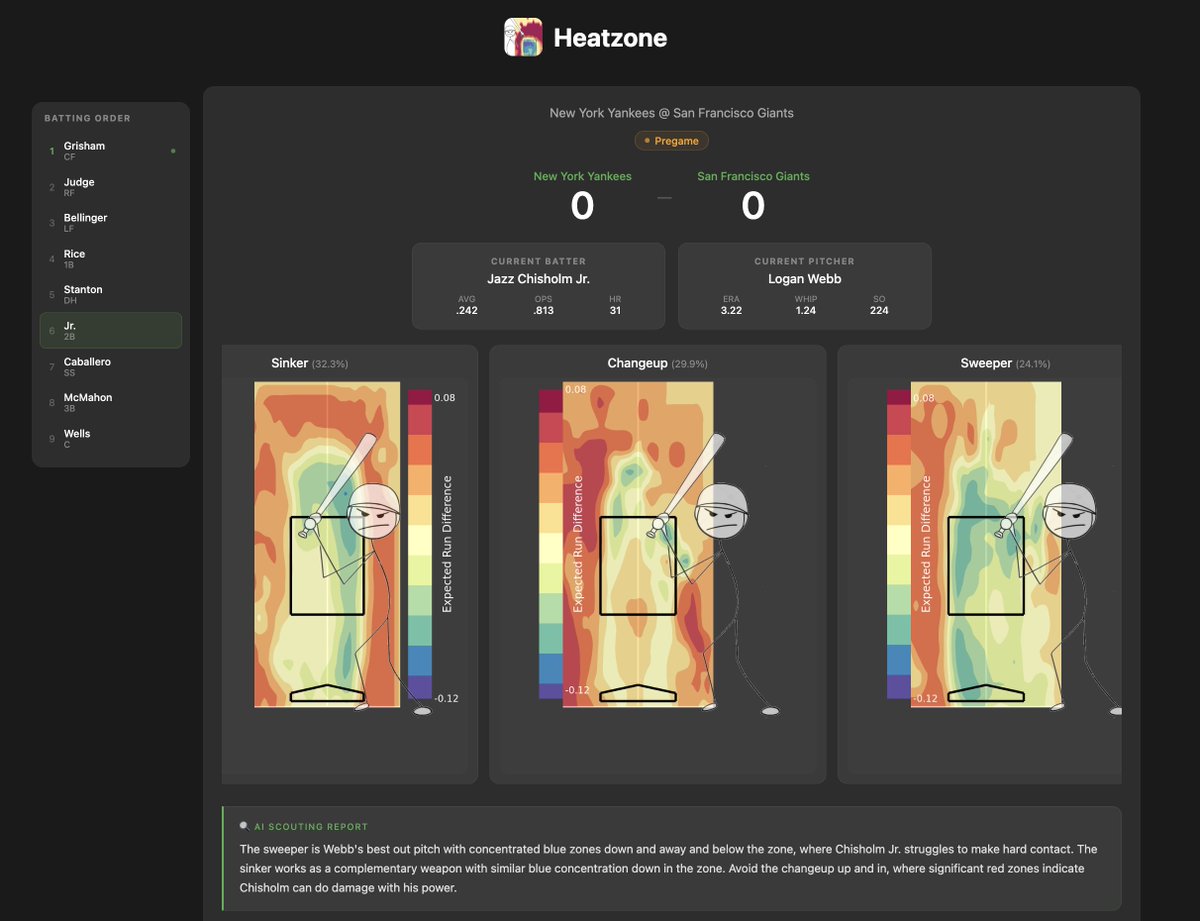
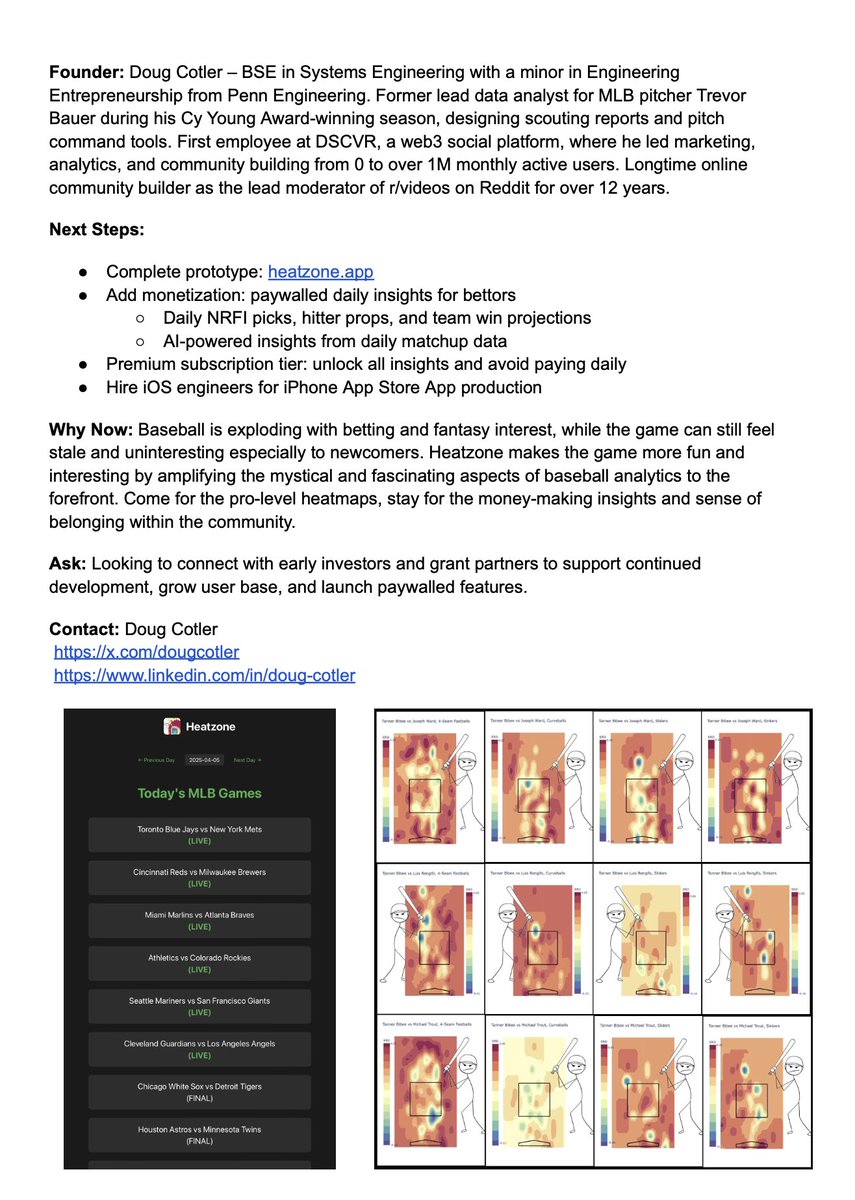
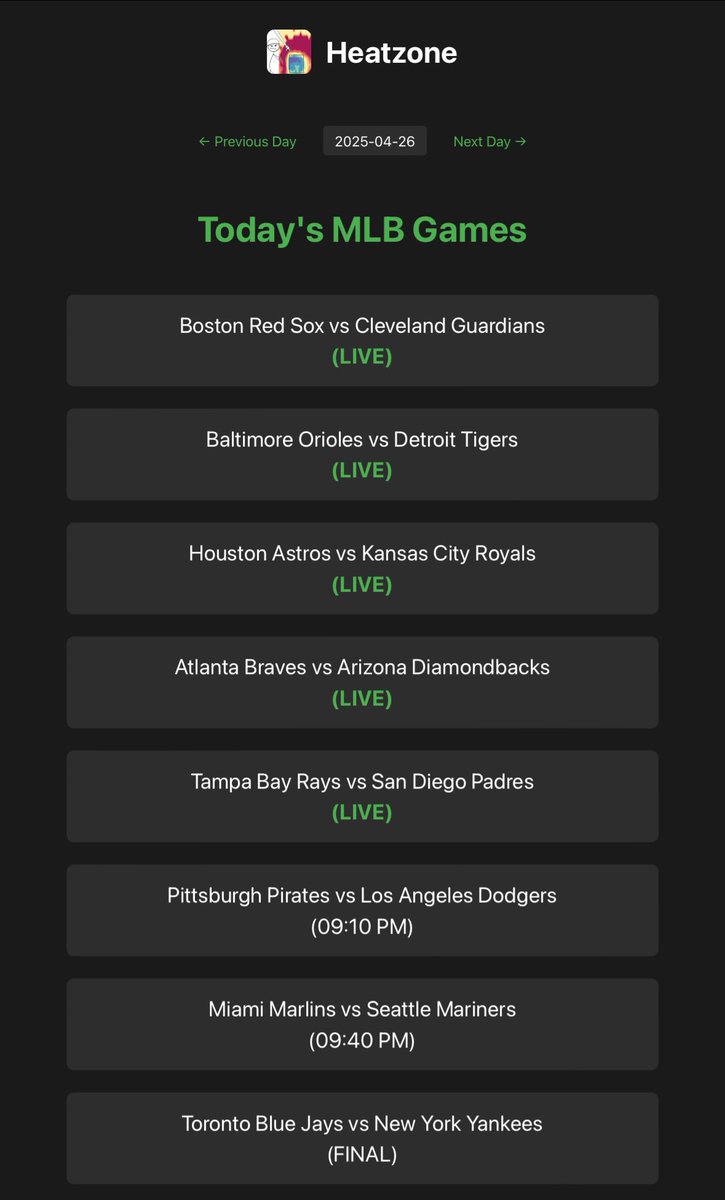
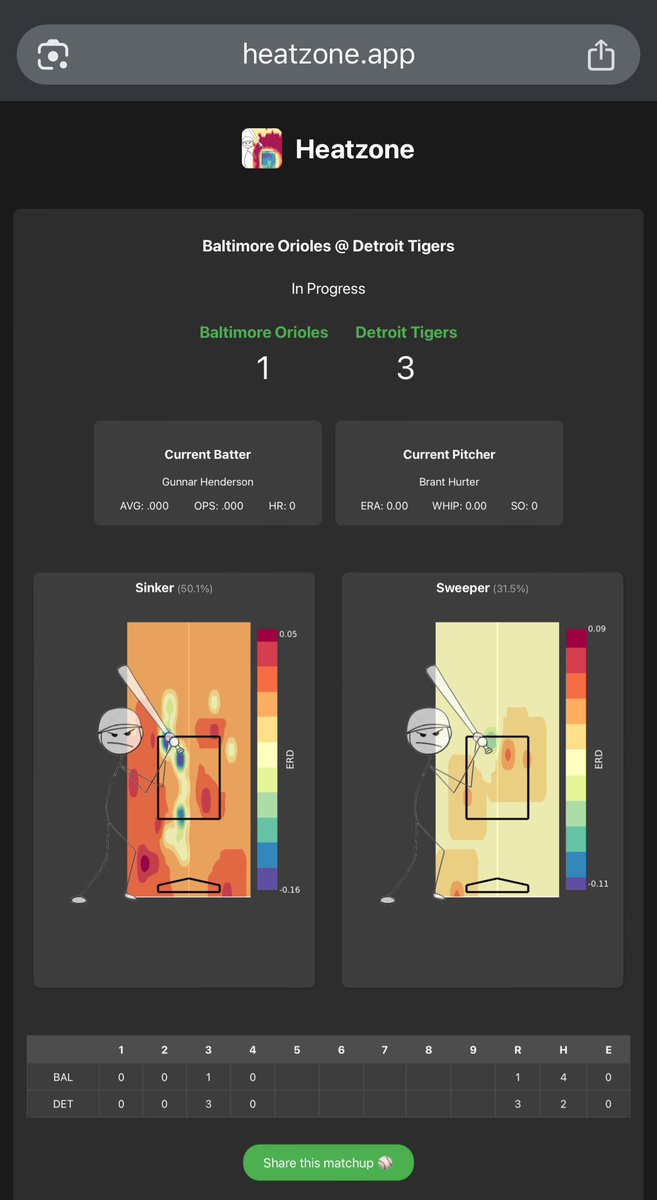
a place where you can select the baseball game you're watching and see the scouting report heatmaps (most effective pitch locations) for each at bat as they happen
I used to design scouting reports for the pros and it was always really fun to follow along while watching the game
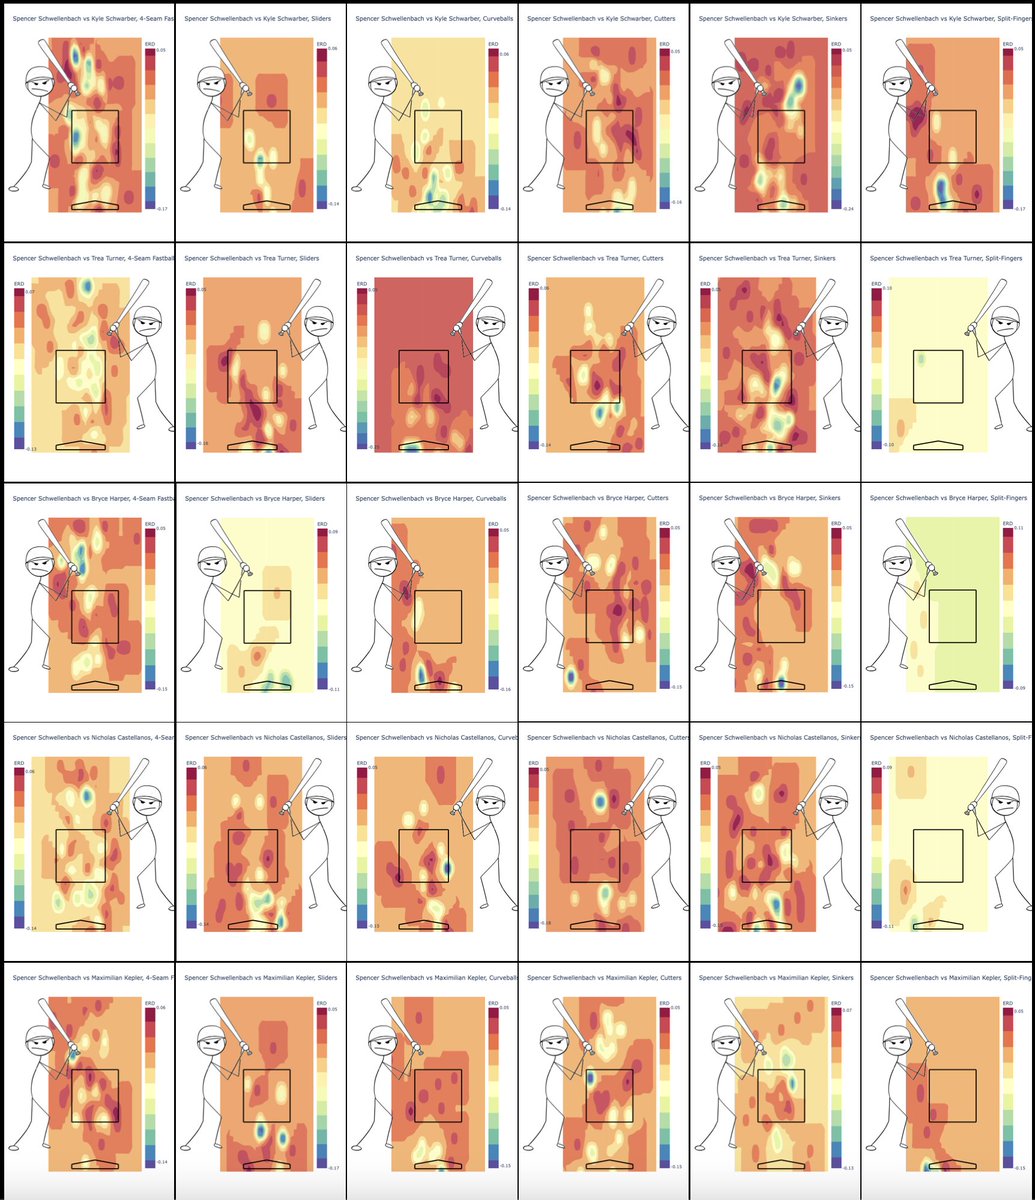
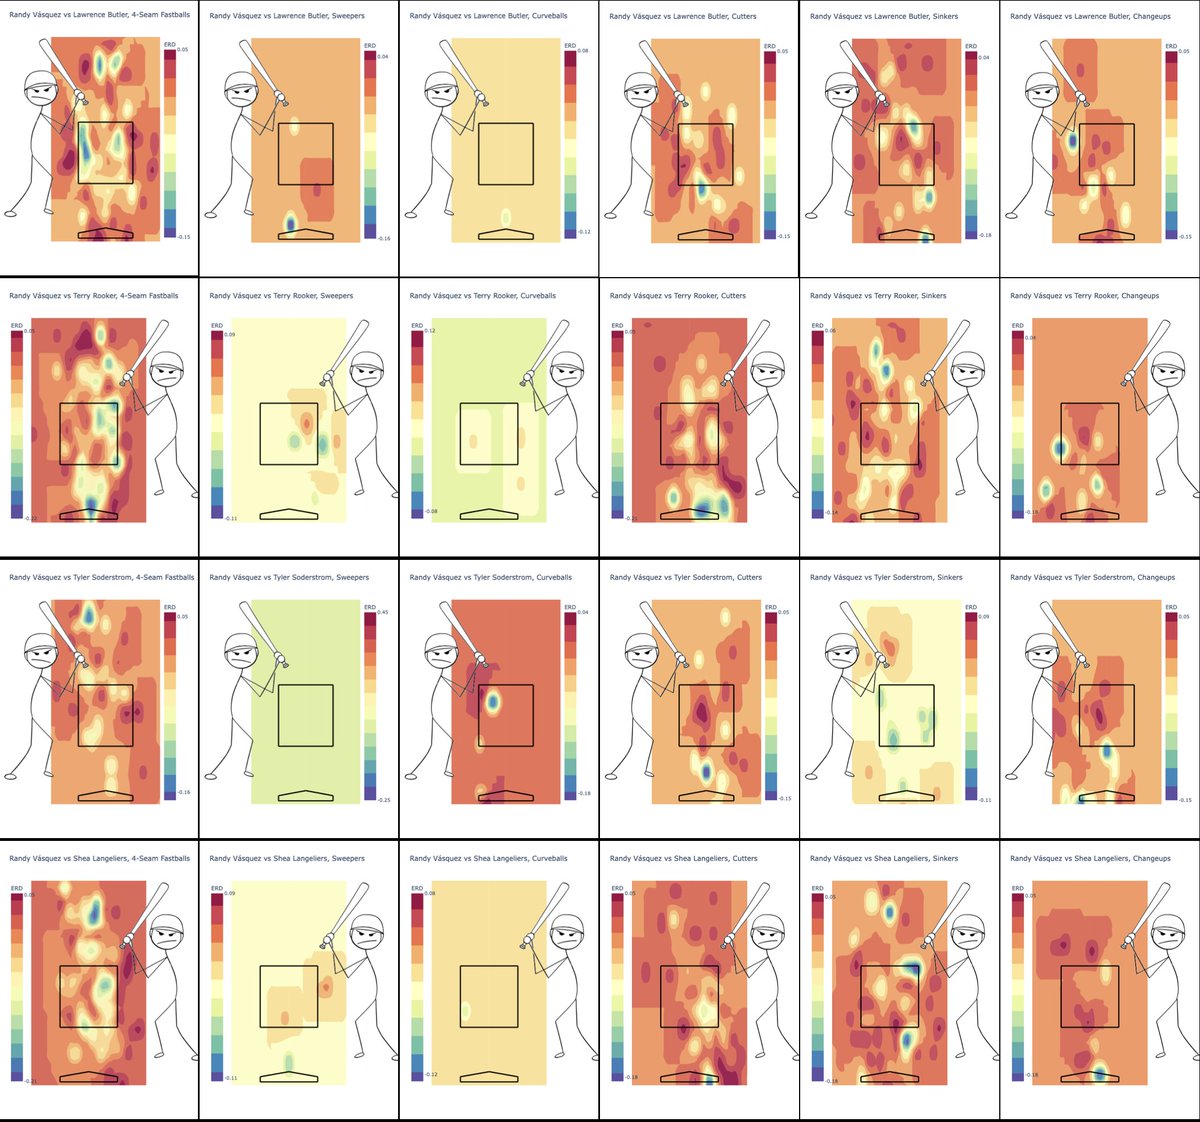
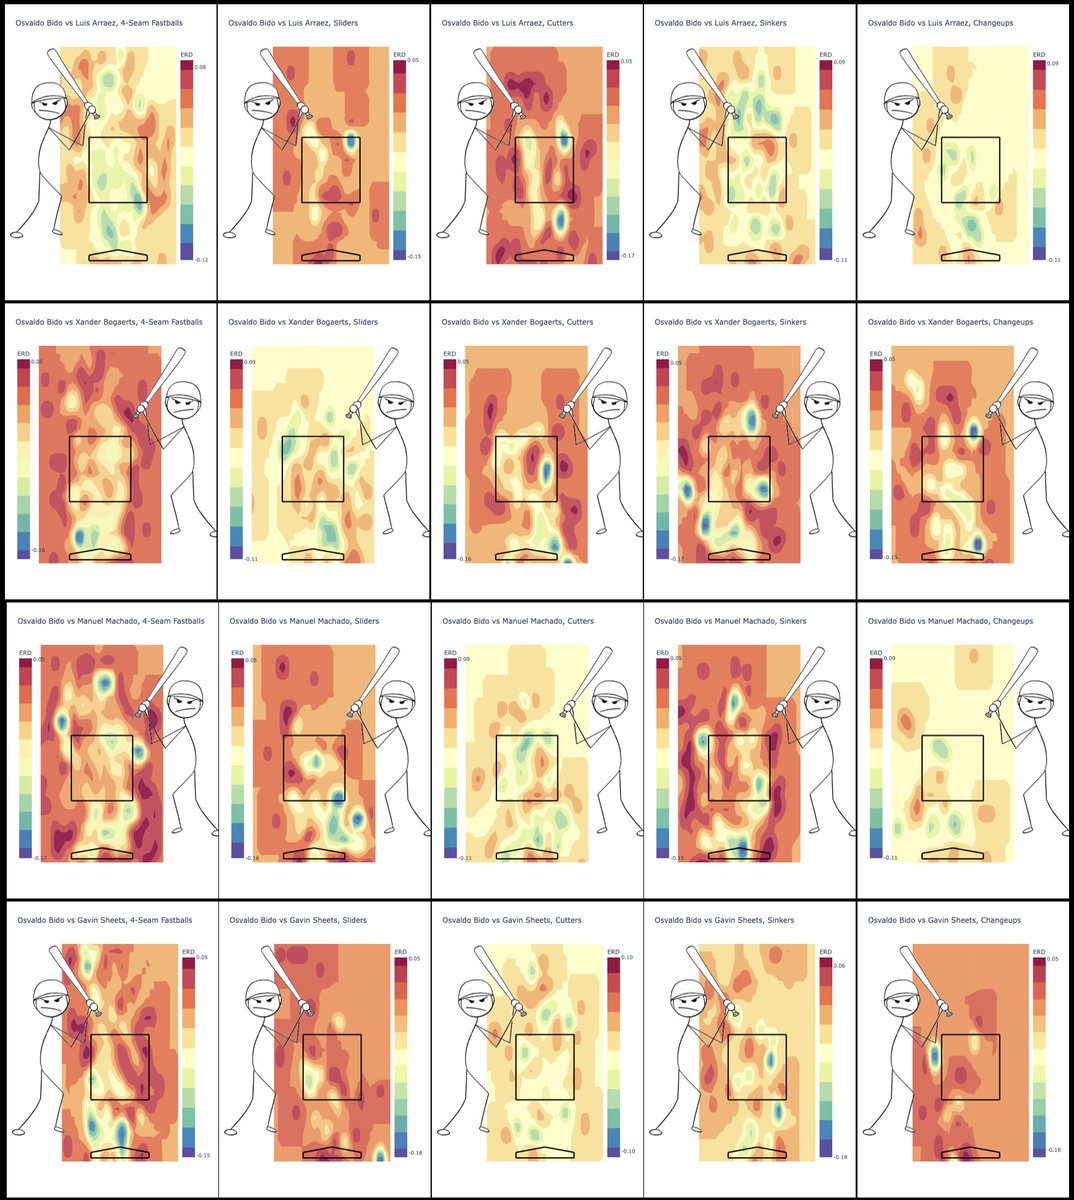
that’s why I’m making @heatzoneapp. every pitcher’s arsenal and hitter’s historical data vs similar pitches are so uniquely their own, that the heatmaps are likely very similar to what the pros are actually studying, based on THE ultimate stat, xwoba
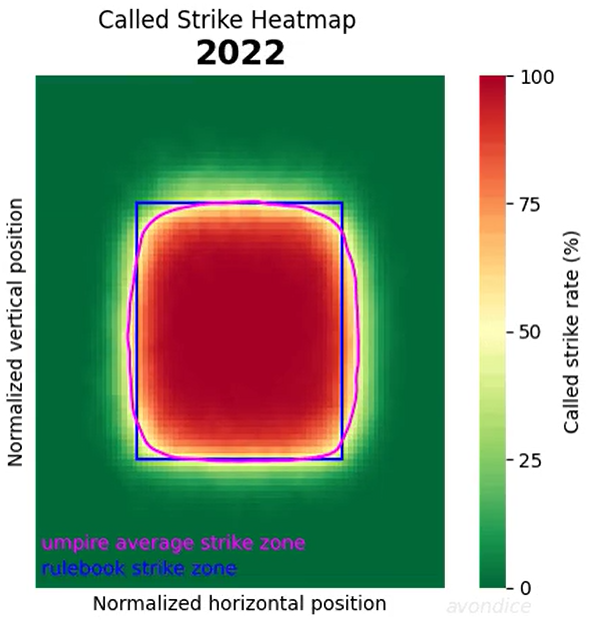
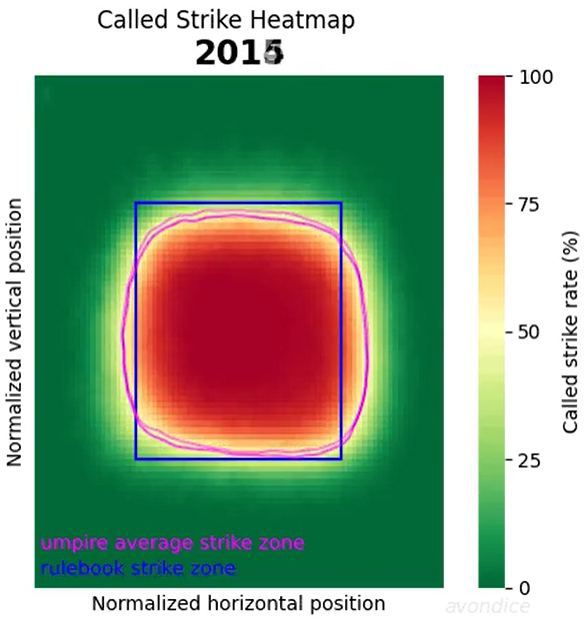
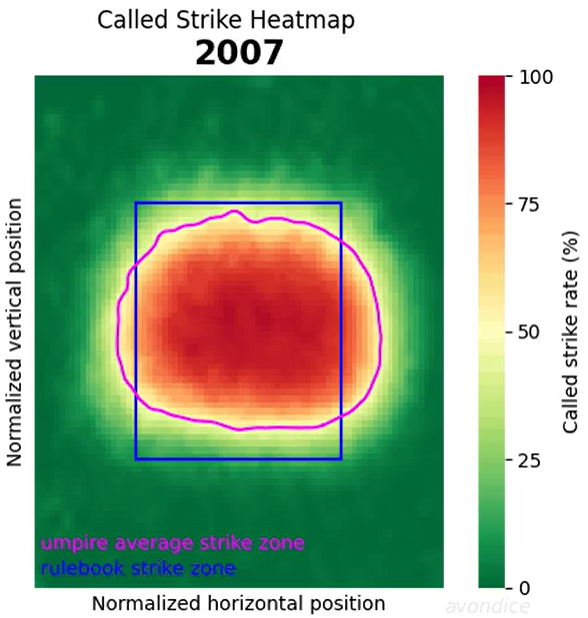
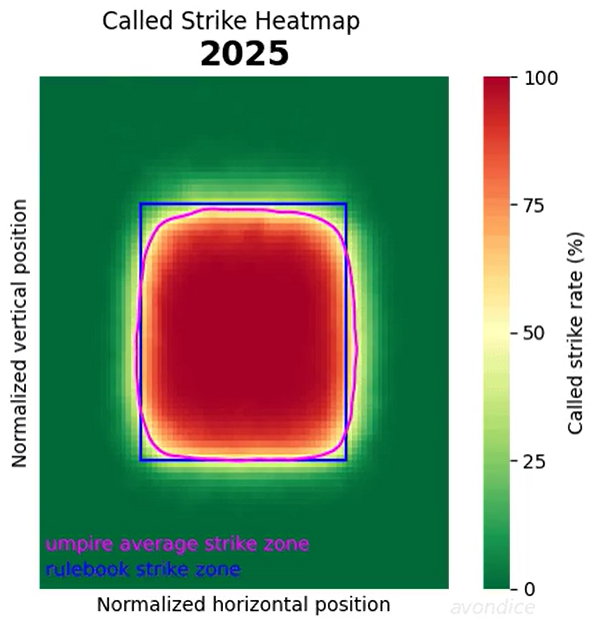
One of the coolest visualizations I've ever seen-- the evolution of the MLB strike zone from 2007 to 2025.
The zone has changed dramatically-- going from vibes to nearly matching the rulebook definition perfectly.
They're remarkably good.
https://t.co/TKy6Vcteyp
I'm the first fan I made this for and I am loving it, trying to see if others share the same fun I have in following the pitchers' targets and seeing how the AB results often are consistent with the data. Let me know what you think ⚾️
https://t.co/ZkebqUdhFA
Watching baseball? Try @heatzoneapp 🔥
Real-time pitcher scouting reports built for live MLB games ⚾️
See the best attack zones for this exact pitcher vs this exact hitter
Reply with your favorite baseball player of all time👇
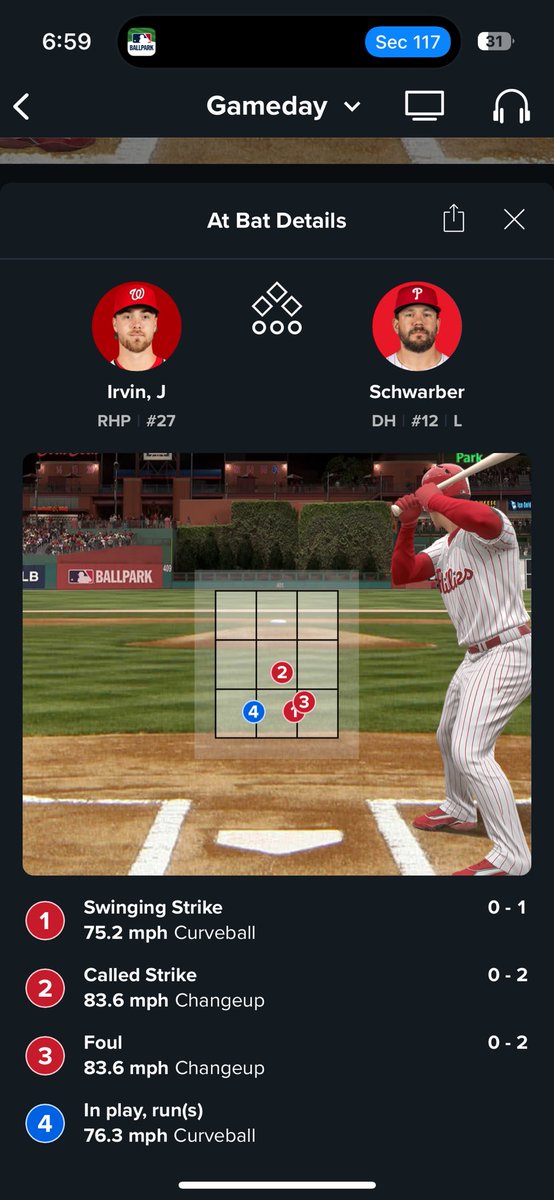
@JesusL65@spencerschwell@heatzoneapp Phillies lineup is out!
blue is where the hitter cant hit the pitch based on past similar pitches
red in the zone is where the hitter can hit the pitch. based on xwoba or ERD, expected run difference from before the pitch to after the pitch
play ball!⚾️