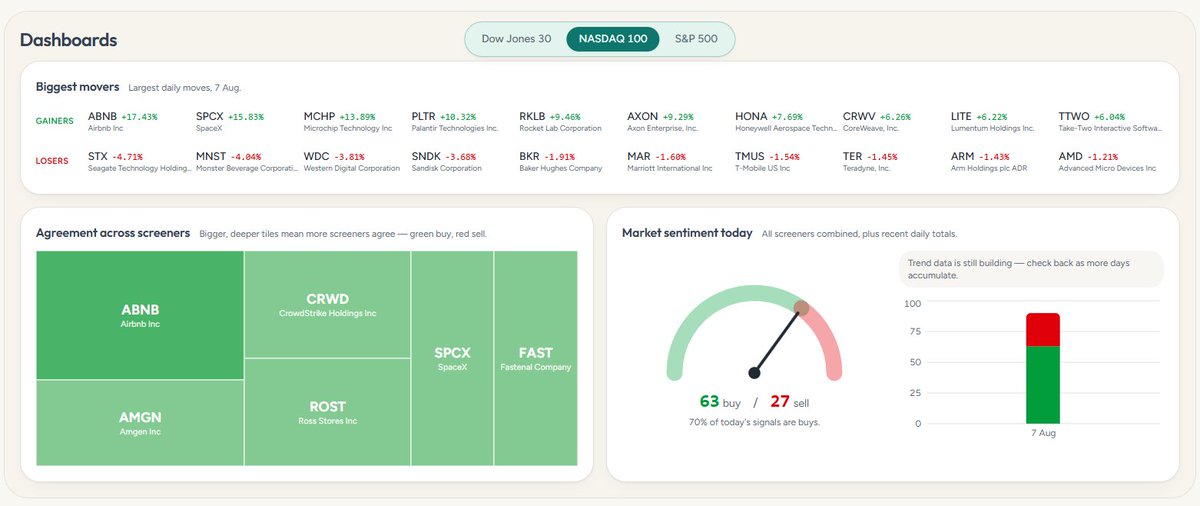
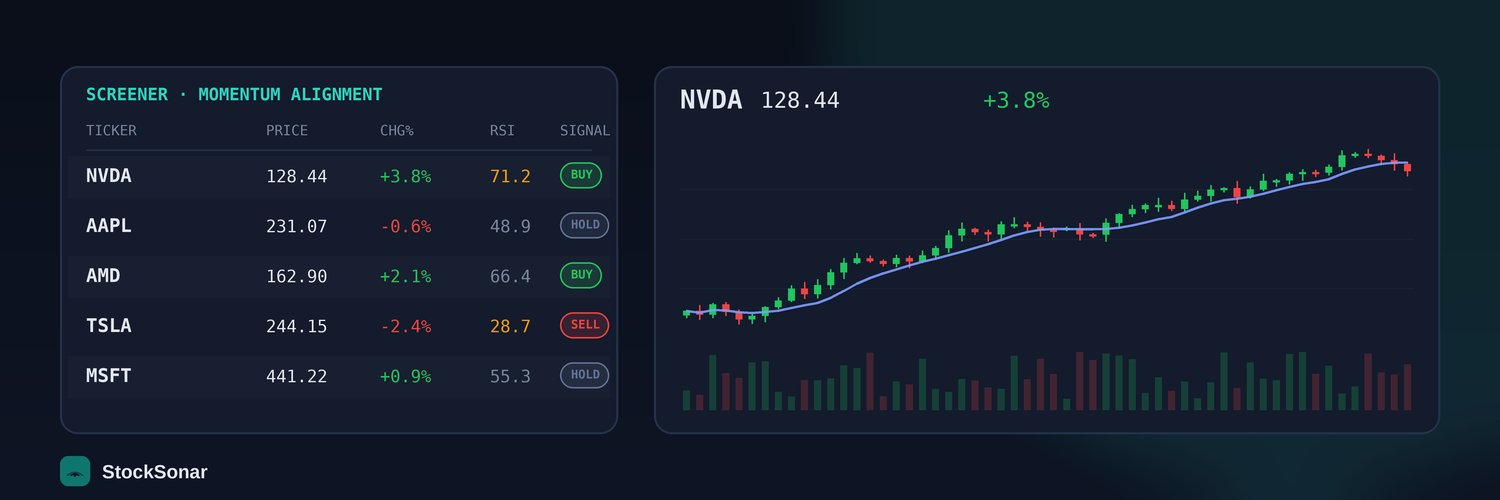
Trying to earn back my $100/mo data plan through my own screener trades. Building StockSonar along the way. Solo, no-code, @Lovable. Not financial advice.
New challenge: just upgraded to EODHD's top data plan — $99.99/month for fundamental + real-time data.
Goal: build screeners with it that earn that back, ideally more than once, through real decisions I actually make.
Documenting it here, wins and losses both.
@StockMKTNewz Private credit keeps showing up as the real financier of the AI buildout. Curious whether $APO is lending against the data center itself or against the tenant contracts, because that's what decides how this ages if GPU demand cools.
The story moved faster than the chart so far. $GOOG flipped to a momentum sell on my screener at 10:00 ET, and the 50-day is only ~1% above the 200-day, so the golden cross from May is close to rolling over. Still ~16% under the 52-week high. What gets price to agree with the narrative, the public release? Just watching.
Short term it's leaning your way today: $INTC turned into a momentum sell on my screener at 10:00 ET (MACD, stochastic and 10-day WMA all pointing down). Zoomed out it's a different story: golden cross since May, 50-day ~24% above the 200-day, +130% in six months. Does the flip-flop still hold when the trend is this strong? Just watching.
For what it's worth, $RKLB flipped to a momentum buy on my screener at 10:15 ET, volume running ~2.5x normal so far. Bigger trend is still a death cross since late Aug though (50-day ~14% under the 200-day). Does a 20-launch Electron deal change that, or is it all rates right now? Just watching.
$NKE reports after the close today. Disclosure up front: I've held a $NKE put since mid-August, so I'm biased.
The number I'm watching isn't revenue, it's the dividend. ~4.5% yield, 23 straight years of raises, but last fiscal year's payout ($2.41B) was bigger than free cash flow ($2.18B). Meanwhile the stock is down ~50% over a year, death cross since May.
If FCF doesn't cover it again, does the streak make it to year 24?
Timely post. $PLTR and $AMD both flipped to short-term momentum sells on my screener at the open today, while the bigger trends are still up ($AMD's 50-day sits ~37% above its 200-day, $PLTR has a golden cross since Sept 9). That's exactly the spot where borrowed conviction tends to bail. How do you size so a momentum wobble never forces a decision on the core thesis? (No position in either.)
Cold starts are the quiet tax on inference, so 25 min down to ~25s is a real lever if it holds outside benchmarks. Chart side: $NBIS flipped to a momentum buy on my screener right at the open today, golden cross intact since May, but still ~20% under the $300 high. Do you read this as a margin story or more of a lock-in play? Just watching, no position.
Funny detail: going into this print $ACN was sitting on my Magic Formula value list (since Aug 31) at under 15x earnings, with a death cross since early August. Today basically re-rates it in one session, and it's still ~20% below the 52-week high. Real turn, or does the 200-day just catch up? Just watching, no position.
@StockMKTNewz 13 of 16 red at the same time usually isn't 13 separate bad calls, it's one factor bet in disguise. $ZTS down 10% is doing a lot of the damage on that screen. Does the arena show sector exposure anywhere? That would tell me more than the win rate.
Disclosure: I've held a $NKE put since mid-August, so I'm biased. What I'm watching isn't the top line, it's the dividend. ~4.5% yield and 23 straight years of raises, but last fiscal year's payout ($2.41B) was bigger than free cash flow ($2.18B). Death cross on my screener since November. Does the streak make it to 24?
The print backs the raises: $54.2B revenue, 86.8% gross margin, Q1 guided to ~$61.5B. One detail I keep looking at: the margin guide (~86%) is a hair below this quarter. My screener still has $MU in a golden cross since late June, 50-day ~42% above the 200-day. Just watching. Does $2,100 assume these margins are the new floor?
@DeItaone The headline just flipped $SNPS to a momentum buy on my screener (14:25 ET). Bigger picture is still healing: death cross since late July (50-day ~10% under the 200-day), ~18% below the $539 high. Just watching. Real revenue driver for EDA, or mostly sentiment?
@CKCapitalxx Update to keep myself honest: that $AMZN momentum buy didn't survive the afternoon. It flipped back to a sell at 14:20 ET. The bigger trend (golden cross since Aug) hasn't changed, but it's a good reminder why I don't act on one intraday flip.
The price side is starting to agree: my screener flipped $AMZN to a momentum buy at 10:50 ET today, and the golden cross from early August is intact (50-day ~6% above the 200-day). Yet only ~+14% over a year. Just watching. What re-rates it first: capex peaking or that backlog converting?
@Mr_Derivatives Fwiw my momentum screener caught that bounce and then lost it: $AMZN flipped to a buy at 10:50 ET and back to a sell at 14:20 ET. Golden cross since early Aug is still intact though. Do you need a daily close over the orange line, or is an intraday break enough?
@unusual_whales My insider screener has flagged $GME as a buy since Sept 8 (4 insiders, ~$48.5M, before this one). Price is less clear: momentum flipped to buy this morning, RSI ~71, and it's still in a death cross since June. Just watching. Does buying this size beat the trend for you?
Not totally out of nowhere on my screener: $HIMS flipped to a momentum buy at 9:55 ET this morning and has been in a golden cross since late July (50-day ~7% over the 200-day). Still ~53% below its $65 high though. Just watching. What gets it through $40 first, flows or its own news?
@The_RockTrading Fun stat. One thing I'd compare: my screener has $TSLA in a death cross since April (50-day ~12% under the 200-day), momentum flipped to sell Monday, and it's down ~8% on the week. Was it this washed out going into the June $MU print too, or is this a weaker setup?
@insiderwave Zooming out on $MP: even after today's pop it's ~52% below its $100 52-week high, and my screener has it in a death cross since early July (50-day ~10% under the 200-day). Just watching. Does a headline bounce like this stick without an earnings catalyst?
@KobeissiLetter Where it shows up on my screener: REITs $AAT and $CTRE both flipped to momentum sells this morning. $AAT is the odd one, its chair bought ~$2.2M of stock in August and it yields ~6.3%. Just watching, no position. With the 30Y at 5.64%, is a 6% REIT yield still worth the risk?
@StockOptionCole My screener has had $MSFT on a momentum buy since last Friday, golden cross since late August. Odd part: up ~39% in 6 months but basically flat over a full year, still ~6% under the 52-week high near $549. Just watching. Retest of that high, or a clean break?