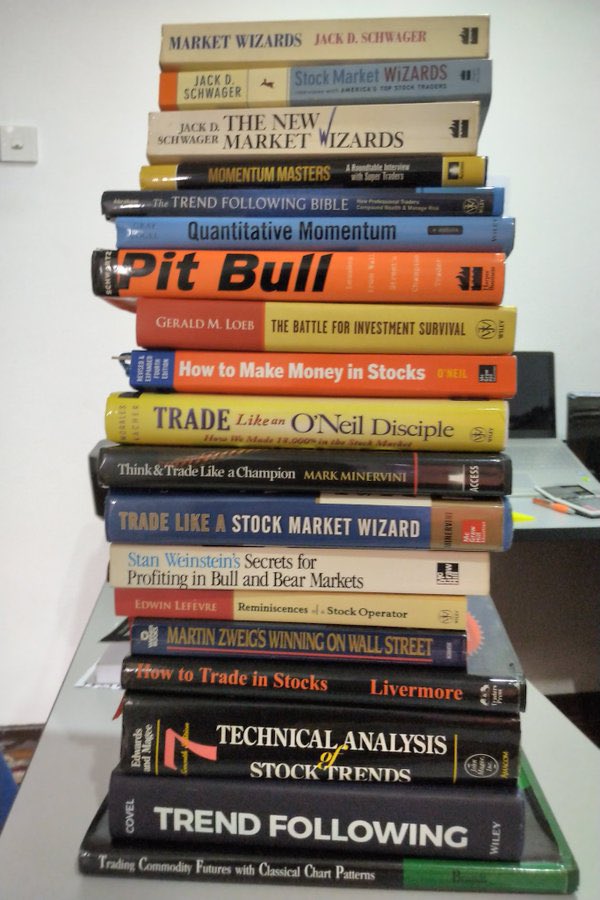
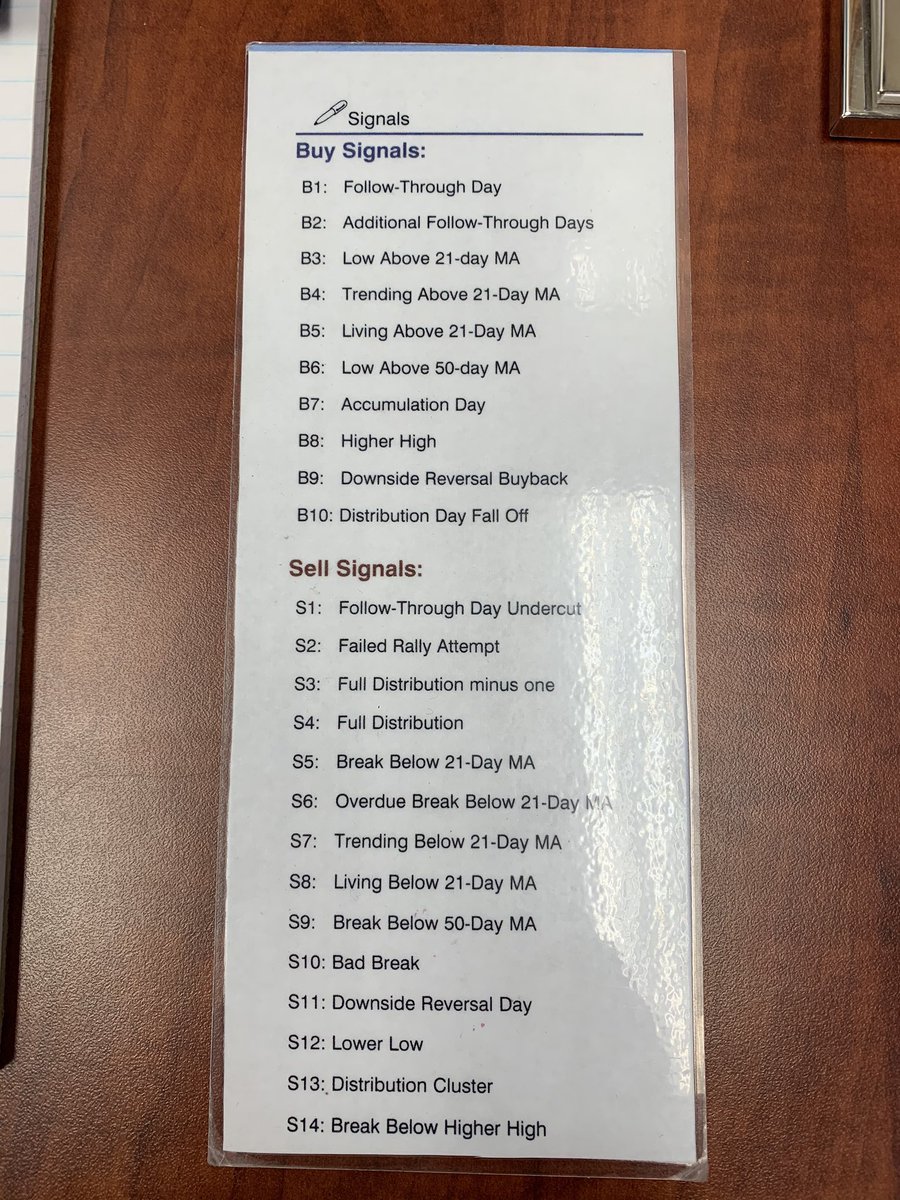
I strongly recommend you.
To do some research. Find the alts worth to accumulate. Learn about the price action. Read books on trading.
Learning never stops.
Even if it feels boring to look at the charts now.
I guarantee you.
If you show up each day.
Next few months.
You will become a much better trader.
Kemarin kan udah disuruh beli rumah sm pak ET, nah biar gak salah dan gak kena tipu penjual/developer nakal kalian udah pernah cobain app Sentuh Tanahku belom gaes?
Ok sini saya jelasin dikit.
A thread.
Dlm bisnis, utang dan tagihan itu ga bs disepelekan, krn cashflow bisnis kita sedikit lebihnya akan sangat bergantung dr 2 hal tsb. Berikut saya coba share beberapa treatment terkait utang dan tagihan yg sering luput dr monitoring pelaku bisnis dan bs berakibat fatal.
A thread.
Waspada!
praktek phising lagi subur.
phising = upaya hacker ambil alih akun email dan sosmed kita.
targetnya? semua pengguna internet.
apalagi kalau kamu main kripto.
ini caraku tangkal phising akun sosmed ku.
semoga bantu kamu.
kunci perlindungan ada di akun email kita.
kenapa?
karena semua sosmed masih terapkan fitur 'recovery via email'.
jika akun email kita aman, maka akun sosmed kita juga aman (semoga).
Dua cara yang aku pakai amankan akun email ku:
a. aktifkan fitur '2 step verification.'
dan 'passkey'
dan 'authenticator'
dan 'google prompt' (butuh device extra seperti laptop atau hp kedua)
semua fitur ini lebih aman karena
metode recovery pakai device fisik kita yang lain.
Lalu setelah fitur a sudah jalan,
b. non-aktifkan fitur 'recovery phone' dan 'recovery email'.
metode ini rawan bobol saat ini.
khususnya 'recovery phone'.
hacker biasa pakai metode 'sim swap' untuk rebut akses ke nomor hp kita
lalu, hacker bisa pakai fitur 'recovery phone' untuk akses akun email kita.
kamu bisa temukan semua fitur di dalam akun gmail
masuk 'manage your google account.'
masuk 'security'.
Salam tangkal phising guys...
PS; kamu masih rasa kurang aman?
Angga pakai metode extra aman,
yaitu hardware fisik khusus 'security key'.
senggol @anggaandinata
Fibonacci Retracement Explained
In technical analysis a Fibonacci retracement is a trading methodology for determining high probability support and resistance levels on a chart. It uses the Fibonacci sequence and that is where its name comes from.
A Fibonacci retracement uses the theory that price swings on charts will usually retrace and backfill a mathematical portion of a move, after this measured pullback the trend usually continues the move in the original direction.
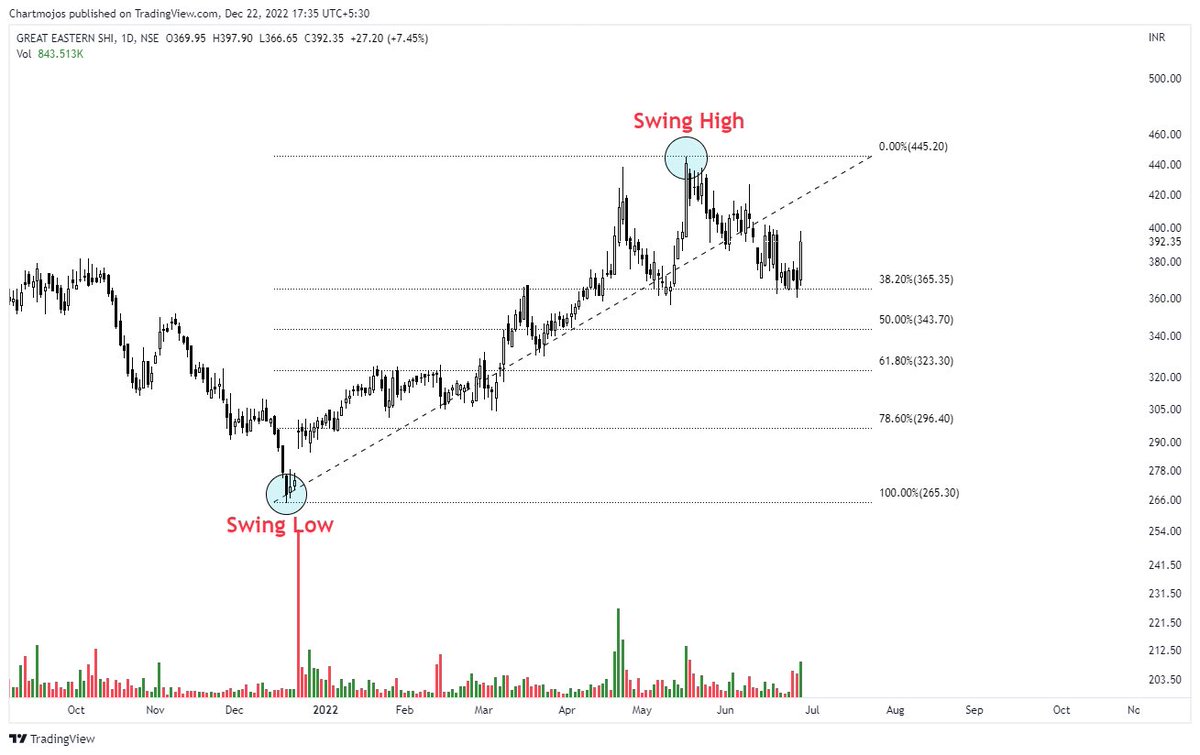
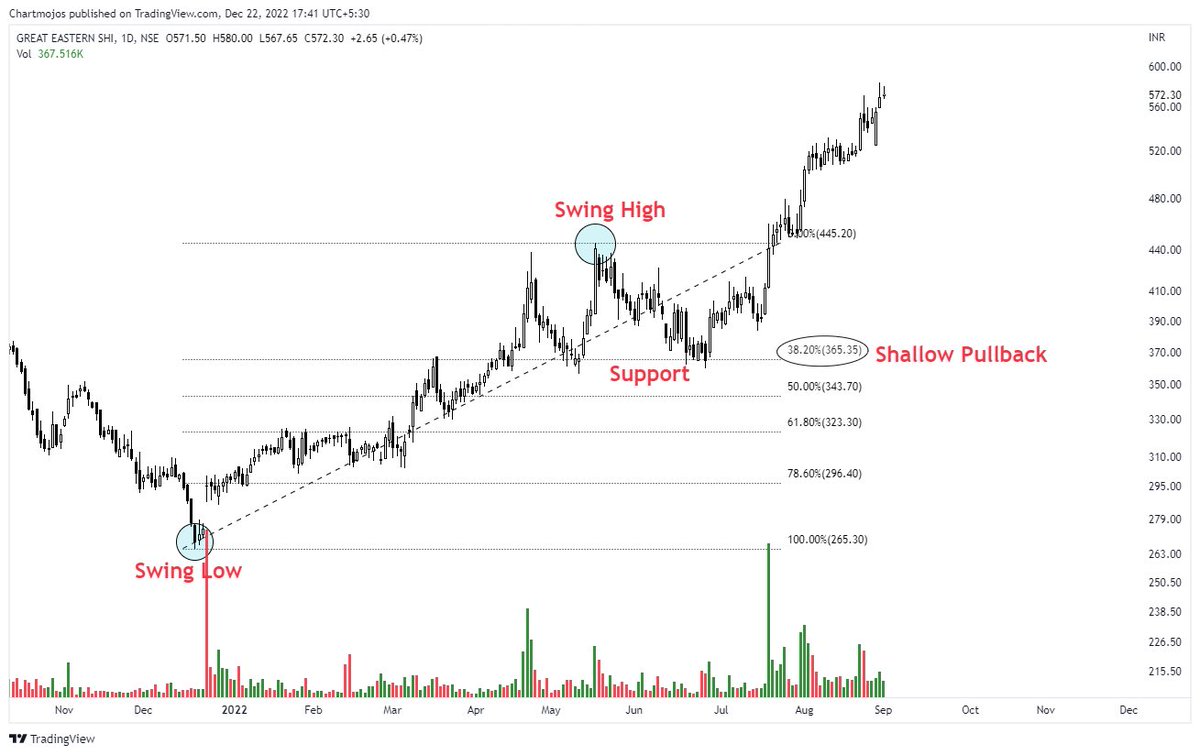
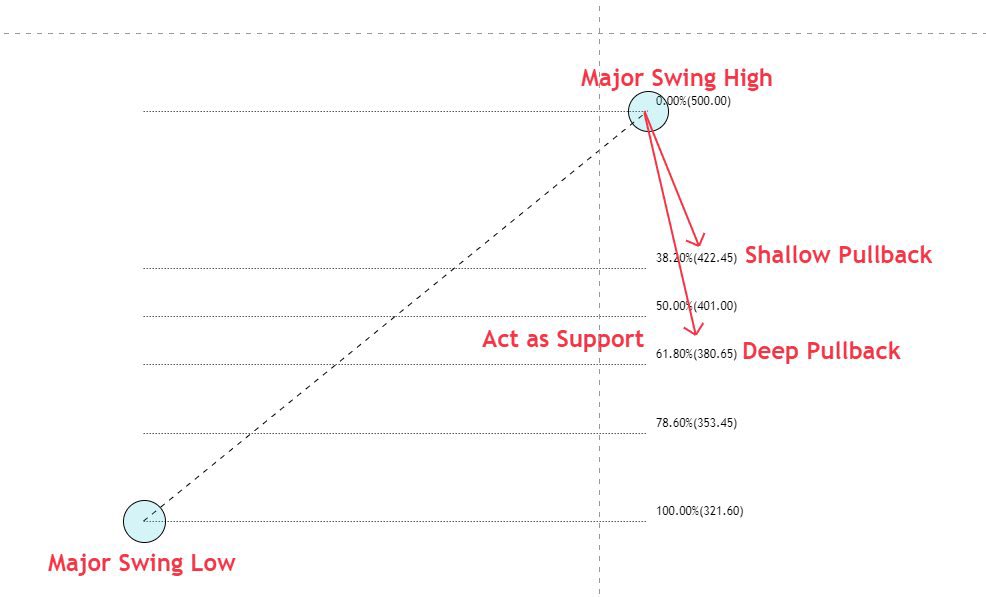
A probable Fibonacci retracement level is quantified by taking two distant price points on a chart and dividing the vertical distance by using the key Fibonacci ratios. 0% is the starting point for the measurement of the retracement, and 100% is a total reversal back to the starting point of the move.
Fibonacci levels are identified by measuring moves from the starting point of support or resistance. Horizontal trend lines are drawn on the chart to identify the potential key support and resistance levels. The significant levels to look at are 61.8% 50%, 38.2%, and 23.6% for support or resistance.
A Fibonacci retracement is a very common technical tool that price action traders use to look for high probability price levels to enter trades, set stop losses in current trades, or set profit targets for winning trades.
The concept of looking at key retracement levels at possible price extensions is a method not only used with Fibonacci but also with many other methods like Elliott Wave theory, Wolfe Waves, and Gartley patterns. After an up or down swing in price the new price support and resistance levels can be seen showing up at the key retracement levels in these methods.
While moving averages can change as price moves the Fibonacci retracement levels are set prices. They are targets on the chart that stay the same. This simplifies the identification of signals and creates price levels that can be acted on immediately when reached. These levels are key reaction points on a chart and can lead to a binary action for traders as the there is either a breakout in price or it is rejected and holds as support or resistance.
The primary 0.618 Fibonacci retracement price level used by so many stock traders is approximately the ‘golden ratio’.
The below example shows Fibonacci retracement levels on the chart for the USD/CAD currency pair. In this example the price action retraced approximately 38.2% from a move down before continuing.
If you agree on this: "AI powered business is the future"
Here's a roadmap for your guidance.
If you're just starting out with AI:
- Learn prompt writing
- Learn to use AI chatbots
- Learn basic Zapier automations
If you're hustling in AI for a while:
- Practice prompt frameworks
- Learn botpress + custom chatbots
- Build no-code automation systems
If you're pro in the AI field:
- Build AI Agents & must sell them
- Design knowledge base chatbots
- Build no-code AI automation SaaS
- Start AI consulting & Automation Agency
Even if you're just starting out, all you need is dedicated work for 15 days.
You'll upgarde yourself to next level.
Companies will hire you, just to teach their employees on:
- How to use ChatGPT effectively.
- How to use Zapier/Make automations
- How to write high-quality prompts.
Help them with this basic knowledge and establish yourself as an "AI Consultant."
I get 5-6 DMs every week from companies to consult them on AI.
That tells me how much demand there is.
*** Stop doom scrolling. This is the time to take action.
Learn, practice, and build your career in AI.
Btw, I'm mentoring 15 hustlers to make them "AI Experts" in their industry.
DM me to grap the remaining few spots.
Let's go. ✨️
30 Of The World’s Best Trading Rules
TRADER PSYCHOLOGY
1. Be flexible & go with the flow of the markets price action, stubbornness, egos, and emotions are the worst indicators for entries and exits.
2. Understand that the trader only chooses their entries, exits, position size, and risk and the market chooses whether they are profitable or not.
3. You must have a trading plan before you start to trade, that has to be your anchor in decision making.
4. You have to let go of wanting to always be right about your trade and exchange it for wanting to make money. The first step of making money is to cut a loser short the moment it is confirmed that you are wrong.
5. Never trade position sizes so big that your emotions take over from your trading plan.
6. “If it feels good, don’t do it.” – Richard Weissman
7. Trade your biggest position sizes during winning streaks and your smallest position sizes during losing streaks. Not too big and trade your smallest when in a losing streak.
8. Do not worry about losing money that can be made back worry about losing your trading discipline.
9. A losing trade costs you money but letting a big losing trade get too far out of hand can cause you to lose your nerve. Cut losses for the sake of your nerves as much as for the sake of capital preservation.
10. A trader can only go on to success after they have faith in themselves as a trader, their trading system as a winner, and know that they will stay disciplined in their trading journey.
Bring your risk of ruin down to almost zero.
RISK MANAGEMENT
1. Never enter a trade before you know where you will exit if proven wrong.
2. First find the right stop loss level that will show you that you’re wrong about a trade then set your positions size based on that price level.
3. Focus like a laser on how much capital can be lost on any trade first before you enter not on how much profit you could make.
4. Structure your trades through position sizing and stop losses so you never lose more than 1% of your trading capital on one losing trade.
5. Never expose your trading account to more than 5% total risk at any one time.
6. Understand the nature of volatility and adjust your position size for the increased risk with volatility spikes.
7. Never, ever, ever, add to a losing trade. Eventually that will destroy your trading account when you eventually fight the wrong trend.
8. All your trades should end in one of four ways: a small win, a big win, a small loss, or break even, but never a big loss. If you can get rid of big losses you have a great chance of eventually trading success.
9. Be incredibly stubborn in your risk management rules don’t give up an inch. Defense wins championships in sports and profits in trading.
10. Most of the time trailing stops are more profitable than profit targets. We need the big wins to pay for the losing trades. Trends tend to go farther than anyone anticipates.
Develop a winning trading system that fits your personality.
YOUR ROBUST METHOD
1. “Trade What’s Happening…Not What You Think Is Gonna Happen.” – Doug Gregory
2. Go long strength; sell weakness short in your time frame.
3. Find your edge over other traders.
4. Your trading system must be built on quantifiable facts not opinions.
5. Trade the chart not the news.
6. A robust trading system must either be designed to have a large winning percentage of trades or big wins and small losses.
7. Only take trades that have a skewed risk reward in your favor.
8. The answer to the question, “What’s the trend?” is the question, “What’s your timeframe?” – Richard Weissman.
Trade primarily in the direction that a market is trending in on your time frame until the end when it bends.
9. Only take real entries that have an edge, avoid being caught up in the meaningless noise.
10. Place your stop losses outside the range of noise so you are only stopped out when you are likely wrong.
Focus On Signals & Tune Out Noise
Among the mistakes of the new traders that never make it to profitability is the fact that they never develop a filter to enable them to see what really matters in the financial markets. Much of what a new trader is exposed to is just pure noise. Noise does not lead to making money, it leads to confusion and frustration. What the new trader must be in search for is signals.
Signals tell you when to buy & when to sell for a profit. Noise tells you nothing but information & if that information cannot be used to make money in the markets then it is not a signal.
“The instinctual shortcut that we take when we have “too much information” is to engage with it selectively, picking out the parts we like and ignoring the remainder, making allies with those who have made the same choices and enemies of the rest.” – Nate Silver
This is the NOISE:
1. Talking heads on television. They could have no position in their picks, they could be pumping their portfolio holding, or talking down their shorts. Who really knows?
2. Predictions by anyone are not trading signals. The farther out the predictions are for the more the odds are against the prediction. The complexity of the world and the markets and the randomness of so many moving parts and players make predicting a future that does not exist impossible.
3. Known news events are not signals. If there are escalating geo-political risks and the same stories are on the news day after day with no major changes in the situation then that news is already priced in. Continual fear mongering from the media is just noise.
4. The shorter the time frame the more random the prices. The farther you zoom out in time the more patterns and trend are identifiable. If you sit in front of your monitor all day the majority of what you see is noise you have to wait until the signal appears inside all that noise.
5. Short term trading results tend to be random. Someone with a long bias that holds losing trades until they come back in a bull market looks like a profitable trader with skills. It is the long term results of a trader that signals whether they have skills in system development, discipline, and risk management. Many new traders that get lucky at the beginning and seem to be profitable are shocked when they end up giving back their bull market gains in the next bear market. Their winning streak was just noise in the long term as the market changed.
These are Signals:
1. A breakout of a trading range to new highs or new lows in your time frame that holds the new price level.
2. An oversold bounce off support or an overbought reversal against resistance in your time frame that is strong enough to convince you it is a high probability trade set up for a swing trade.
3. When the market rallies on bad news or sells off on good news that is a signal of a possible end to the markets prevailing trend.
4. When popular market sentiment is overwhelming bearish or bullish and there is a strong move against that prevailing sentiment it is a possible signal of a market top or bottom being put in.
5. Many times a gap in the direction of the prevailing trend is a signal of a continuation of the trend in the direction of the gap over the long term.
The real point of system back testing and the study of historical price patterns are to find the principles that are present in the markets historical price action. The principles of fear, greed, and ego along with supply and demand are the key underlying causes of trends and range bound markets. The profitable traders are able to search out and find the signals that give them the edge over the traders caught up in trading the noise off their own emotions.
“The signal is the truth. The noise is what distracts us from the truth.” – Nate Silver
The ability to filter out the noise of what does not matter is a skill just as important as finding the signals.
The Richard Wyckoff Theory of accumulation and distribution focuses on supply and demand for a stock, cause and effect, and the law of effort for a stock.
Here are the five steps to the Wyckoff Method strategy for stock selection and trade entry:
1. What could be the probable future trend of a stock based on its present chart and the market price action? Is the stock market currently under consolidation or is it consistently trending in one direction? What is the current the path of least resistance for the market?
Is it making higher highs, lower lows, or going sideways? For this step focus on the stock market indexes. The direction of the trend on the indexes should determine if you are thinking long or short.
2. Choose stocks that are moving in the same direction as the market trend. During an uptrend, choose stocks that are going up more than the general market. Filter for stocks that are a moving a higher percentage up in price than the market indexes on up days and going down less than the market on down days. During a market downtrend, do the inverse, filter for stocks that are going down more than the market index on down days. Look for clear moves on stocks, don’t waste time on ones that are volatile. Look at the trends on a stock’s charts versus the stock market indexes for Step 2.
3. Choose stocks with a “cause” that is equal to or more than your minimum objective. A primary component of Wyckoff’s stock picking and trade management was his strategy for identifying potential price targets using Point and Figure (P&F) projections for trades. In Richard Wyckoff’s fundamental law of “Cause and Effect,” the horizontal P&F count within a trading range represents the cause, while the subsequent price movement represents the effect. Pick stocks to go long that are currently under accumulation or re-accumulation and have a meaningful “cause” for your price target objective. Step 3 uses Point and Figure charts for stock selection.
4. Is the stock ready to move and trend? If a stock is in a trading range after an uptrend, does it look like enough supply of the stock is being sold that a short position could be the best risk/reward ratio? During an accumulation in a trading range, has the supply been traded inside the range through a low volume bounce at price support. Wyckoff used both Bar charts and Point and Figure charts for Step 4.
5. Time your trades with the stock market index turns. 3/4ths or more of stocks trend with the stock market indexes. You can increase the probability of winning trades by going with trades in the same direction as the trend of the total stock market. Wyckoff trading principles try to assist in anticipating the next high probability market moves.
His method tries to identify a change in the nature of price action like identifying the largest down bar with the highest volume after a long uptrend. He advised to place your stop loss at entry, then use a trailing stop if a trade went in your favor to maximize any gains until you exit. He used bar charts and Point and Figure charts for Step 5.
These 5 steps are an overview of the Wyckoff method along with his three laws of price action below on this tweet thread . 👇
Richard Wyckoff Theory Of Accumulation And Distribution:
The Richard Wyckoff Theory of accumulation and distribution focuses on supply and demand for a stock, cause and effect, and the law of effort for a stock.
Here are the five steps to the Wyckoff Method strategy for stock selection and trade entry:
1. What could be the probable future trend of a stock based on its present chart and the market price action? Is the stock market currently under consolidation or is it consistently trending in one direction? What is the current the path of least resistance for the market? Is it making higher highs, lower lows, or going sideways? For this step focus on the stock market indexes. The direction of the trend on the indexes should determine if you are thinking long or short.
2. Choose stocks that are moving in the same direction as the market trend. During an uptrend, choose stocks that are going up more than the general market. Filter for stocks that are a moving a higher percentage up in price than the market indexes on up days and going down less than the market on down days. During a market downtrend, do the inverse, filter for stocks that are going down more than the market index on down days. Look for clear moves on stocks, don’t waste time on ones that are volatile. Look at the trends on a stock’s charts versus the stock market indexes for Step 2.
3. Choose stocks with a “cause” that is equal to or more than your minimum objective. A primary component of Wyckoff’s stock picking and trade management was his strategy for identifying potential price targets using Point and Figure (P&F) projections for trades. In Richard Wyckoff’s fundamental law of “Cause and Effect,” the horizontal P&F count within a trading range represents the cause, while the subsequent price movement represents the effect. Pick stocks to go long that are currently under accumulation or re-accumulation and have a meaningful “cause” for your price target objective. Step 3 uses Point and Figure charts for stock selection.
4. Is the stock ready to move and trend? If a stock is in a trading range after an uptrend, does it look like enough supply of the stock is being sold that a short position could be the best risk/reward ratio? During an accumulation in a trading range, has the supply been traded inside the range through a low volume bounce at price support. Wyckoff used both Bar charts and Point and Figure charts for Step 4.
5. Time your trades with the stock market index turns. 3/4ths or more of stocks trend with the stock market indexes. You can increase the probability of winning trades by going with trades in the same direction as the trend of the total stock market. Wyckoff trading principles try to assist in anticipating the next high probability market moves. His method tries to identify a change in the nature of price action like identifying the largest down bar with the highest volume after a long uptrend. He advised to place your stop loss at entry, then use a trailing stop if a trade went in your favor to maximize any gains until you exit. He used bar charts and Point and Figure charts for Step 5.
These 5 steps are an overview of the Wyckoff method along with his three laws of price action below in this Twitter thread. 👇
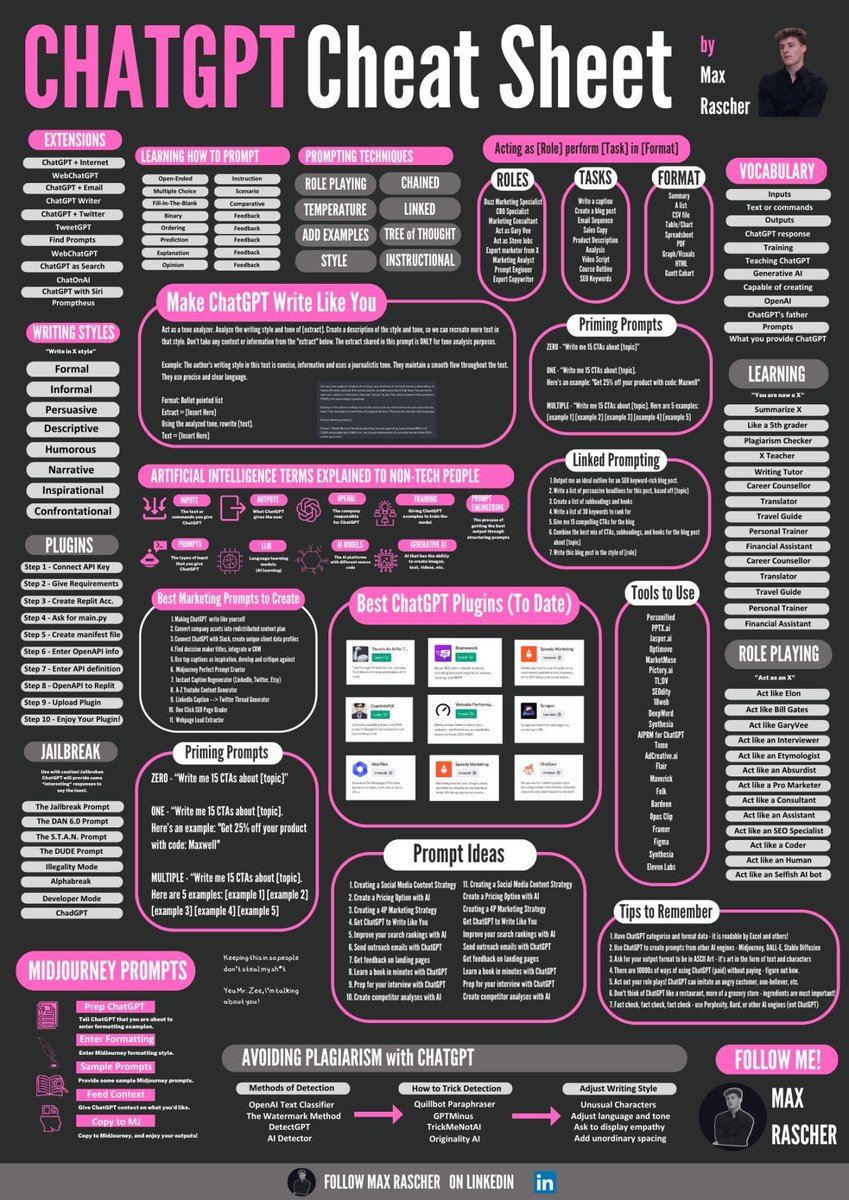
I've spent months collecting the best AI cheat sheets.
Here are the top 8 AI cheat sheets that will save you hours of work (for free):
1. Ultimate ChatGPT cheat sheet