Many traders have been asking about my personal settings for the Price Data & Time Grids indicator. 📊
You can find the exact $BTC settings in the comments of this post! 👇
Other platforms are still trying to catch up to our TPO.
V5 just moved the finish line.
Smoother rendering.
New features.
More speed than anything else on the market.
Coming in V5: turn your scripts into income.
You write the script. You set the price. You sell it to 100k+ traders without leaving MMT.
We're opening a marketplace for community scripts. Approved builders publish to the community and get paid for it. No need to build an audience first, the traders are already here.
Details on applying and payouts drop closer to launch.
Want in early? Join the Discord 👇
Non-Time Rotations just launched.
The clock is no longer the only way to build a chart.
Six new ways to read price:
Trades - a new bar prints every set number of trades. Speed of activity shapes the chart, not the clock.
Volume - bars close on traded volume, marking exactly where real size changed hands.
Range - fixed price-range bars that filter out chop and sharpen structure.
Trend Reversal - bars build until price reverses by a set number of ticks, isolating every swing.
Delta - bars close on net delta, surfacing aggressive buying and selling pressure.
Imbalance - a bar closes once buying or selling imbalance hits your threshold
Tip of the Day:
Two charts. One on Net Longs footprint. One on Net Shorts.
At every level you now see both sides exactly. Longs entering or shorts exiting? Both?
That answer is the difference between a real reversal and continuation.
One chart is only half the story.
V5 is getting new features every single day.
Try Bar Replay.
Build up price bar by bar. Watch exactly how the market moved. How the orderflow developed. Where the liquidity was hit. How the heatmap filled in as the move unfolded.
A full reconstruction of exactly how price got there.
Go back. Study it. Understand it.
Most trading education is patterns and folklore. The mechanics underneath? Almost nobody teaches it.
We're going to. Properly. A full trading playbook, free for everyone.
What do you wish someone had explained properly? 👇
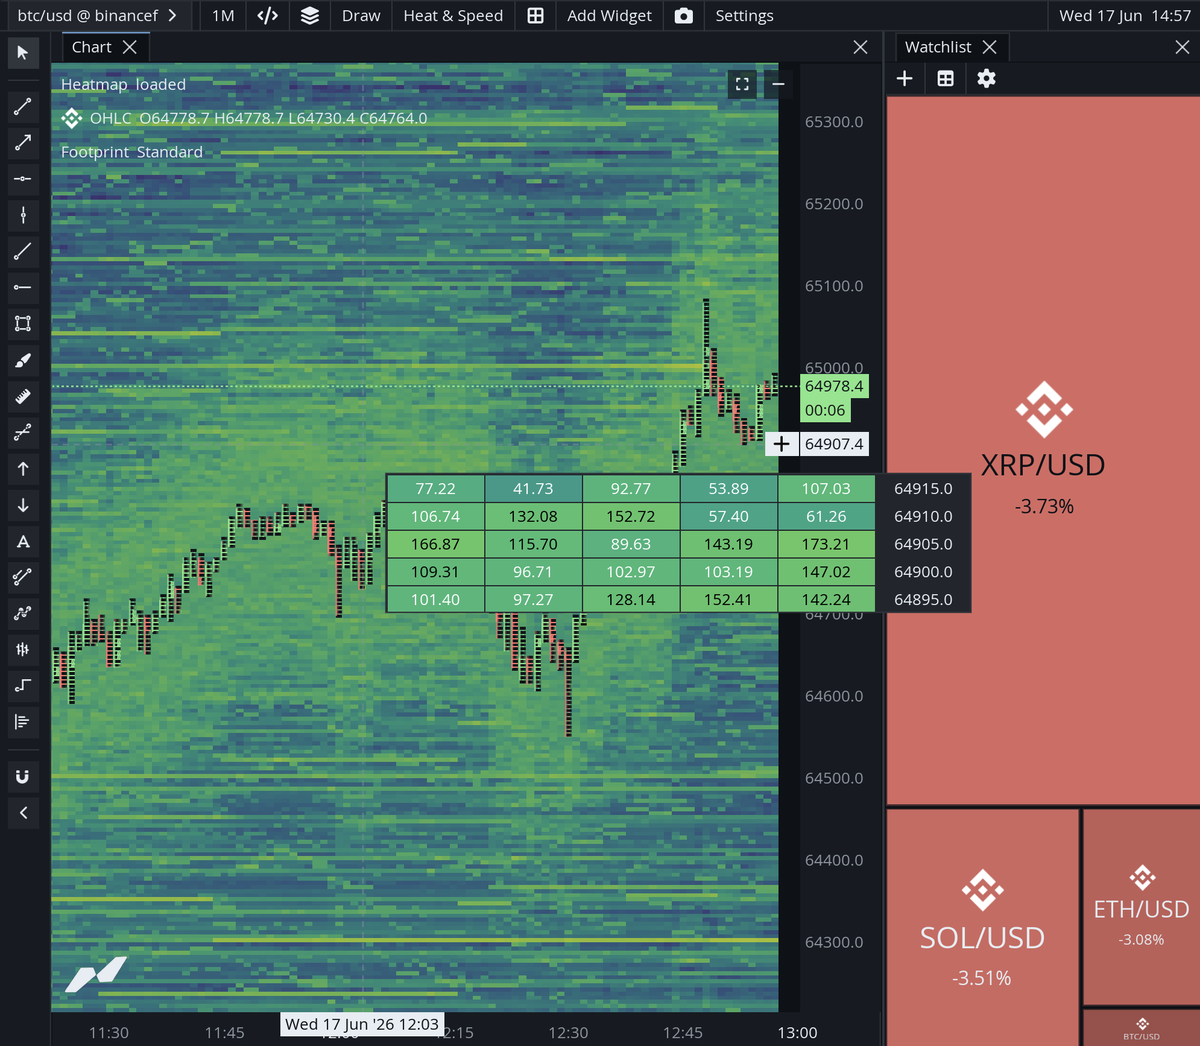
When orders stack like this on the heatmap pay attention!
Those dense horizontal clusters are large participants positioning either defending a level or waiting to distribute into any move that reaches them.
Here is how to read them:
- Stacked orders above price → supply wall. Real passive selling waiting.
Until that liquidity gets absorbed or pulled price is not going through it cleanly.
- Stacked orders below price → two scenarios. Real demand defending the level. Or a liquidation magnet trapped longs with stops just beneath it that will accelerate any flush.
How to tell the difference?
Watch what happens when price arrives:
- Does the stack absorb aggression and hold?
- Do the orders disappear before price touches them? Spoof.
- Does price slice through with accelerating delta? Liquidation cascade not support.
The heatmap shows you where the walls are.
The orderflow tells you if they are real when price gets there.
Weekend prep starts now!
Before Monday opens check the Spot Heatmap and do this:
Step 1:
Aggregate Spot on the Heatmap. Now you see where real spot orders are positioned. Actual Spot liquidity sitting above and below price.
Step 2:
Add aggregated OB Imbalances at different distances. Check the imbalance at 2.5%, 5% and 10% from price. Where is the bid side dominant? Where is the ask side stacked? How does that imbalance shift as you move further from current price?
Step 3:
Watch for the switch. Here is the signal that matters going into next week.
The moment Spot starts entering again the Heatmap thickens at specific levels. The OB Imbalance flips. Bid side builds with real size. This is one of the earliest signals that real money is returning to the market.
That is your edge before Monday opens.