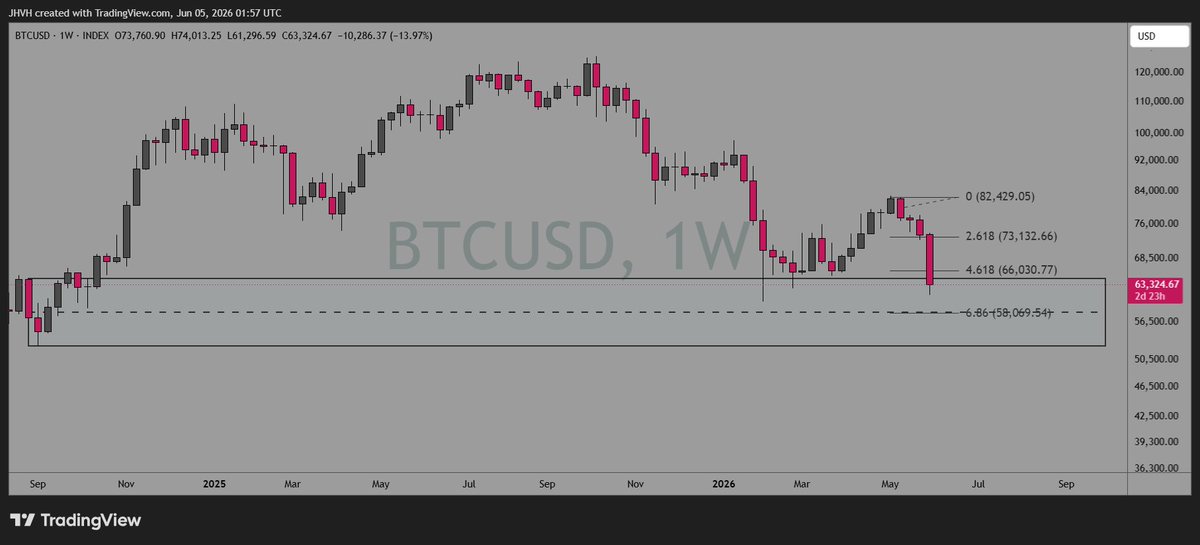
@EasychartsTrade Here's mine. Fib extension put on the daily but this is a weekly view. Confluence with the 50% level of the move origin & the .686 fib. If that turns out to be hopium then it may switch to the 2W view (looks like max pain to me).
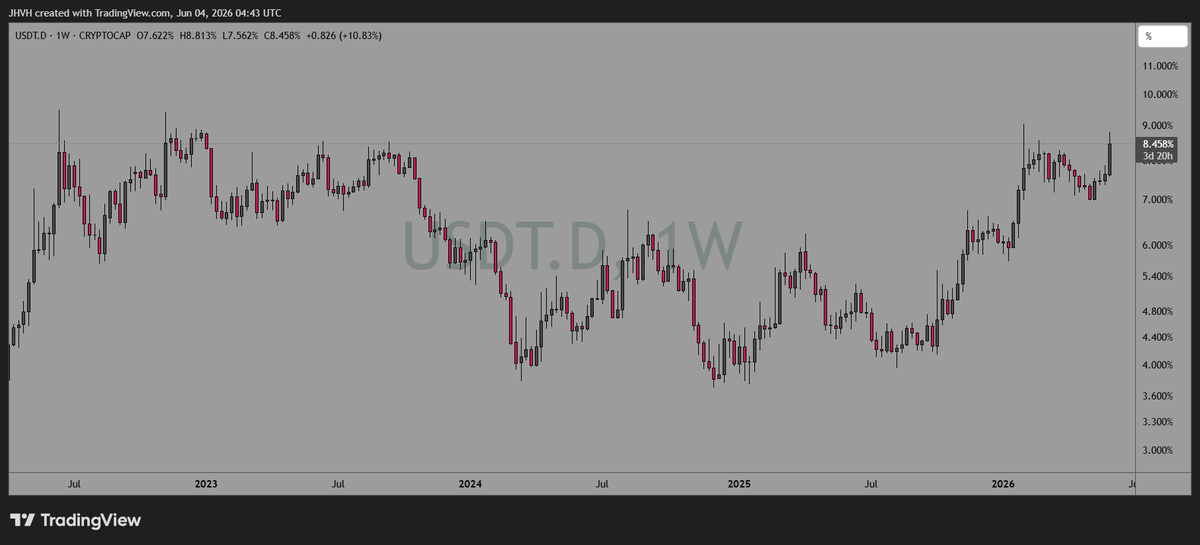
I'm a bull pointing out the short term potential for a bearish movement. To me, this looks like a stretched out fractal on $USDT.D
If this gets above the 50MA & holds then the similarities would continue & relief may not come until early to mid-June.
The only chart retail needs since they like to buy tops and sell bottoms. Don't change the habit, just change the chart and apply it to your favorite holdings.
$XRP daily RSI
Familiar pattern, only seeing two "clean" versions in its history, 2016 and 2021. Never has it been this stretched out. Makes sense though, given how poor the sentiment is.
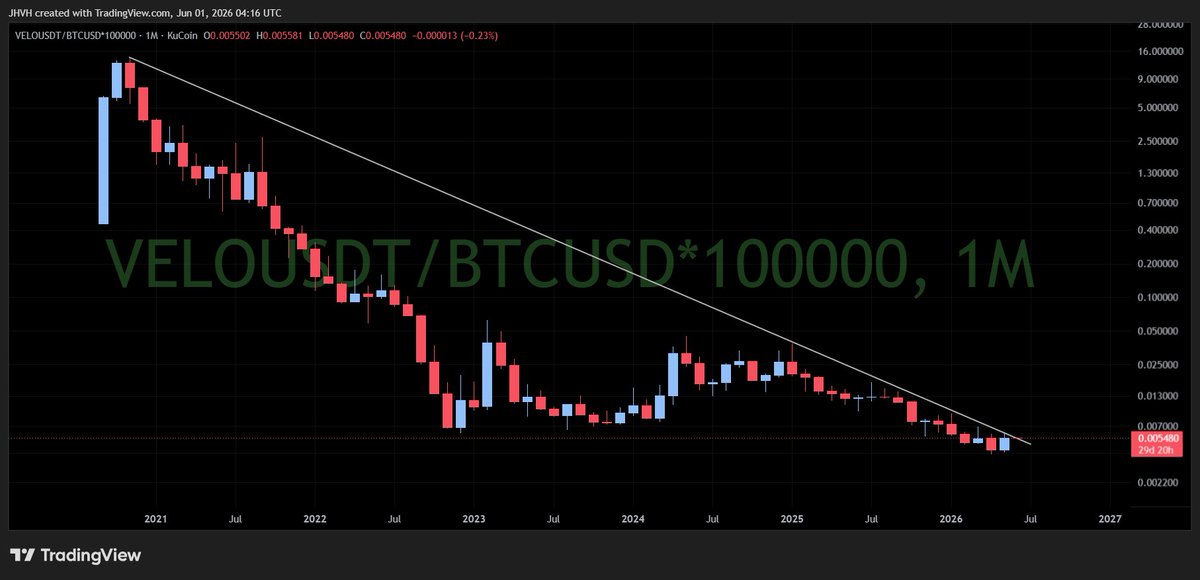
$VELO Kucoin chart
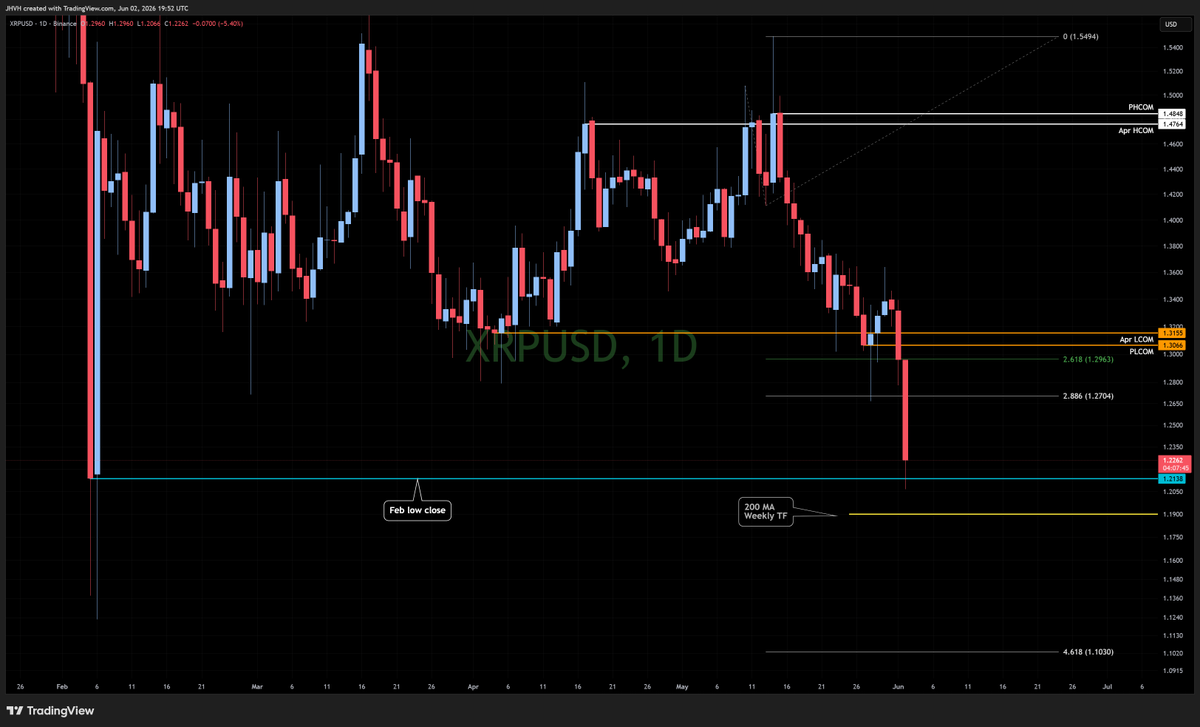
Almost hit the .702 but not quite so 3 levels in play since the 4H still isn't positive.
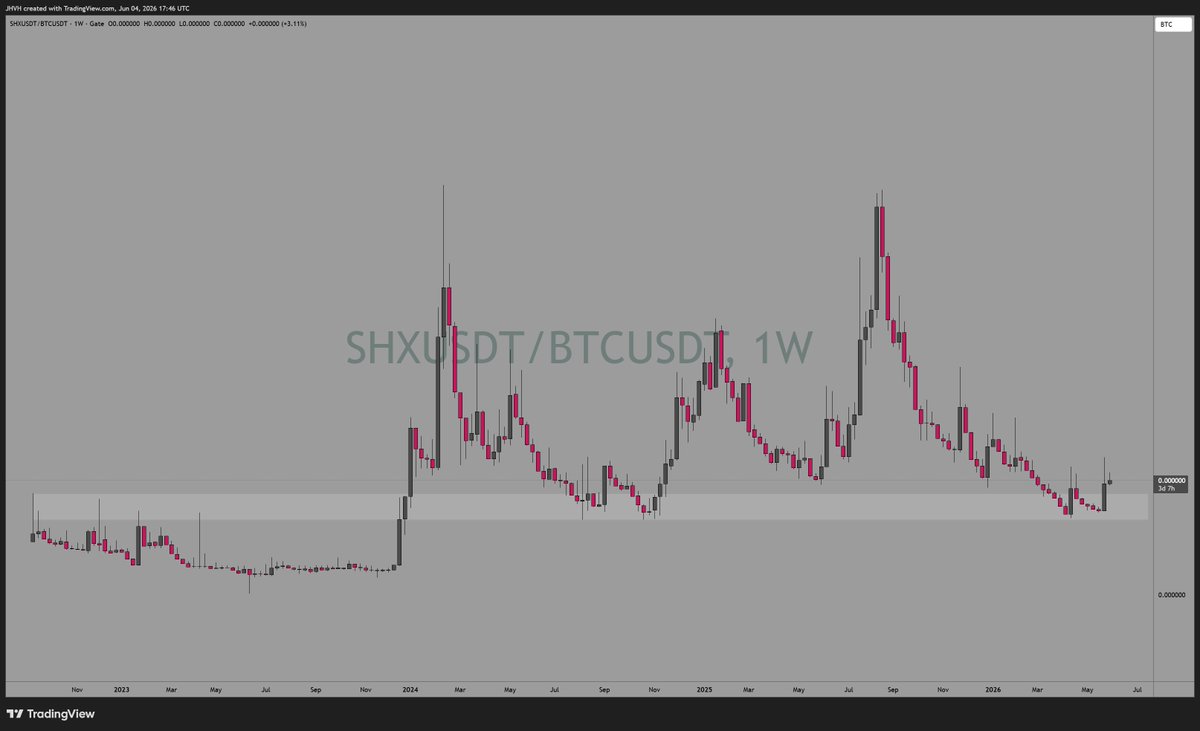
Crytpo chart
Just bouncing around inside the Darvas box