UNDERSTAND TIMEFRAME
FOUNDATION
A timeframe is the duration each candlestick represents on a price chart
Higher timeframes (weekly/monthly) reveal the macro trend and major support/resistance zones
Lower timeframes (1min���1hr) display micro price action, volatility, and precise entry/exit points
Using a single timeframe gives incomplete data; multiple timeframes provide context and confirmation
The choice of timeframe must align with your trading style, risk tolerance, and available screen time
TIMEFRAME TYPES & THEIR ROLES
Scalping (1m–5m): Ultra-short term, fast momentum trades, requires intense focus and rapid decision-making
Intraday (15m–1H): Captures daily price swings, ideal for day traders who close positions before market close
Swing (4H–1D): Holds positions for days to weeks, targets larger moves with less frequent monitoring
Position (1W): Follows multi-week/month trends, relies on technical patterns and macroeconomic cues
Investment (1M+): Long-term horizon, driven by fundamentals, valuations, and secular growth themes
MULTI-TIMEFRAME SYNERGY
Higher timeframe defines the dominant trend direction,your "north star" for trade bias
Medium timeframe identifies the specific setup pattern (flags, triangles, breakouts, pullbacks) within that trend
Lower timeframe pinpoints the exact entry trigger (candle close, volume spike, indicator crossover) with tight stops
Aligning all three increases probability and reduces false signals from market noise
Example: Daily uptrend + 4H consolidation near support + 1H breakout candle = high-conviction long entry
TIMEFRAME SELECTION BY TRADER PROFILE
Scalper: 1m–5m — prioritizes speed, liquidity, and small profit targets per trade
Day Trader: 15m–1H — balances opportunity with manageable risk during active market hours
Swing Trader: 4H–1D catches intermediate trends, less stressful than day trading
Position Trader: 1W focuses on trend continuity, uses weekly closes for validation
Investor: 1M+ ignores short-term volatility, emphasizes long-term value creation
CRITICAL RULES FOR TIMEFRAME USAGE
Never trade against the higher timeframe trend it drastically lowers win rate and increases drawdowns
Lower timeframe entries must always confirm the higher timeframe bias (not contradict it)
Patience is non-negotiable: wait for the setup to fully develop on all timeframes before acting
Use higher timeframes to define stop-loss zones (beyond major structure), lower timeframes to fine-tune placement
Multi-timeframe analysis is not optional,it is the foundation of professional risk management and trade planning
HOW TO TELL THE DIFFERENCE BETWEEN A PULLBACK & A REVERSAL🔮🔮
We've all been there. Price starts to move against the trend & we're stuck wondering if it's just pulling back or if it's about to reverse
Here's how you can tell the difference:
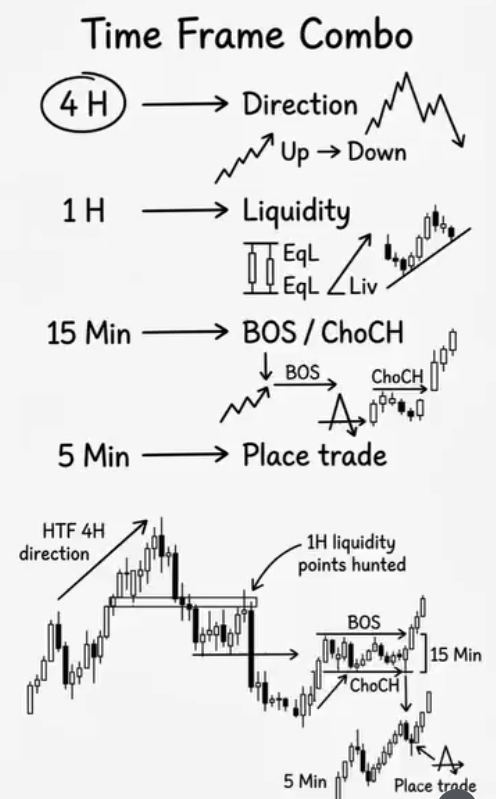
🚨TIME FRAME COMBO – THE RIGHT WAY TO TRADE
📊 THE HIERARCHY;
4 HOUR – DIRECTION
✅ HTF Trend – Up or Down
✅ Sets the overall bias for the day
✅ Trade only in this direction for higher probability
1 HOUR – LIQUIDITY
✅ EqL (Equal Liquidity) – Identifies buy/sell side liquidity zones
✅ Liquidity hunted – Price sweeps stops before reversing
✅ Marks key levels for entry zones
15 MINUTE – BOS / CHOCH
✅ BOS (Break of Structure) – Confirms trend continuation
✅ ChoCH (Change of Character) – Signals potential reversal
✅ Gives confirmation before entering
5 MINUTE – PLACE TRADE
✅ Entry execution – Fine‑tune your entry
✅ Look for FVG retest or Order Block reaction
✅ Set stop‑loss beyond liquidity wick
✅ Target next structure level
🎯 FINAL RULES;
✅ 4H = DIRECTION (Don't fight it)
✅ 1H = LEVELS (Where liquidity sits)
✅ 15M = CONFIRMATION (BOS or ChoCH)
✅ 5M = EXECUTION (Enter with precision)
✍️ Stack the time frames – Stack the odds in your favor.
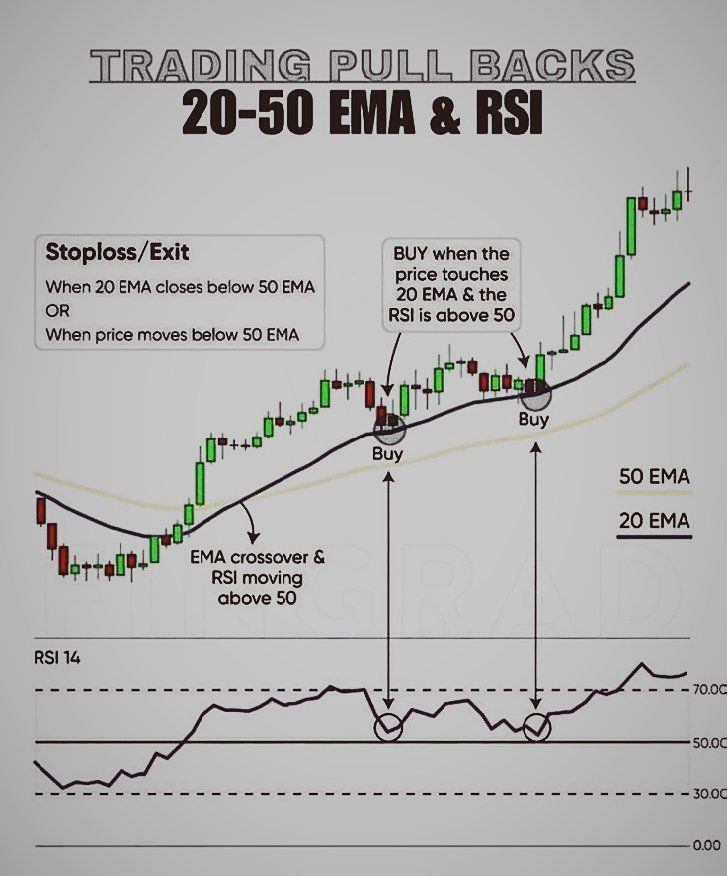
📥 Entry Rules (Buy Setup):
Enter only when the 20 EMA flips above the 50 EMA (uptrend confirmed).
Make sure RSI (14) stays above 50 to validate strength.
Buy the dip when price pulls back to the 20 EMA while RSI remains above 50.
📤 Exit / Stop-Loss Rules:
Exit immediately if the 20 EMA slips back below the 50 EMA, or
If price closes below the 50 EMA (trend weakening).
💡 Why This Works:
A clean pullback strategy that rides an established uptrend using EMA alignment + RSI strength for confirmation.
#trading
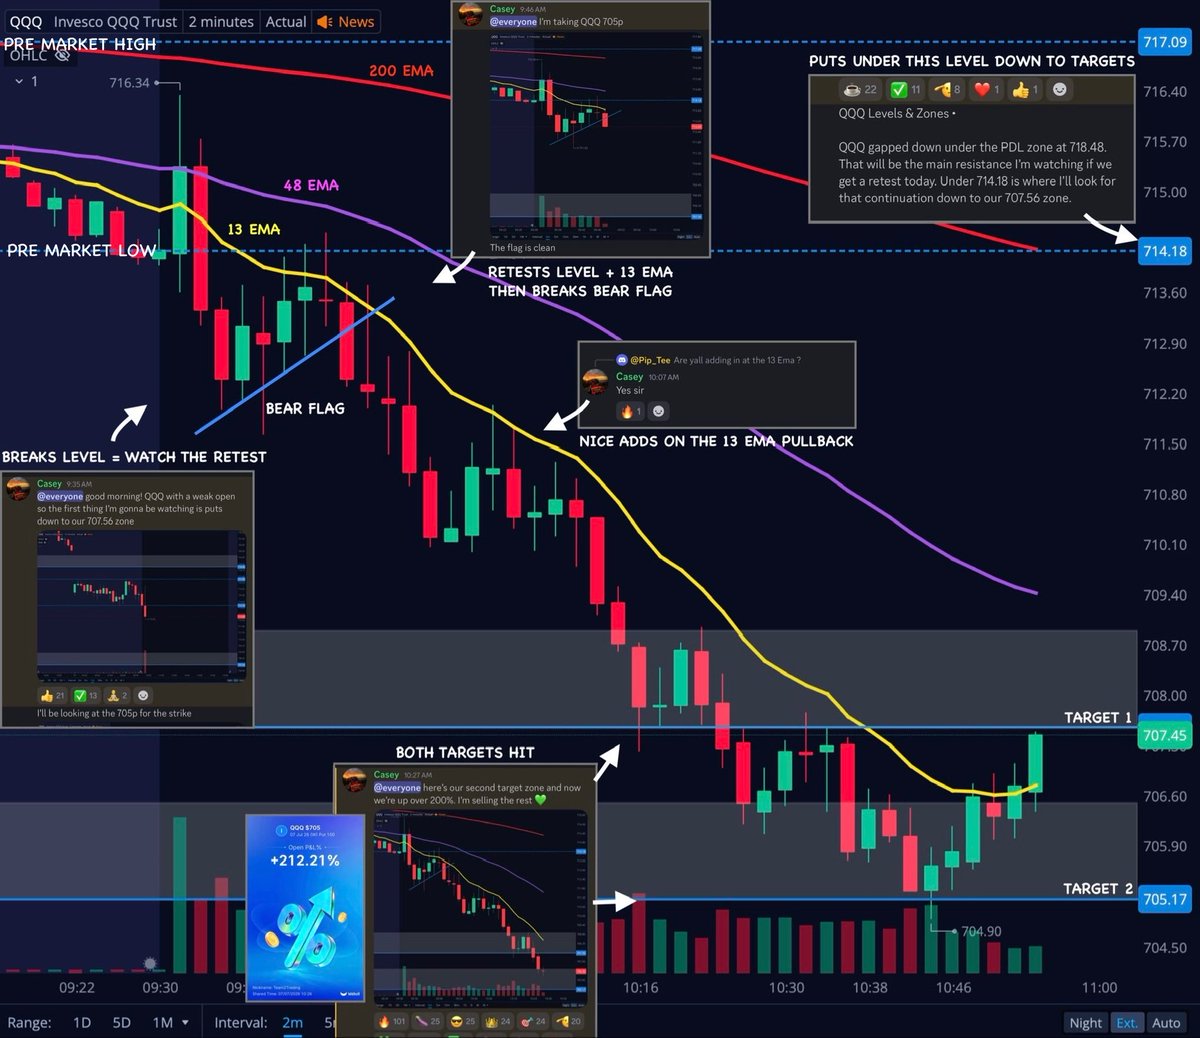
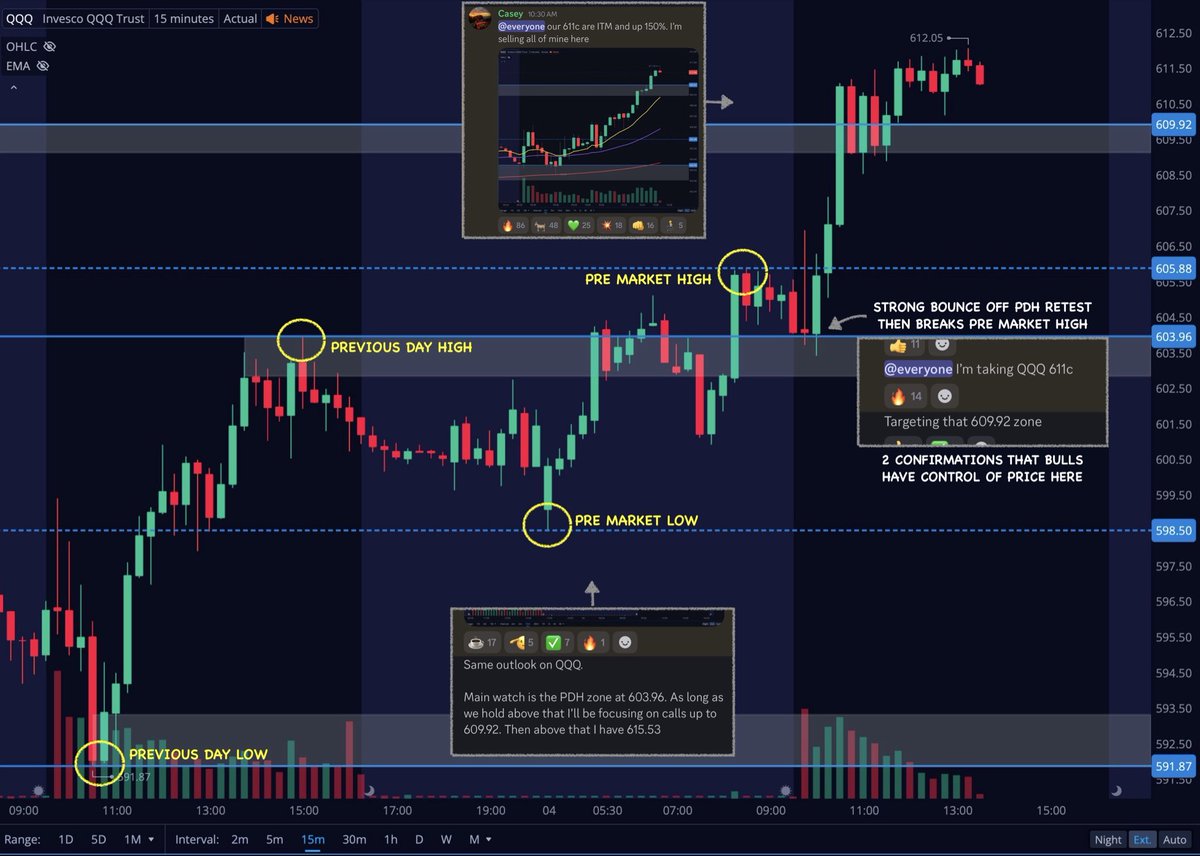
Here’s my blueprint for day trading 📝
$SPY $QQQ $IWM
Mark these 4 levels ✍️
Previous Day High ✅
Previous Day Low ✅
Pre Market High ✅
Pre Market Low ✅
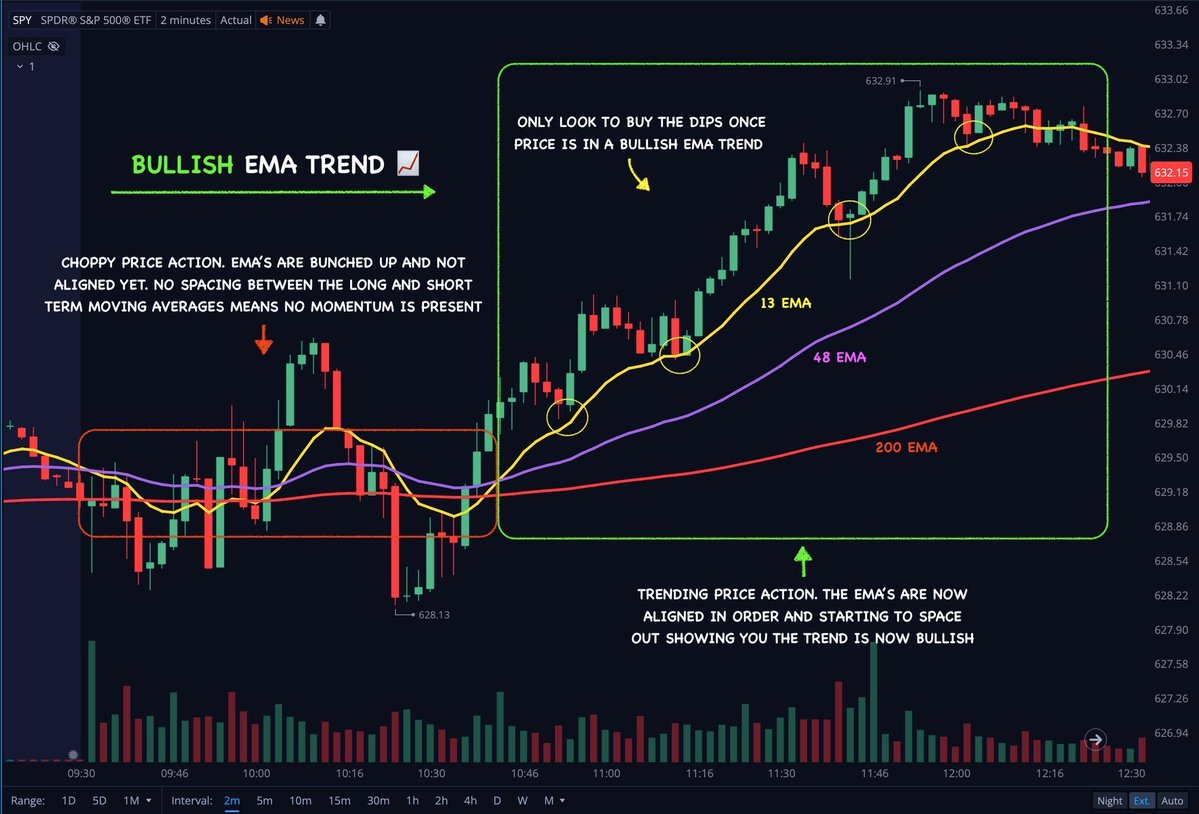
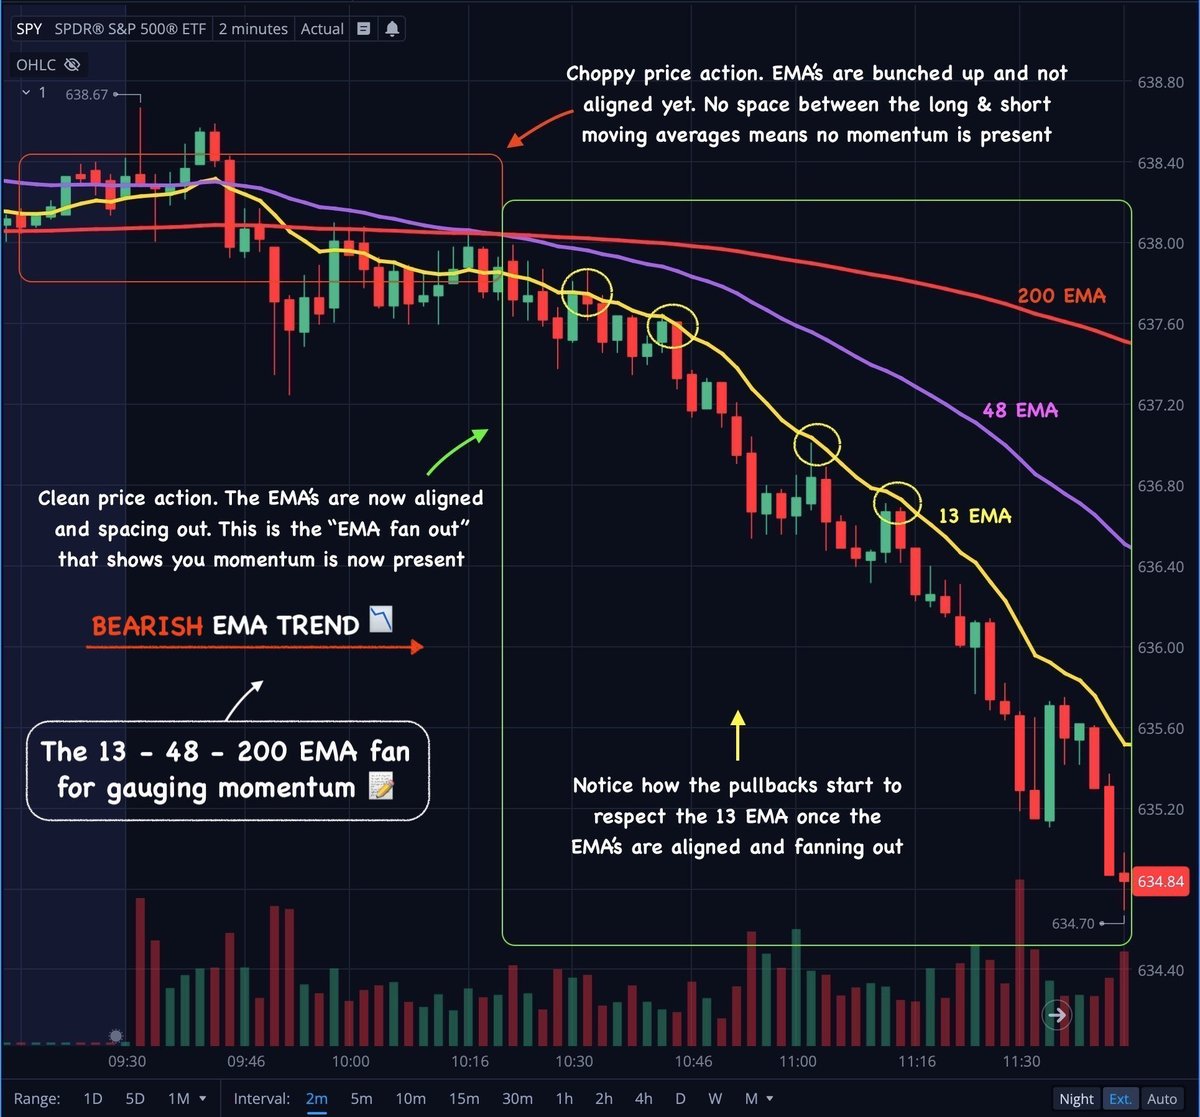
Add these EMA’s to your chart 📊
13 EMA 🟡
48 EMA 🟣
200 EMA 🔴
Study these simple patterns 🏳️
Bull flags 📈
Bear Flags 📉
Focus on break & retest trades that align with the EMA trends. Bull / Bear flags are bonus points.
1 or 2 trades a day. Small size. Base hits.
Follow this for 1 month and watch the discipline turn you into an absolute beast!
Then SLOWLY start to size up.
You’re welcome 💚
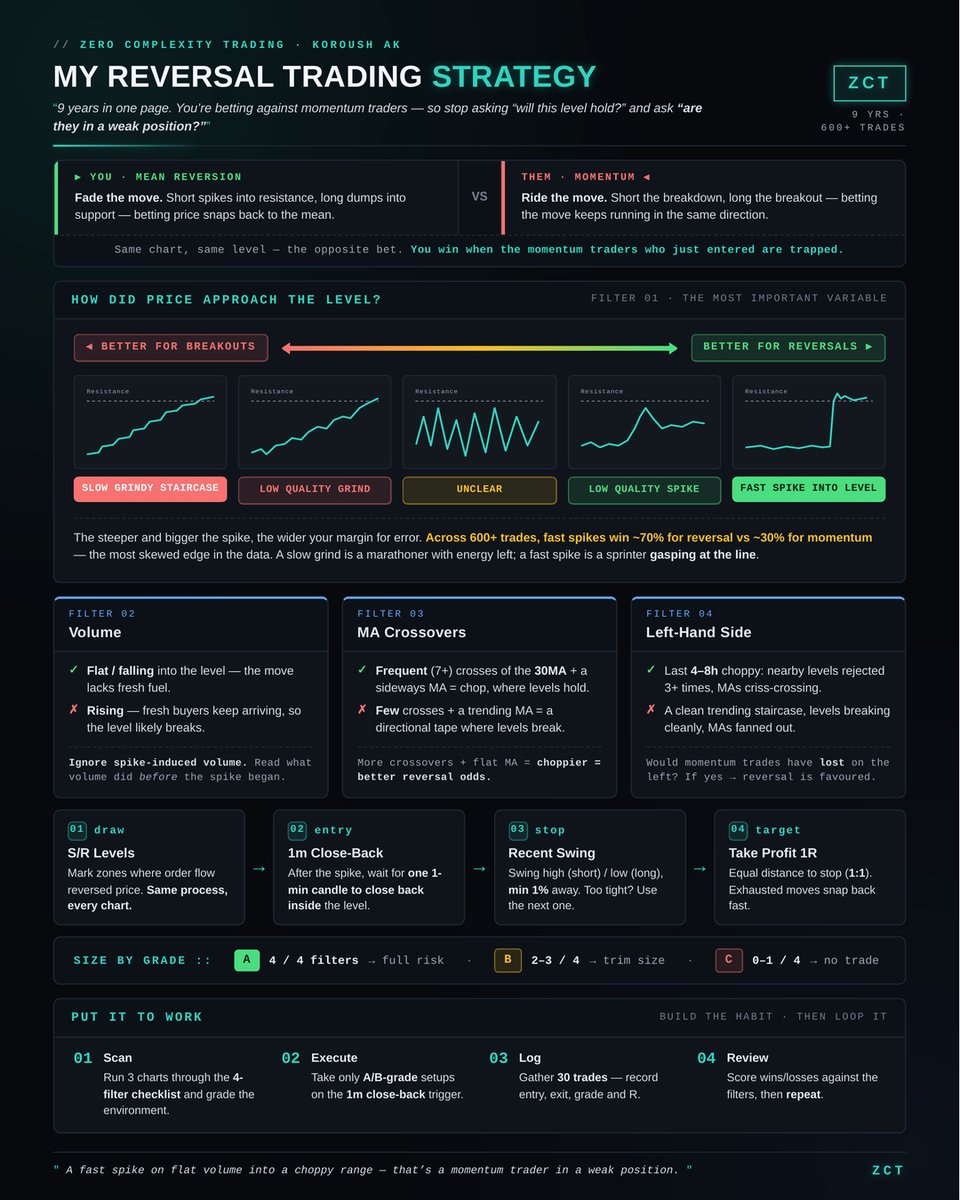
This strategy has caught me more reversals than anything else.
In this guide you'll get:
- Exact entry and exit rules
- Optimal trading environments
+ Real Trade Examples (not just theory)
I also made a full cheatsheet for you to download.
Enjoy.
Last but not least...
Screener bukan alat untuk memberi sinyal beli.
Screener hanya menyaring ratusan saham menjadi beberapa kandidat terbaik.
Keputusan akhir tetap harus melihat chart, risk management, dan trading plan.
Terima kasih sudah membaca
Jika dirasa bermanfaat
Mohon pencet tombol suka
This trader used Claude to build a Quant Bot and made +$736,660 on Polymarket
Since Mar 3, this wallet has been bringing in about $6,190 per day and running at a little over 14 trades per hour
41,172 predictions with a 62% win rate in 119 days
This trader’s Polymarket account:https://t.co/Fx6ZkdFpH0
The bot strategy is simple:
> It leans into short crypto markets when prices are still out of sync
> Gets filled before the board fully catches up and keeps deploying the same setup across a massive number of entries
The result does not come from one outsized trade, but from pressing the same edge again and again until it compounds
Most profitable trades:
$17,839 → $36,318 (+$18,478, +103.58%)
$3,112 → $15,011 (+$11,898, +382.22%)
$10,676 → $22,178 (+$11,502, +107.74%)
What stands out here is not one lucky position. It is a repeatable short-window process that keeps turning small pricing gaps into a steadily rising PnL curve
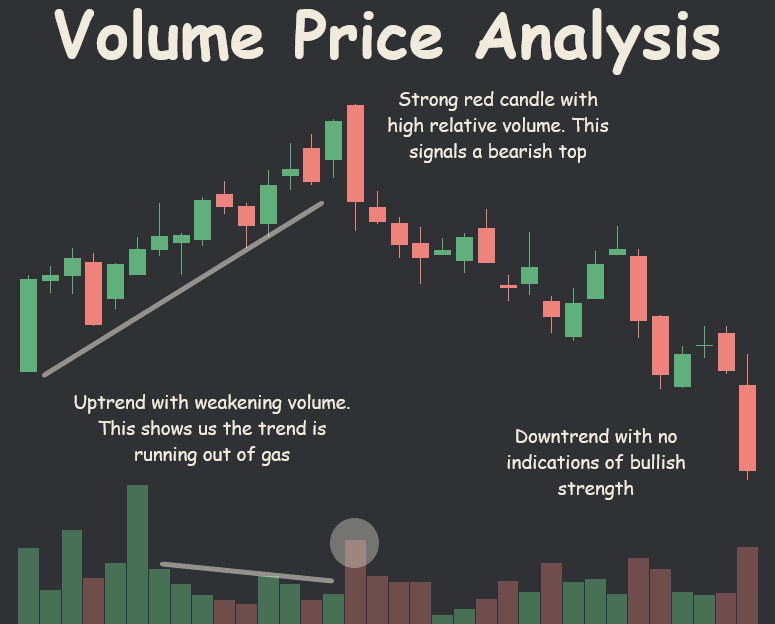
Volume Price Analysis (VPA)👑
VPA is looking at volume & price action & examining the relationship between to the two in order to help predict future movement