@m13v_ Good catch. Changed the default to Pro/quota view.
Most Claude Code users are on Pro/Max anyway.
The cost of showing token % to an API user
is lower than quietly lying to a Pro user who forgot to toggle.
h/t for the failure mode.
Claude Code token dashboard v5.
New: click any project to see session-level costs.
Which session cost $44?
Which one ran 950 messages?
Now you can see exactly where your budget went.
npm install -g @notenkidev/claude-token-dashboard
#ClaudeCode#buildinpublic
@m13v_ That's the clean split.
ClaudeMeter: live server truth, mid-session awareness.
My dashboard: post-session retrospective, project-level patterns.
Different jobs. Both necessary.
@m13v_ Sharp failure mode.
Defaulting to quota view makes sense —
most Claude Code users are on Pro/Max anyway,
and the cost of showing token % to an API user
is lower than quietly lying to a Pro user who forgot to toggle.
Changing the default. Good catch.
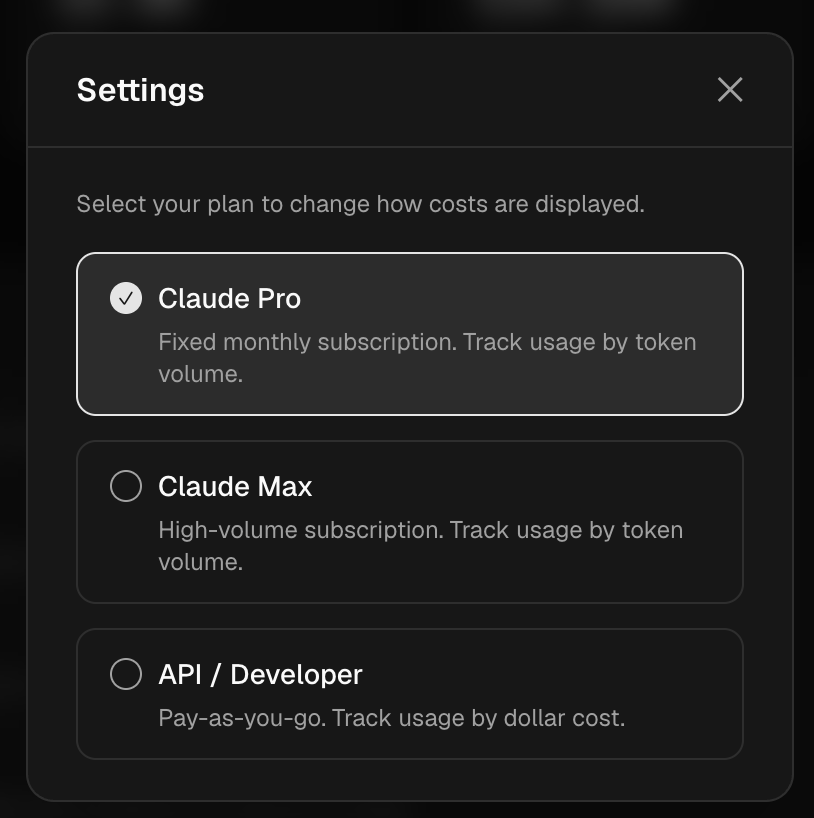
@m13v_ Agreed — can't detect it automatically from JSONL.
Manual plan selection for now.
User picks Pro / Max / API, display adapts accordingly.
Not elegant, but honest about what the data can and can't tell you.
@m13v_ That reframes the whole display.
API users → dollar cost is the right axis.
Pro/Max users → quota % is the right axis.
Same data, different lens.
The dashboard should detect which you are and switch accordingly.
That's the right fix. Building it.
@m13v_ Correct — and worth making explicit in the UI.
For Pro/Max: token-based reconstruction, not metered billing.
For API users: closer to actual cost.
Should label it 'estimated' more clearly.
Thanks for the precision.
@m13v_ Fair — real-time prevention is ClaudeMeter's job.
Mine is the post-mortem:
why did that refactor cost $44,
which session blew the budget,
and how to restructure so it doesn't happen again.
Prevention + retrospective. Both matter.
@m13v_ ClaudeMeter = server truth, present tense.
My dashboard = local JSONL, past tense.
You see the wall coming.
I show you where the money went after.
Different windows, complementary data.
The full picture needs both.
Wrote up the bigger picture behind what I'm building.
It's not just a token dashboard.
It's the trust layer between humans and AI agents.
https://t.co/2KmiU513Wp
#ClaudeCode#buildinpublic#AI
@akhil_kestur For Pro plan users the dollar figure is approximate.
For API users it should be close to accurate.
Billing API integration would make it exact —
that's on the roadmap.
@akhil_kestur Local transcripts only — parses ~/.claude/projects/ JSONL files directly.
No API calls, no auth required.
That's the tradeoff: 100% private,
but cost is estimated from token counts × published pricing,
not pulled from actual billing.
@JustJerry121 Not yet — that's the next layer.
Right now it's per-session.
Model vs tool-call breakdown is on the roadmap.
Is that the split you'd find most useful,
or is there another cut that would move the needle for you?
AI agents can already:
- call APIs
- use tools
- execute workflows
But they still lack:
- delegated authorization
- replay-safe verification
- machine-readable audit trails
I’ve been experimenting with an OSS called AgentPass.
Recent work:
- README-only onboarding
@JustJerry121 Agreed — per-command cost is the next screen.
Right now I can see per-project and per-day.
Per-command is where the real actionable data lives.
Building toward that. Good timing to connect.
@vadym_petryshyn That's the core insight —
numbers without context are noise.
Numbers that tell you what to do next are signal.
More precision on the suggestions coming in v5.
@subramanya Exactly — 'showing spend' is table stakes.
The insight that moves the needle is
'this specific repo/config is wasting $X per day
and here's what to do about it.'
That's what v4 is starting to do.
More precision coming.
Updated the https://t.co/ULWkLle2PO writeup with v2 + v3:
- Cost in dollars per project
- CLAUDE.md size visibility
If you're using Claude Code and haven't checked what you're spending — this might surprise you.
https://t.co/Bd9ynVLw3o
#ClaudeCode#buildinpublic