Frontend Engineer • Creative Developer • AI Explorer. Sharing lessons from building production applications, design systems, web performance, and autonomous AI.
Once the code is in your repo, you own it.
Vault gives you the source. Edit it. Ship it. Keep it.
Even when the subscription ends. The code stays yours.
https://t.co/6rJP8V8ttt
#makethewebmove
This MF @athrix_codes copied every single component in ObsidianUI from https://t.co/SaUSAW1ohh @hyperiux
Not similar. Not “inspired by.” Direct Copy.
Every. Single. Component.
The current component code even carries our implementation notes, including source structure, development comments, and even images from our demos.
Open source does not mean “erase the source and present someone else’s work as your own.” Build on our work. Fork it. Learn from it. Credit it where the license requires it. But don’t remove attribution and pretend the work originated somewhere else.
Somehow this 15/16 year-old fraudster even managed to defraud @vercel into sponsoring. @vercel_dev should investigate this!
Happy to provide the original files, timestamps, commit history, and side-by-side comparisons.
5/5
I found the backend version of this in production last week.
A blanket unpublish flag was fine for a takedown because takedowns have no undo. Nine days later, the same pattern was copied into a merge/unmerge pair.
Unmerging one site republished a screenshot that had never been public.
Writing the first reversible version of an operation is a free audit of every irreversible one that shares its shape.
#React #Frontend
🧩 Component Anatomy - Your First Reversible Action Will Break Your Irreversible One
1/5
An operation that only ever runs forward can be wrong for years and nobody notices.
Write its inverse, and the wrongness turns into arithmetic.
A scroll lock is a good example.
4/5
The same shape shows up in other component code: focus restore, aria-hidden on siblings, roving tabindex.
Enter writes a constant.
Exit writes another constant.
The safer version is symmetrical: enter records what it changed, and exit restores it.
176 tests. All green.
3 bugs still shipped to production.
A broken regex escape. A screenshot that stayed public when it shouldn't have. A cleanup leak that left fake data live in prod.
Each one passed because the test only checked what it was told to check & not what actually happened.
Wrote up all three, and what actually catches this class of bug:
https://t.co/TkRmdeCueb
@KUNUTZ142 "Two halves of the same problem" is exactly right. Rollback-first is the piece I don't have, Graft gives me a map so I'm not guessing where things fit, but it doesn't stop me from making the wrong edit inside a file I was already allowed to touch.
That's a real pain point, mid-session regressions are brutal. I've been leaning on Graft (https://t.co/dF7tiULOIb) for the context side of things, keeping Claude from re-exploring the codebase every session, though that's more about efficiency than catching it before it wrecks something mid-flight. What does your plugin actually do to catch that?
For me, it's Claude Code. I'm building basically everything with it at this point.
Also running Graft alongside it (https://t.co/zkByeuYexA) - it maps the codebase into a knowledge graph so Claude isn't re-exploring from zero every session. Been genuinely useful.
🚧 Builder's Log #006: The Hero That Was Ready and Wasn't Allowed to Show
The homepage Hero's headline was already rendered. It just wasn't allowed to appear.
The text sat at opacity: 0, waiting on a GSAP timeline to reveal it, a fairly standard scroll-reveal pattern. Except this element isn't three screens down. It's the first thing on the page. The timeline had a hardcoded delay: 1, a full second of nothing before the 1.47-second reveal even starts.
I pulled the Lighthouse LCP breakdown to check. elementRenderDelay was landing around 1000-2200ms. timeToFirstByte was about 300ms. The server wasn't the problem. The network wasn't the problem. The text was ready to paint almost immediately. It just wasn't allowed to, by design, for over a second.
Removed the delay. LCP dropped hard.
A scroll-reveal animation rests on one assumption: the element isn't in the viewport yet, so hiding it until the user scrolls there is invisible to them. That's a completely reasonable assumption for a card three screens down.
It silently breaks for anything already in the initial viewport. Hiding something the user is looking at right now isn't a UX flourish; it's just hiding it. Nothing in the codebase, or in most component libraries, distinguishes "safe to hide-then-reveal" from "already visible, don't hide this." The same utility class works fine in both places, syntactically. It just quietly taxes your LCP score in one of them.
The hunt
Once the Hero was fixed, I grepped for the same shape: a fadeup/reveal class sitting on an image also marked priority={true}, Next.js's explicit "load this first" signal.
Found it eleven times: the about-us hero, the careers hero, the contact hero, every blog post's featured image, the Saudi Arabia landing page (twice), and all five what-we-do service detail pages. Not because anyone kept independently making the same mistake. Building a new page usually means copying the last page's hero section, and the animation class rides along for free with everything else.
The twist
On the /what-we-do listing page, I found an image with the reveal class. Its priority prop was commented out in the source, so I reasoned: if priority's off, it must be below the fold, that's intentional.
Wrong. Next.js's <Image> defaults to lazy-loading whenever priority isn't set. The commented-out prop hadn't disabled anything; it was already off by default. Lighthouse's own breakdown for that page named that exact image the LCP element: a 742ms resourceLoadDelay, the textbook fingerprint of lazy-loading something that's actually above the fold.
I'd trusted a code comment over a measurement.
Animation utility classes and loading-priority props are two independent axes, and nobody's codebase keeps them in sync. The failure is invisible in a code review, and it looks like completely normal, working code, because it is working code, just running against an assumption that doesn't hold for that instance.
The only way to catch it is checking the LCP breakdown of the actual rendered page, not the component that produced it.
#react #frontend
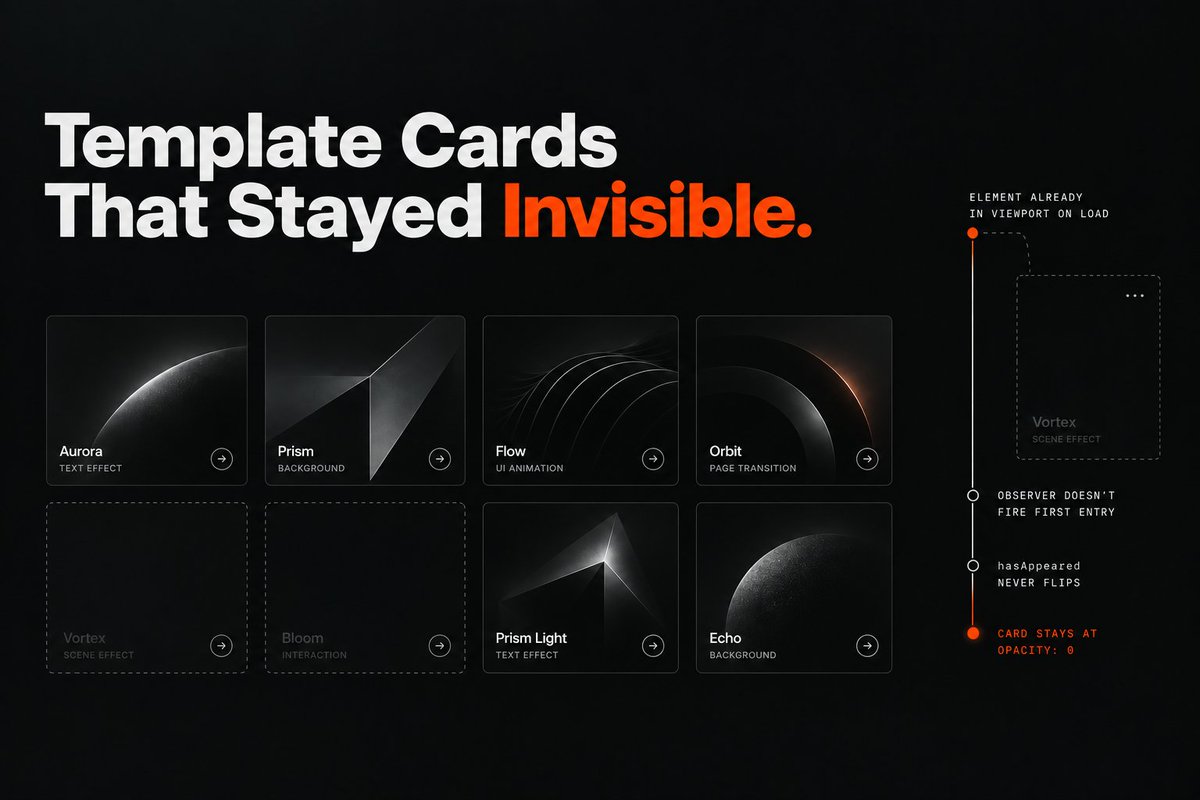
🚧 Builder's Log #005: Template Cards That Stayed Invisible
New templates listing in Hyperiux Vault. Cards render, then some of them just stay at opacity: 0.
Not all of them, only the ones already in the viewport when the page loads.
EffectCardNew gates its fade-in behind an IntersectionObserver. hasAppeared flips to true once the card crosses into view, and the animation plays. I confirmed it directly by reading the computed opacity and the character-level SplitText state straight out of the DOM instead of guessing.
For a card already inside the viewport on mount, the observer doesn't reliably fire that first entry, so hasAppeared never flips and the card sits there invisible.
I forked a separate TemplateCard component instead of fixing the observer.
At the time, that felt like the right call. Two components each handling one concern seemed better than one component branching on two.
But the original bug is still sitting in EffectCardNew, live on the effects catalog, and I never went back to fix it.
That's real debt. "Worth fixing separately" is easy to write in a commit message and easy to let quietly mean never.
Naming it here so it doesn't.
#React #Frontend
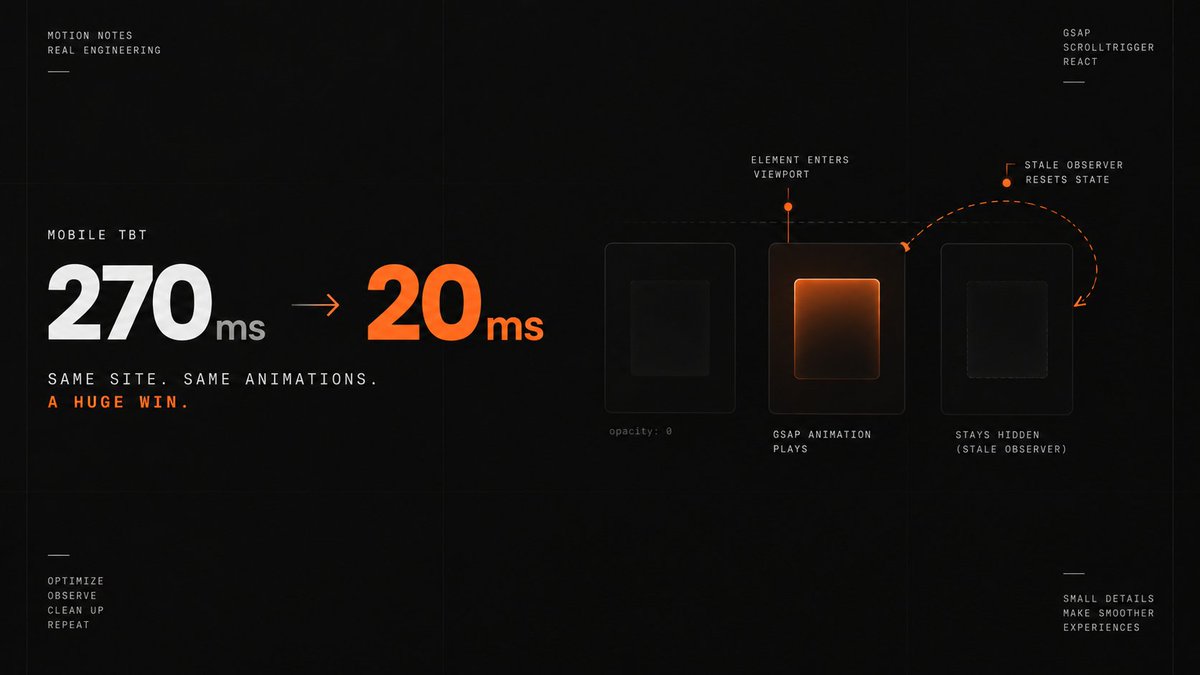
🎬 Motion Note - The Best Number in the Whole Project Also Broke Half the Animations
Deferred GSAP/ScrollTrigger setup on a site until each element actually entered the viewport, instead of wiring it up on mount. Mobile TBT dropped from 270ms to about 20ms, the best single number in the whole audit.
Then a few animations broke.
I wasn't disconnecting the IntersectionObserver on cleanup. React Strict Mode's mount → cleanup → mount cycle in dev left stale observers behind, and a stale observer could set an element back to its invisible starting state without the animation ever running to finish it. The element just stayed hidden.
Reproduced it, added the cleanup, and fixed it properly.
Strict Mode double-invocation is the kind of gotcha that's easy to miss when a win like 270ms → 20ms is sitting right in front of you. It's the first thing I check whenever I use IntersectionObserver now.
#React #Frontend
@ApogeeIS Yep, this is the other half of the problem. The WordPress side can introduce a lot of variability too, especially when PHP workers, object caching, cron, or plugins get involved. In our case, checking TTFB first helped separate the backend/cache issue from the frontend.
This is my final version.
Why does my Lighthouse score keep changing?
Same page, same code, two runs back to back, and TBT & LCP swing by hundreds of milliseconds.
On a Next.js + WordPress site, most pages are statically generated with ISR, cached HTML, served instantly. But dynamic routes use fallback: 'blocking', so the first request after a page goes stale has to wait on a live WordPress fetch before Next.js can respond at all.
Land on that window, and Lighthouse measures a slow TTFB from a cold WordPress query. Land a minute later, and the same page loads from cache in milliseconds. The frontend didn't change between runs. The cache state did.
Before you touch animation timing or bundle size to chase a Lighthouse regression: check TTFB first. A swinging score is usually a caching problem.
#Nextjs #WebPerformance
@akinyemi_t@PafCore Yeah, that makes it even harder to diagnose. If the underlying data or backend response is changing between runs, you can end up chasing frontend changes that aren't actually responsible. Testing the same conditions more than once is definitely worth it.