1st project in #python! I made a map of power utilities’ potential to spark #CaliforniaFires via power lines. Explore the interactive map & see which ⚡️ providers to hold accountable (desktop recommended for now) @ https://t.co/cd9RPeUB9q
(I took the 🔥 pic from i-5 last week)
75 years ago the world saw the catastrophic humanitarian consequences of nuclear weapons. It must not happen again. Only nuclear zero is worthy of the victims of Hiroshima & Nagasaki. PM Ardern urges all States to join the Treaty on the Prohibition of Nuclear Weapons #nuclearban
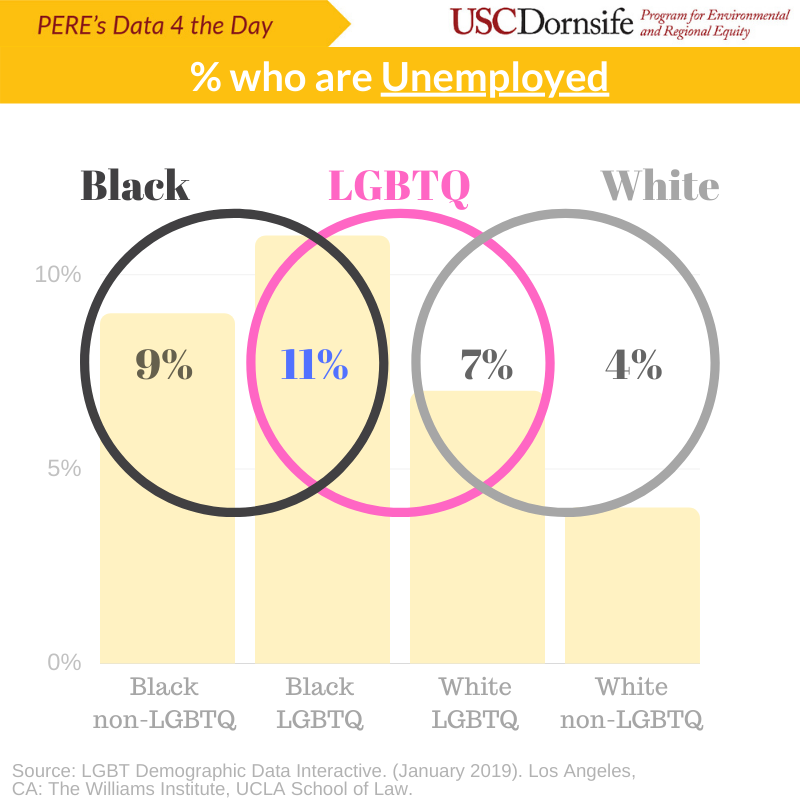
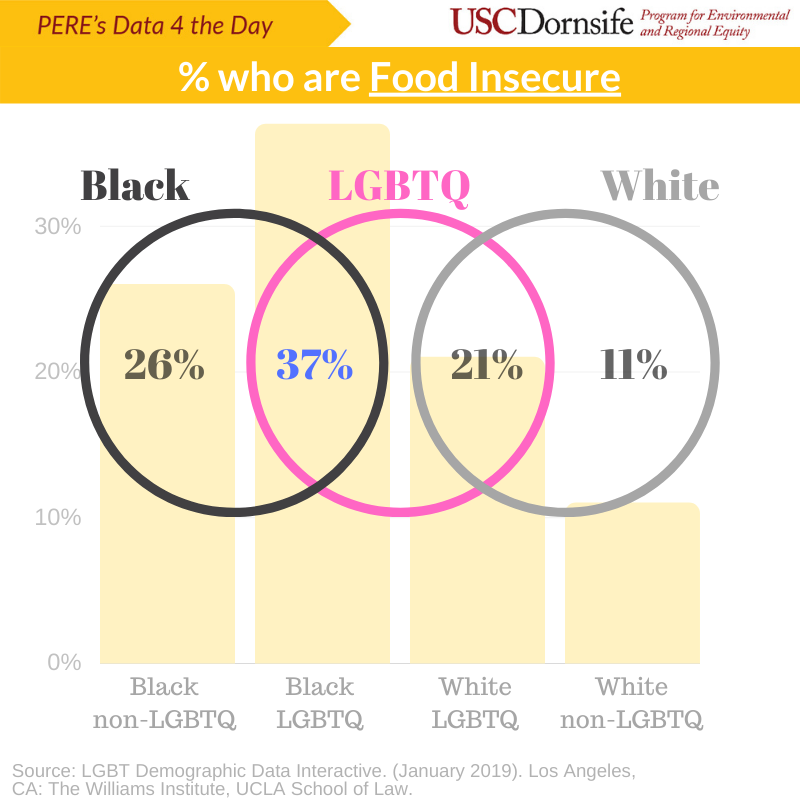
#Data4theDay: As we close out Pride Month, take a look at a few ways in which both racism and homophobia/transphobia intersect to make life more difficult for Black LGBTQ. Data from UCLA Law's @WilliamsPolicy Institute.
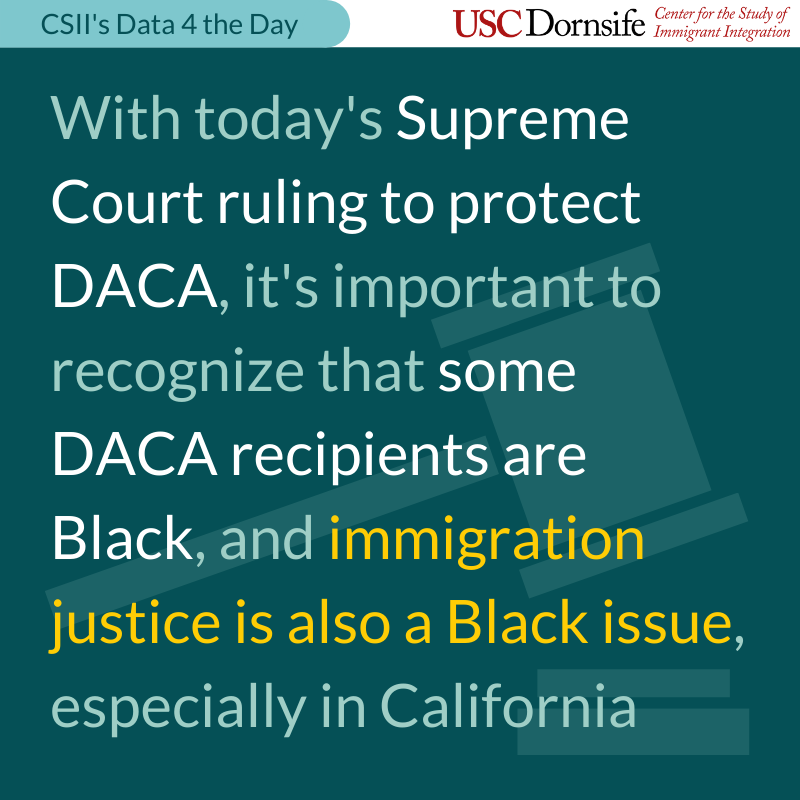
With the #SCOTUS ruling on the eve of Juneteenth, let's remember that Black immigrants are an important part of our communities. Check out @BAJItweet for more on justice for Black immigrants. #USCCSII#d4td#DACA#BlackLivesMatter
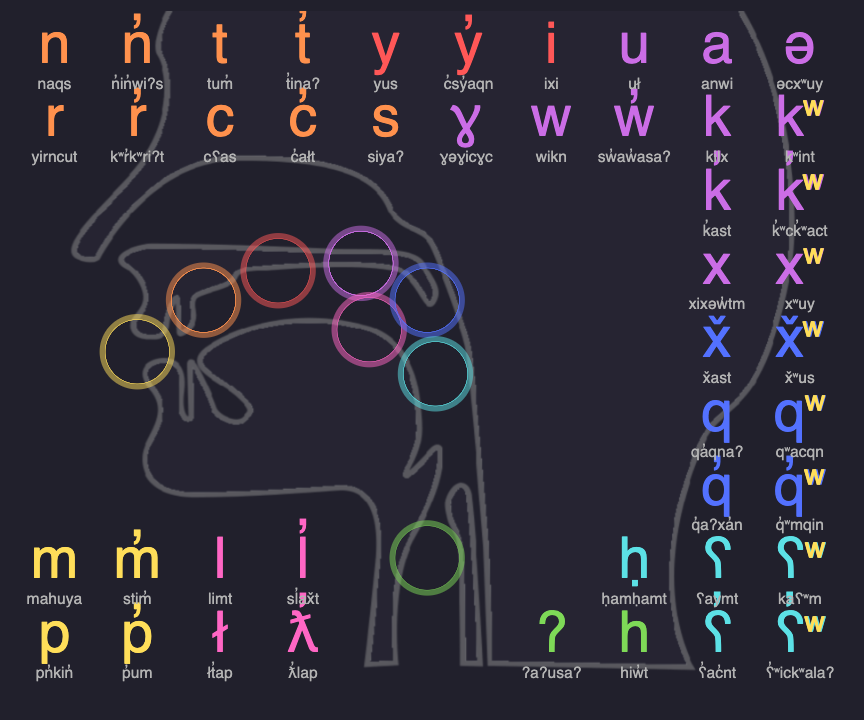
A silver-lining for me in this crisis: I have the chance to study my ancestral language, Okanagan Salish (nsəlxcin) online w other learners! I put my #rstats#dataviz to work in building an interactive audio tool to help learn the alphabet.
Check it out @ https://t.co/cd9RPeUB9q
Just got my @pinakographos Columbia river system transit-style map! Reminds me of home, growing up along the Okanogan. Water sure is a great way to see the land!
#Australia temperature over the past 70 years for biggest 3 cities. Inner rings are median annual average daily highs, outer rings are with a +2C #climate warming above the "norm"
Code: https://t.co/sLO4j3pvpW
#BushFireCrisisAustralia#rstats#tidytuesday
Getting the shape was a horror movie itself! Also, this is from a dataset of about 3k horror movies released globally between 2012-17. These are the top 666 words 🧟♂️
my 2nd #TidyTuesday! looking into horror movie data 🦇
Size = # of movies' title or logline the word appeared in.
Intensity = mean review rating for movies the word is associated with.
My 1st time doing text analysis & word clouds in R!
Code posted soon: https://t.co/sLO4j3pvpW
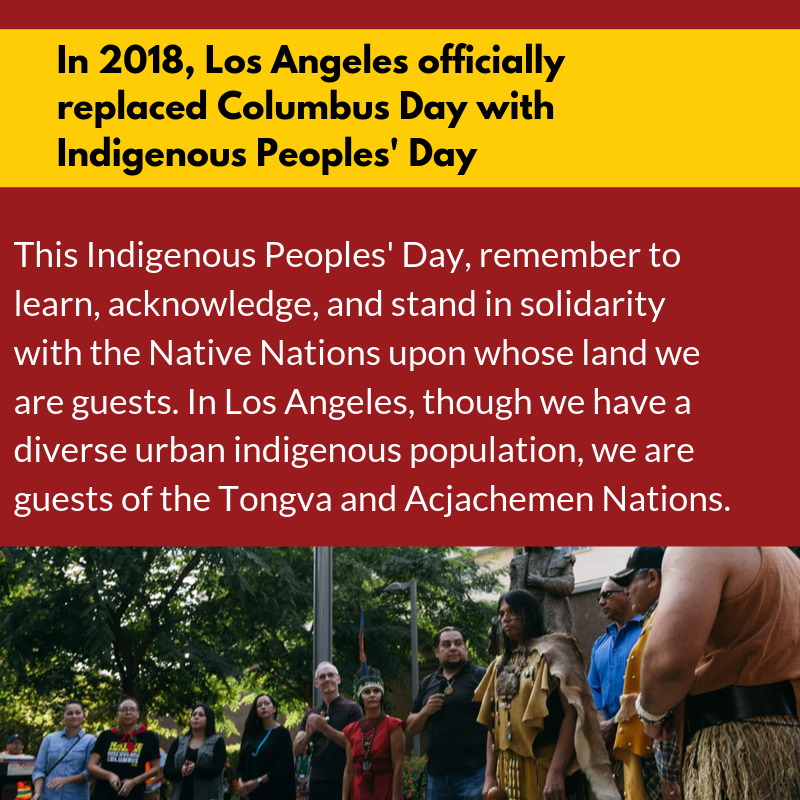
Thanks to Native activists, LA officially replaced Columbus Day with #IndigenousPeoplesDay last year. However, there is still much work to be done to achieve #equity for the Native community, as highlighted by the #homelessness stats here. #Data4theDay#USC#PERE
baby's 1st #TidyTuesday! looking into Moores Law. A little late, so posting what I have so far. My 1st time exploring gganimate & working with log axis labels. Theres a lil glitch with the CPU label ~2008 n later - ideas on what it could be? Link to code: https://t.co/sLO4j3pvpW
One of our newest @PERE_USC staff, Lance Hilderbrand, contributed to this study finding higher rates of cancer in a predominantly Black community near petrochemical facilities. Little wonder they call it "Cancer Alley" -- & little wonder we hired Lance.
https://t.co/Ry1PHzNXmt
BREAKING: We just released "'Waiting to Die:' Toxic Emissions and Disease Near the Louisiana Denka/DuPont Plant" - new evidence of unusually high rates of cancer and other illness among predominantly Black residents living next to Denka plant in Louisiana: https://t.co/cuXuRYb44v
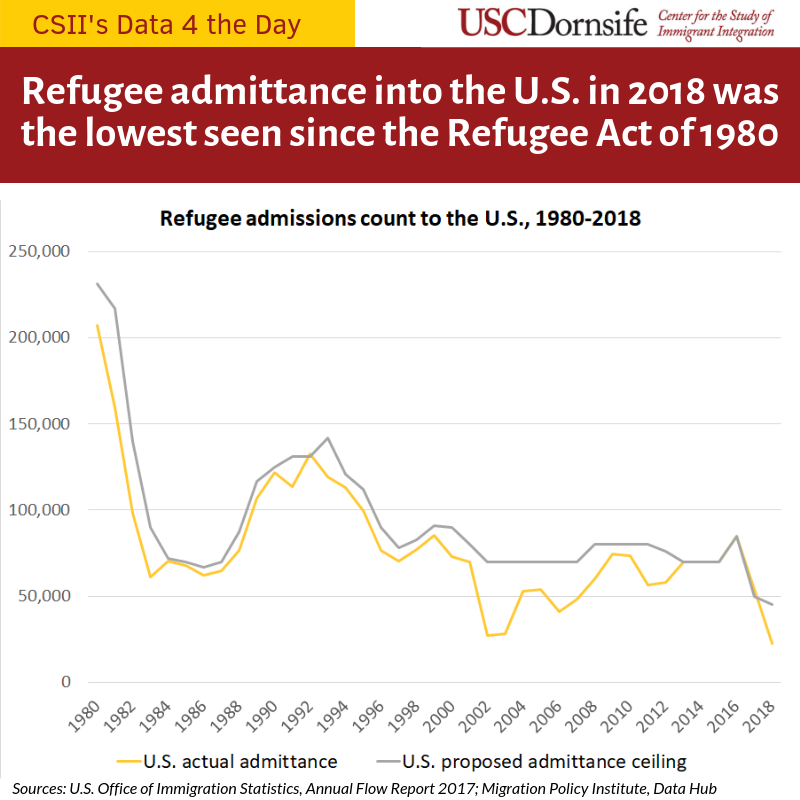
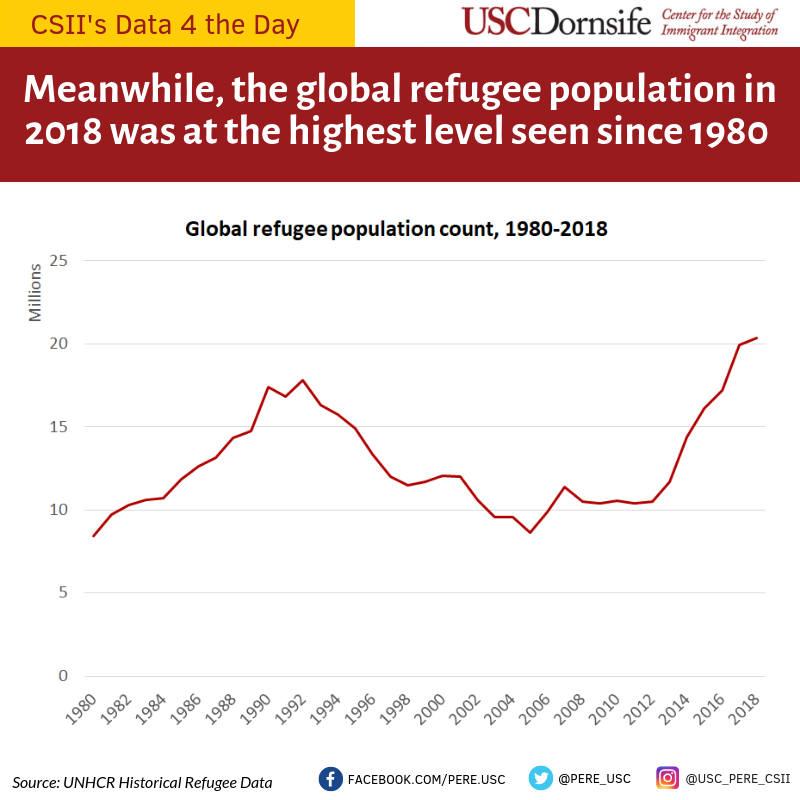
Data 4 the Day: under the Trump Administration, admittance of refugees into the U.S. has plummeted to the lowest levels seen since The Refugee Act of 1980, yet the global refugee population is at its highest level recorded in that time. #PERE#CSII#data4theday#dataviz#refugees
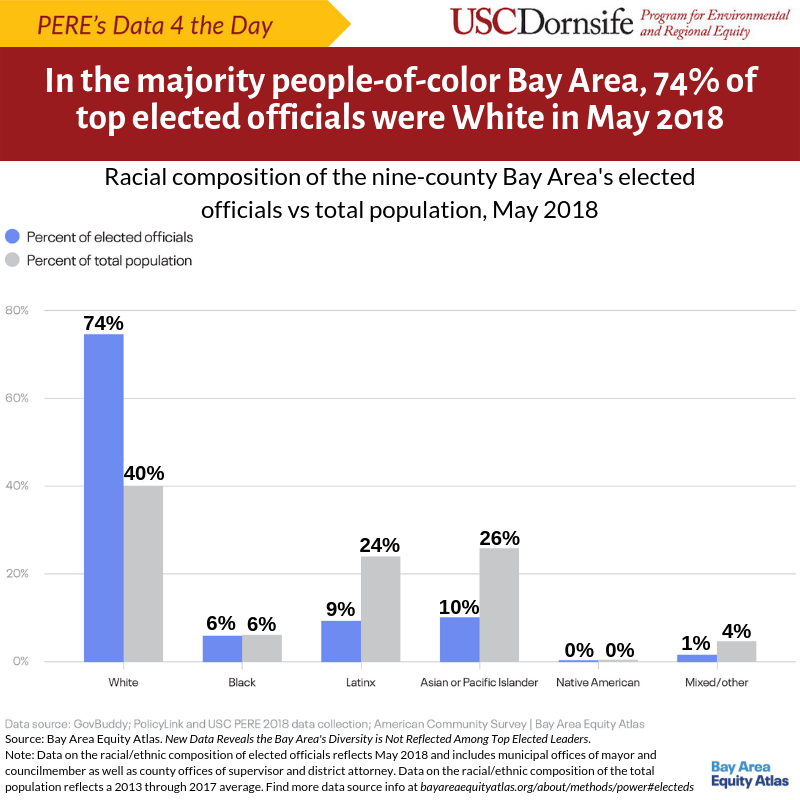
#Data4theDay: a new report on the Bay Area Equity Atlas details the underrepresentation of POC among top elected officials in the Bay Area. Check out the report and maps at https://t.co/BUdv7Qm5L7 #PERE#CSII#dataviz#racialequity#bayarea#research