📊 GM iCrypto folks!
It's been a while you know. Even though life must go on, we’re all still marching toward that same goal in this volatile market. Fortunately, our paths have crossed once again. :)
For those of you diving into FOREX copy trading, this is your new home. Here’s what we bring to the table:
- Hand-pick the top-notch bots with proven track records.
- Share strategic insights to fuel and stabilize your long-term growth.
Whether you’re a total newbie or a seasoned pro in FOREX, you’re more than welcome to join.
📌 Join us here: https://t.co/8K8W84VwwR
💰 Lately, I've been thinking about this challenge: turning $500 into $50K — and maybe even $500K later 👀
And now, I'm about to do it :D
--> So... hope to see you guys at this channel: https://t.co/8K8W84UYHj
At this stage, I’ll focus on finding and sharing copy trading strategies that match that exact goal.
Starting tomorrow, guys 🚀
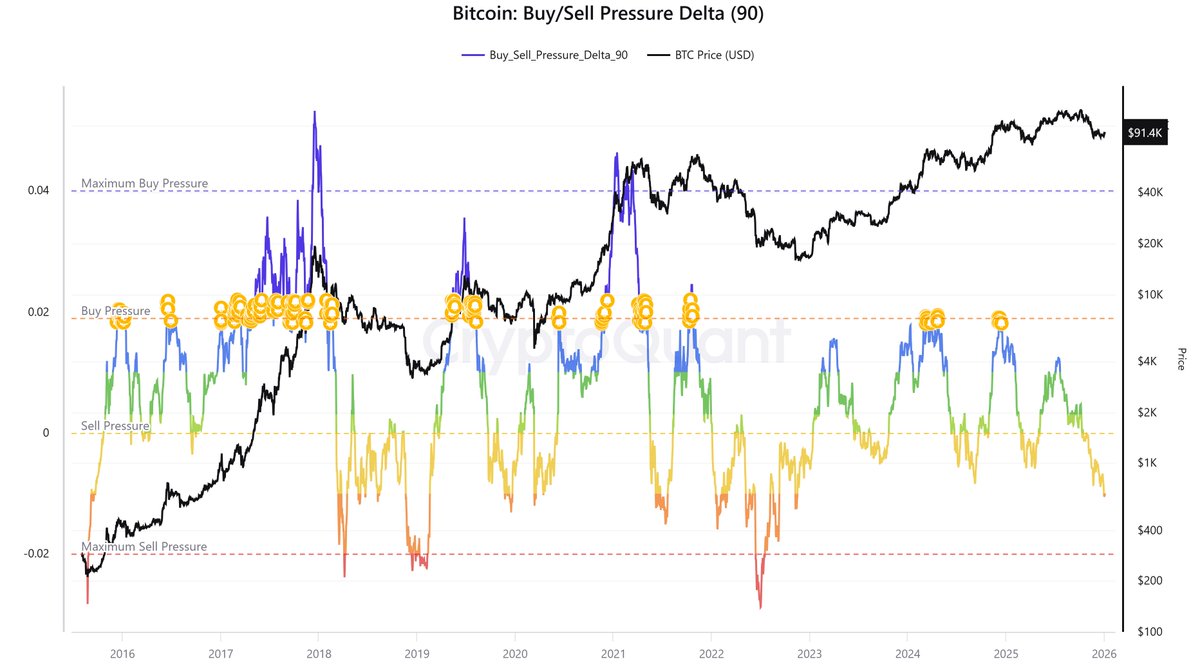
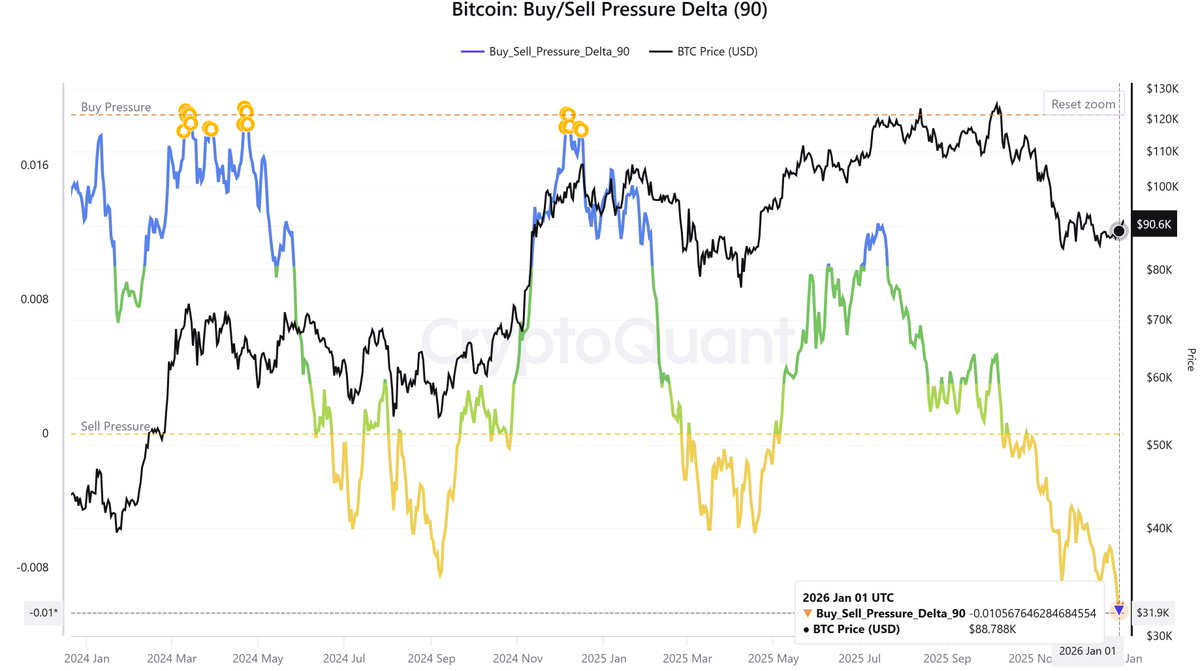
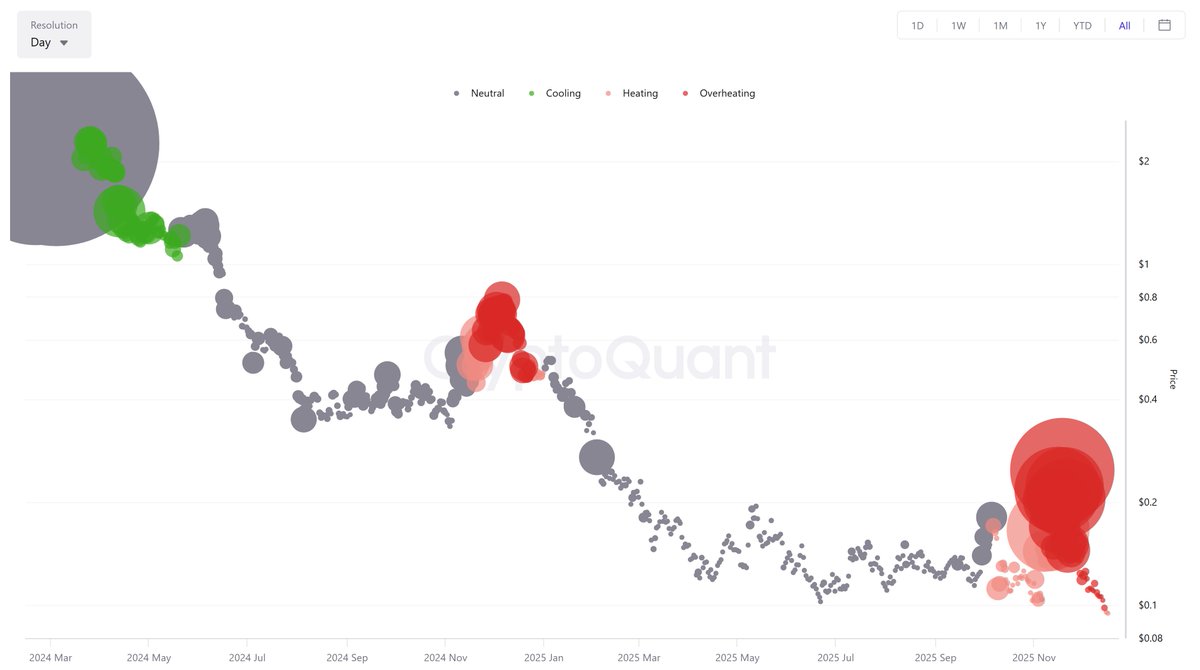
$BTC is currently in the orange zone 🍊🍊🍊 where selling pressure is gradually exhausting (deepest level = red).
Chart: “Buy Pressure Delta Alert" by CryptoQuant.
How much BTC have you accumulated so far?
Or are you waiting for it to reach the red zone?
$BTC has been in the orange zone for 7 days already.
Sorry for forgetting to remind you about this signal earlier.
P/S: If you’re following this signal, what we’re waiting for is the color, not the price
$CAKE you asked
Spot Vol Bubble Map shows:
High volume + weak price
→ distribution isn’t over yet. Looks like there have been multiple liquidity traps to let older holders exit.
If it were me, I’d use any technical bounce to exit / take profit, then stay on the sidelines and observe 😄
$CRV you asked
Spot Vol Bubble Map shows:
- CRV has gone through at least 2 clear distribution phases
- Big money hasn’t returned sustainably yet (price down + green cooling bubbles). Need more time to see if it can base/sideways.
→ Better suited for:
- Watching for now (easy to get capital stuck) <=> add to watchlist
- Or short-term trading: buy sharp dips, sell the rebounds
$SEI – you asked
Spot Volume Bubble Map Analysis:
- $SEI is still in the Distribution / Downtrend phase, with price continuing to make lower lows.
- No signs of a new Markup cycle yet.
- Volume spikes without price follow-through → more likely distribution (selling) rather than accumulation.
👉 Worth reviewing again only when:
1. Deep Cooling + price consolidates for an extended period
2. Followed by strong Heating with a clear breakout
$UNI – you asked
Late 2025:
- Price drops with Cooling (green) bubbles
- Volume fades with price → no panic selling
=> Selling pressure isn’t heavy, but no strong new inflow yet.
👉So:
» This is mini-distribution inside a range, not a major distribution.
» The old $4–6 zone was real smart-money accumulation —> This time, I’ll watch if price grinds down slowly, shows green/neutral volume, and goes sideways for months there first 😄
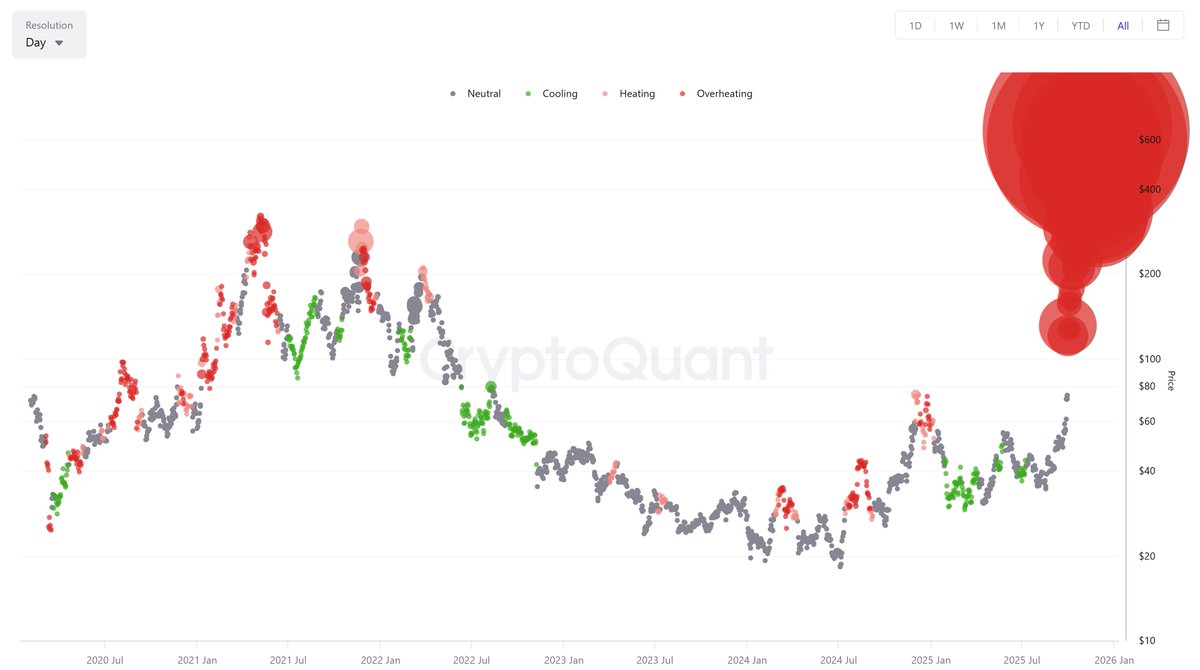
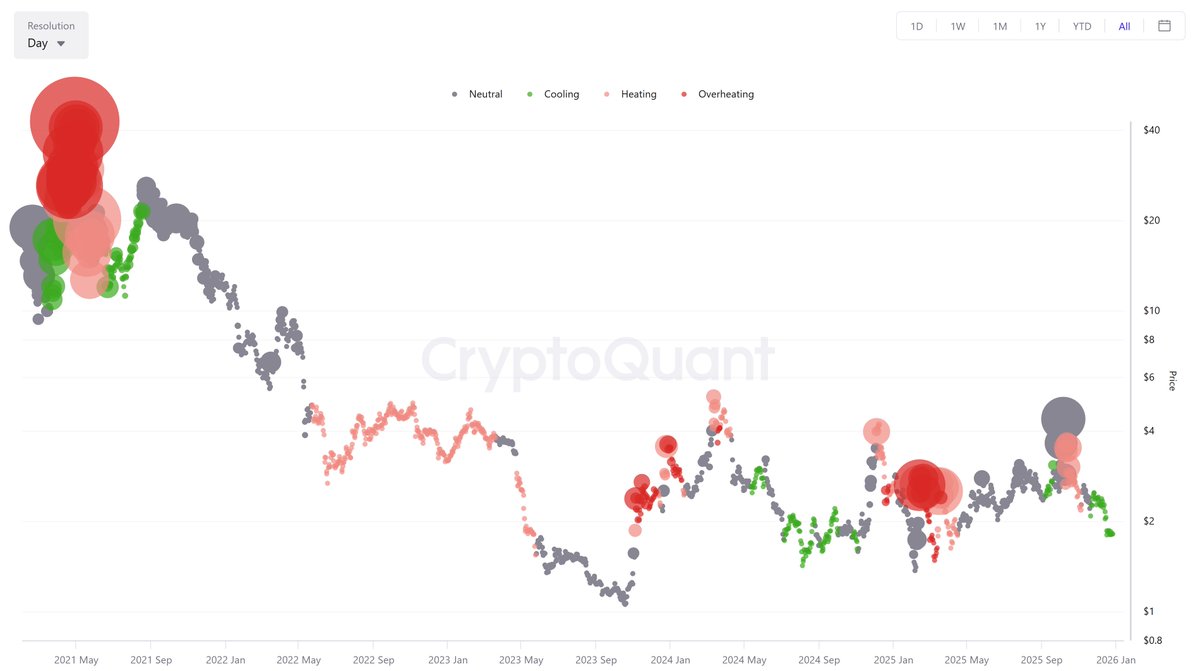
$ZEC Zcash — too hot, might get burned 🔥
• Chart 1: Futures Retail Activity (Trading Frequency Surge): way too many retail traders jumping in.
• Chart 2: Futures Vol Bubble Map: clear overheating — big red bubbles = sudden volume spike.
→ Distribution risk is very high: retail FOMO + volume shock is a bad combo 🔴
⚠️Earlier around $200, there were no cooling or neutral bubbles after the breakout, meaning no healthy accumulation at all.
=> ZEC is likely entering an even stronger distribution phase than 2021.
⚠️Note: This is a mid–long term view, not short term — price may still push higher, but from a cycle perspective, it feels like a good time to take profit and chill 😄
p/s: Not financial advice, as always. Just sharing data and observations.
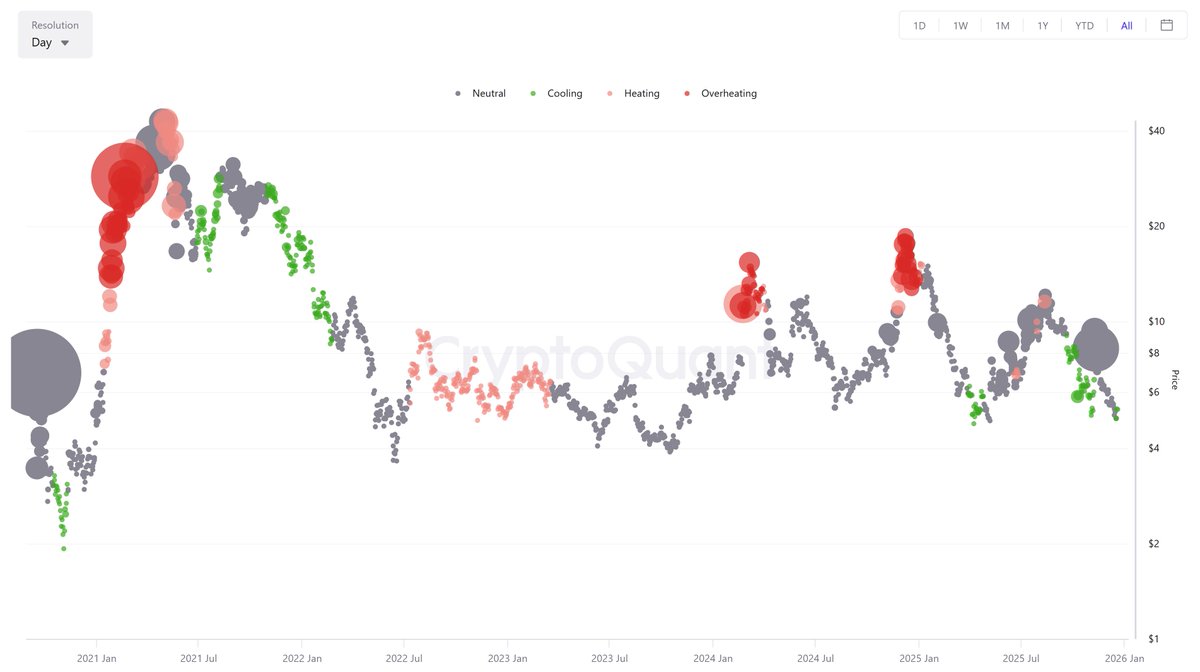
$DOGE and $SHIB — as requested:
Both have already completed the main distribution cycle (2021) and the secondary distribution cycle (2024).
If we see any more dark red (overheating) bubbles going forward, that’s more of an exit opportunity than a signal to expect a new bull run 😄
$PEPE you asked 👀
Looking at the Spot Volume Bubble Map since early 2025:
- Most bubbles turned Cooling (green) or Neutral
- Volume clearly faded, no more big clusters
- Price kept sliding → downtrend
So yeah:
- Speculative money has left
- PEPE is likely:
» Post-distribution
» Lacking fresh upside momentum
» No real accumulation yet (no big volume coming back)
👉 Need volume back before any real pump, not after 🐸
Chart: Cryptoquant
For $INJ to turn back into an uptrend: » Heating (light red bubbles) + price forming a higher low » Avoid early Overheating (dark red bubbles) at low levels — that often leads to a bull trap
Of course, fundamentals still matter. The team needs to keep building through this quiet market — otherwise, anything can change.
$INJ @injective — Can it make a new high? ❤️
Unlike some L1s (ADA / ALGO / …) that went full FOMO → heavy distribution, $INJ has moved through a proper cycle:
Accumulation → Markup → Distribution → Pullback.
The current pullback looks healthy — no signs of capitulation or a dead cycle yet.
Data @cryptoquant_com
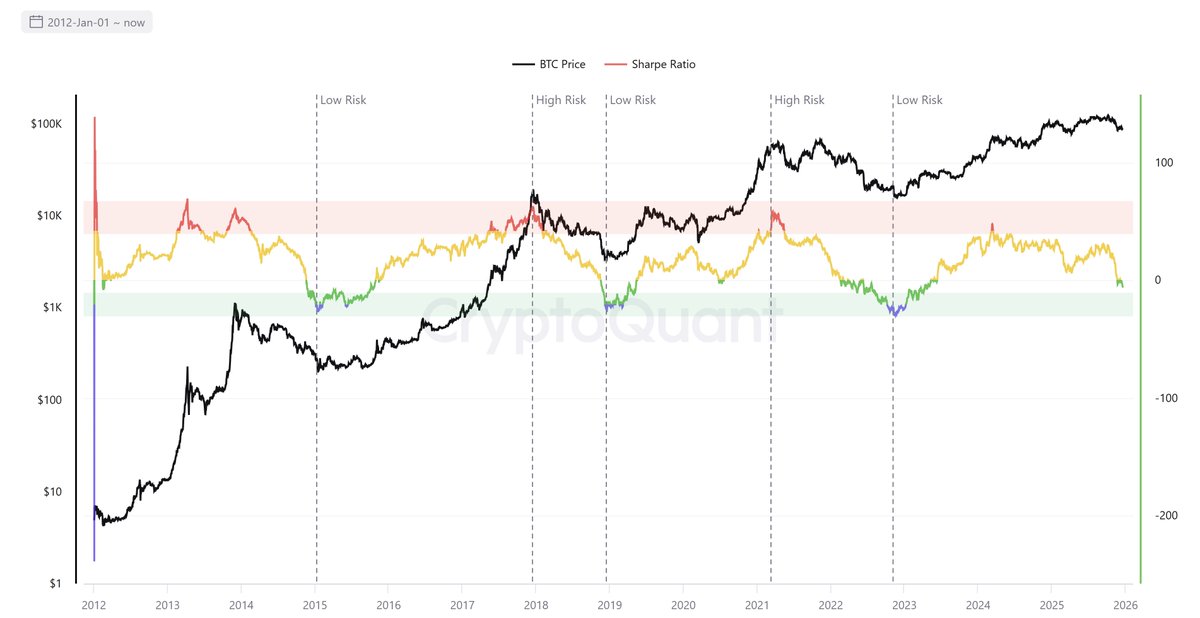
$BTC Sharpe Ratio (Long Term)
When it’s in the green zone, some traders like to optimize profit here (me included), mentally it feels “safe enough”. Worst case, if orders don’t fill, you’re fine just holding spot.
My rules in the green zone:
» Big dips → buy; Big pumps → sell
» No profit → no selling
» Always keep some stablecoins
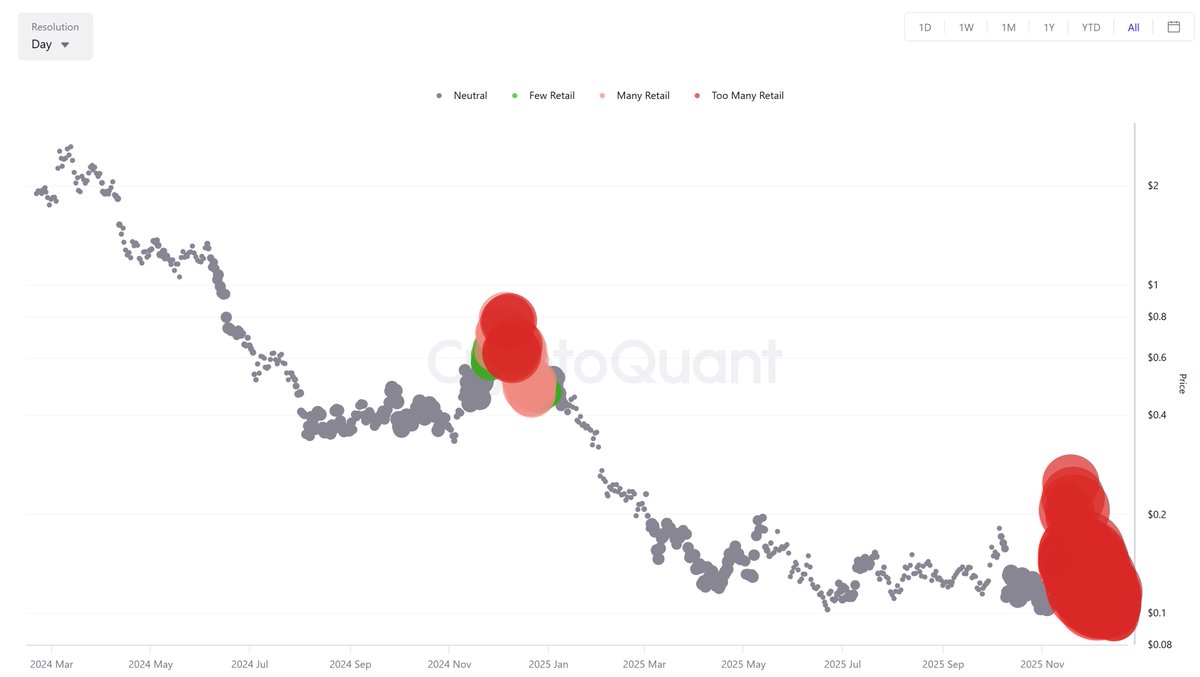
$STRK — bearish 🙃
• P1: Spot Vol Bubble Map: FOMO still isn’t over, even though price keeps dropping.
• P2: Spot Retail Activity (Trading Frequency Surge): too much retail activity at this level (demand is there), but price is still weak → demand can’t absorb the supply.
When both signals show up like this, distribution usually continues — and it can get even more aggressive.
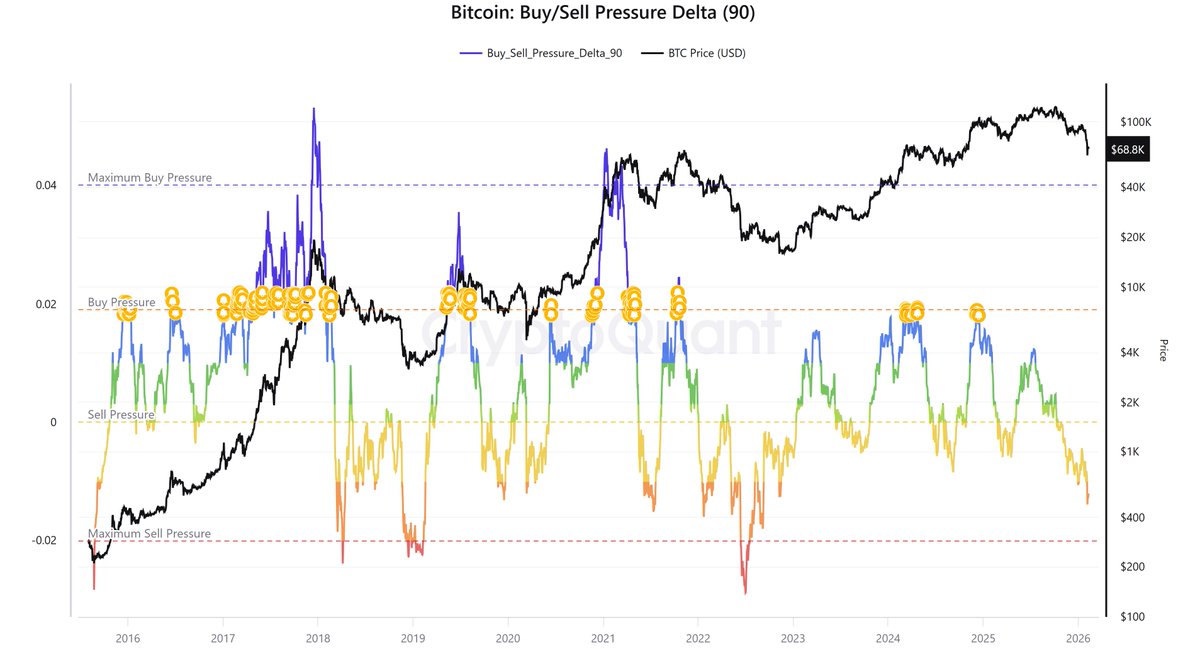
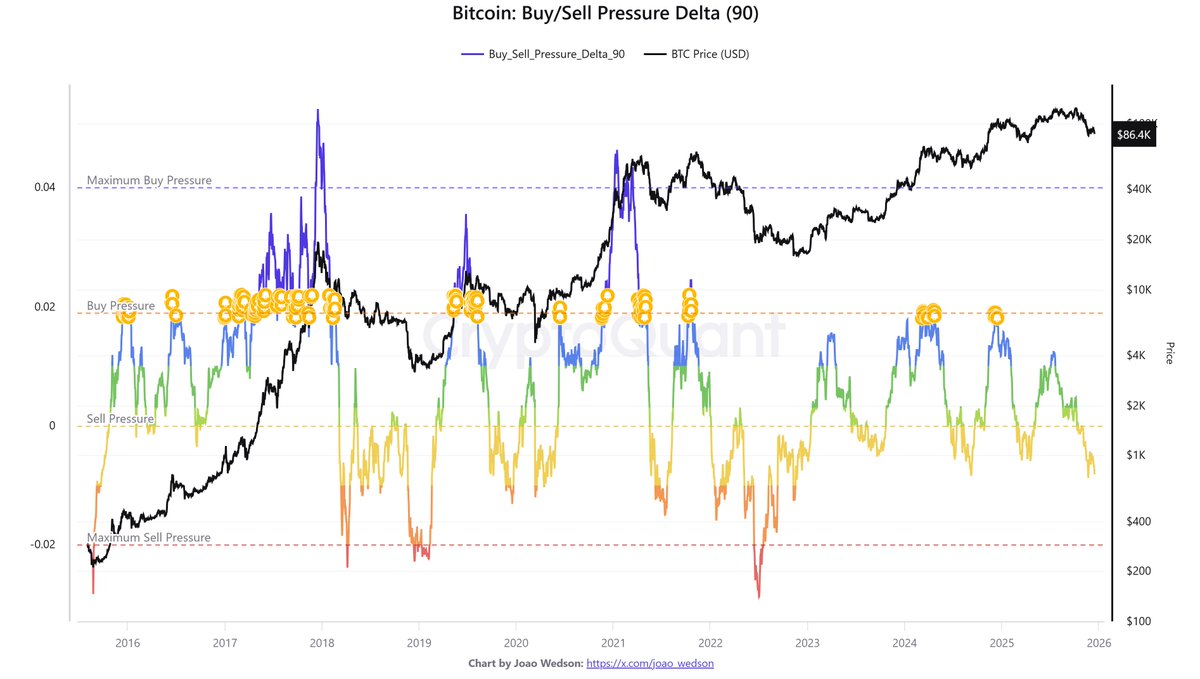
$BTC Buy/Sell Pressure Delta (90)
Still sitting in the yellow zone. If it moves into the orange zone, I’ll give an update.
If I forget, remind me okay? Deal?
(Just asking for some interaction, drop a reply so we survive this downtrend together, boys 😂)
Takeaway: No obvious distribution signals for now. $BCH seems to be in an Early → Mid Markup phase.
=> Meaning: there’s more upside potential, but it’s less “safe” than the 2022–2023 zone, so trade it with a clear plan.
$BCH (Bitcoin Cash) – Still looking healthy
1️⃣ Futures Volume Bubble Map
No extreme overheating yet. Most bubbles are Neutral or slightly Heating.
Volume isn’t going crazy, while price keeps pushing up in a controlled way.
$W Wormhole
Spot Volume Bubble Map:
The FOMO phase is over, but there’s still no clear accumulation yet. The chart looks like it’s bottom fishing, so honestly, I’m not expecting much — best case is some sideways action before thinking further. Probably one to skip for now 😅