🚀 SNIPER AI BETA IS LIVE
We are opening Sniper AI + Scanner Pro to the first 1,000 users.
It is built for Price Action research and stock scanning in the Indian market.
You can scan for:
Breakouts • Support & Resistance • Price + Volume • Candlestick Patterns • Chart Patterns • Multi-Timeframe Setups
This is still a Beta, so your testing and feedback will help us improve it. 🎯
Want access to Sniper AI Beta?
🔁 Retweet the first post
💬 Comment “SNIPER”
I’ll send the access details in DM.
If you find any bug or wrong result, simply send me the query + result + screenshot so we can fix it.
First 1,000 users only. 🎯
For educational and research purposes only. Not investment advice.
Took a setup-based position in #NIFTY 25750 PE at 73.
Market opened 235 points gap down.
Option exploded to 220+.
This is what happens when process > emotions.
Patience pays. 📈
A clean Bullish move captured in Nifty about 1 : 4 Risk to Reward using Adaptive Support and Resistance indicator.
Continuing to give FREE access to the indicator so you traders can find the clue and understand the opportunity.
Like & Retweet to get the indicator link in DM
New Customised Trading View INDICATOR is ready 🎉 with Automatic Support/Resistance
For all Type of Traders - Intraday, Positional,Option,Cash ,MCX
Find Entry/exit, Reversal, etc.
To get FREE access 👇
Like & Retweet this tweet
Follow me @learntotrade365
Comment - INDICATOR
🤖 BREAKTHROUGH: I just released a revolutionary AI-powered trading indicator that LEARNS from market data!
✨ What makes it special?
Automatically optimizes indicator weights based on REAL performance
Tracks the accuracy of SuperTrend, MA, VWAP & Linear Regression
Adapts to market conditions in real-time
Shows exact performance metrics + improvement over static indicators
⚡ Features:
ML engine with configurable learning parameters
Dynamic weight adjustment based on prediction accuracy
Smart signal generation (Strong Buy/Sell + regular signals)
Comprehensive performance dashboard
4 technical indicators fused intelligently
🎁 FREE INDICATOR: I'm sharing this with everyone who RETWEETS + LIKES this post! More importantly, send a DM mentioning your TradingView ID.
No more guessing which indicators work best - let AI optimize them for you automatically!
🔗 Check it out: https://t.co/jfoTw8Nli9
#TradingView #MachineLearning #TradingIndicator #AITrading #TechnicalAnalysis #Trading #Forex #Crypto #Stocks #Algorithm
Most Intraday Banknifty & Nifty traders use VWAP.
VWAP + PIVOT POINT COMBO which includes,
🟢 Marking the Zones
🟢 Intraday Trading Strategy
🟢 Catch Trend & Reversal
VWAP + PIVOT POINT is a Fabulous Combo
Learn for FREE in next 10 minutes.
Click on "Show More" to read fully
Like & Retweet is appreciated
1] How to Mark the VWAP + Pivot points Combo Zone ?
I am marking the zone after first 5 minutes and when VWAP & any Pivot Points are closer. [ Refer the 4 charts to understand ]
Also the same VWAP + Pivot point zone can be used to identify DIRECTION,
Price Trading Near and Above the Zone - BULLISH
Price Trading Near and Below the Zone - BEARISH
Now i try to take Multiple-Confirmation from charts to identify the correct direction of Banknifty & Nifty.
Chart 1 - Around the VWAP + Pivot point combo zone i look for rejection & pullback rejection.
In Chart 1 along with the price rejection at the zone , price struggled to move above R1 shows the bulls weakness with Price trading below the zone. [ This is Multiple confirmation ]
Multiple Confirmation in favour of same direction always gives confidence to take trades.
Most traders Lack Confidence because of not believing in charts. [ From my Experience Trust the Chart rest is Noise ] .
Fact is even i lacked confidence in initial days of trading [ Be Honest to improve trading to next level - Learned from experience ]
Chart 2 - Example for Pullback Rejection gives the best Low Risk High Reward Opportunity.
Price Near and Above the zone - This gives me a direction hint so next nearest pullback i use it as a directional opportunity.
Chart 3 - Very good example were price made a Gap Down of more than 2%.
Common question after Gap Down is whether price will continue down or will it reverse to fill GAP ?
Check the Chart 3 - Gap down & after first 5 min candle close - S4 & VWAP is very close this becomes ZONE.
Price immediately rejecting from the zone with Price Trading Near and above the zone obviously means BULLISH.
Multi-confirmation [ Rejecting from the zone + price above vwap with bullish rejection] gives confidence to go with the chart direction.
Chart 4 - Example were Zone is WIDER
As the zone is wider chance of sideways is possible. So i will focus only on Pullback rejection.
How to identify the VWAP + PIVOT POINTS is wider or good in banknifty ?
Range is more than 80 points [ 0.2% ] means WIDER.
Timeframe used is 5 minutes only.
Learn - Upgrade - Earn
If you find this tweet useful kindly share with traders by 𝗟𝗶𝗸𝗲 & 𝗥𝗲𝘁𝘄𝗲𝗲𝘁 this tweet.
Follow me @learntotrade365 for more and more learning content, strategy.
Also to get Live Market updates of Banknifty/Nifty levels during live market by joining the free telegram channel [ Special Private Telegram Channel only for ACTIVE & PASSIONATE Traders ] - https://t.co/y3IQhA6Dyy
I have shared my observation . Use it for educational & knowledge purpose only.
📘 280th ChartBook is Out!
180+ pages of breakout charts, market setups & trading insights.
Released: 21st Sept 📅
Want it in your DM?
✅ Like
✅ Retweet
✅ Comment “ChartBook”
Let’s grow smarter, one chart at a time. 🚀
#ChartBook#MrChartist#StockMarketIndia#Investing


![learntotrade365's tweet photo. Most Intraday Banknifty & Nifty traders use VWAP.
VWAP + PIVOT POINT COMBO which includes,
🟢 Marking the Zones
🟢 Intraday Trading Strategy
🟢 Catch Trend & Reversal
VWAP + PIVOT POINT is a Fabulous Combo
Learn for FREE in next 10 minutes.
Click on "Show More" to read fully
Like & Retweet is appreciated
1] How to Mark the VWAP + Pivot points Combo Zone ?
I am marking the zone after first 5 minutes and when VWAP & any Pivot Points are closer. [ Refer the 4 charts to understand ]
Also the same VWAP + Pivot point zone can be used to identify DIRECTION,
Price Trading Near and Above the Zone - BULLISH
Price Trading Near and Below the Zone - BEARISH
Now i try to take Multiple-Confirmation from charts to identify the correct direction of Banknifty & Nifty.
Chart 1 - Around the VWAP + Pivot point combo zone i look for rejection & pullback rejection.
In Chart 1 along with the price rejection at the zone , price struggled to move above R1 shows the bulls weakness with Price trading below the zone. [ This is Multiple confirmation ]
Multiple Confirmation in favour of same direction always gives confidence to take trades.
Most traders Lack Confidence because of not believing in charts. [ From my Experience Trust the Chart rest is Noise ] .
Fact is even i lacked confidence in initial days of trading [ Be Honest to improve trading to next level - Learned from experience ]
Chart 2 - Example for Pullback Rejection gives the best Low Risk High Reward Opportunity.
Price Near and Above the zone - This gives me a direction hint so next nearest pullback i use it as a directional opportunity.
Chart 3 - Very good example were price made a Gap Down of more than 2%.
Common question after Gap Down is whether price will continue down or will it reverse to fill GAP ?
Check the Chart 3 - Gap down & after first 5 min candle close - S4 & VWAP is very close this becomes ZONE.
Price immediately rejecting from the zone with Price Trading Near and above the zone obviously means BULLISH.
Multi-confirmation [ Rejecting from the zone + price above vwap with bullish rejection] gives confidence to go with the chart direction.
Chart 4 - Example were Zone is WIDER
As the zone is wider chance of sideways is possible. So i will focus only on Pullback rejection.
How to identify the VWAP + PIVOT POINTS is wider or good in banknifty ?
Range is more than 80 points [ 0.2% ] means WIDER.
Timeframe used is 5 minutes only.
Learn - Upgrade - Earn
If you find this tweet useful kindly share with traders by 𝗟𝗶𝗸𝗲 & 𝗥𝗲𝘁𝘄𝗲𝗲𝘁 this tweet.
Follow me @learntotrade365 for more and more learning content, strategy.
Also to get Live Market updates of Banknifty/Nifty levels during live market by joining the free telegram channel [ Special Private Telegram Channel only for ACTIVE & PASSIONATE Traders ] - https://t.co/y3IQhA6Dyy
I have shared my observation . Use it for educational & knowledge purpose only.](https://pbs.twimg.com/media/G2A-snibwAAg5TB.jpg)
![learntotrade365's tweet photo. Most Intraday Banknifty & Nifty traders use VWAP.
VWAP + PIVOT POINT COMBO which includes,
🟢 Marking the Zones
🟢 Intraday Trading Strategy
🟢 Catch Trend & Reversal
VWAP + PIVOT POINT is a Fabulous Combo
Learn for FREE in next 10 minutes.
Click on "Show More" to read fully
Like & Retweet is appreciated
1] How to Mark the VWAP + Pivot points Combo Zone ?
I am marking the zone after first 5 minutes and when VWAP & any Pivot Points are closer. [ Refer the 4 charts to understand ]
Also the same VWAP + Pivot point zone can be used to identify DIRECTION,
Price Trading Near and Above the Zone - BULLISH
Price Trading Near and Below the Zone - BEARISH
Now i try to take Multiple-Confirmation from charts to identify the correct direction of Banknifty & Nifty.
Chart 1 - Around the VWAP + Pivot point combo zone i look for rejection & pullback rejection.
In Chart 1 along with the price rejection at the zone , price struggled to move above R1 shows the bulls weakness with Price trading below the zone. [ This is Multiple confirmation ]
Multiple Confirmation in favour of same direction always gives confidence to take trades.
Most traders Lack Confidence because of not believing in charts. [ From my Experience Trust the Chart rest is Noise ] .
Fact is even i lacked confidence in initial days of trading [ Be Honest to improve trading to next level - Learned from experience ]
Chart 2 - Example for Pullback Rejection gives the best Low Risk High Reward Opportunity.
Price Near and Above the zone - This gives me a direction hint so next nearest pullback i use it as a directional opportunity.
Chart 3 - Very good example were price made a Gap Down of more than 2%.
Common question after Gap Down is whether price will continue down or will it reverse to fill GAP ?
Check the Chart 3 - Gap down & after first 5 min candle close - S4 & VWAP is very close this becomes ZONE.
Price immediately rejecting from the zone with Price Trading Near and above the zone obviously means BULLISH.
Multi-confirmation [ Rejecting from the zone + price above vwap with bullish rejection] gives confidence to go with the chart direction.
Chart 4 - Example were Zone is WIDER
As the zone is wider chance of sideways is possible. So i will focus only on Pullback rejection.
How to identify the VWAP + PIVOT POINTS is wider or good in banknifty ?
Range is more than 80 points [ 0.2% ] means WIDER.
Timeframe used is 5 minutes only.
Learn - Upgrade - Earn
If you find this tweet useful kindly share with traders by 𝗟𝗶𝗸𝗲 & 𝗥𝗲𝘁𝘄𝗲𝗲𝘁 this tweet.
Follow me @learntotrade365 for more and more learning content, strategy.
Also to get Live Market updates of Banknifty/Nifty levels during live market by joining the free telegram channel [ Special Private Telegram Channel only for ACTIVE & PASSIONATE Traders ] - https://t.co/y3IQhA6Dyy
I have shared my observation . Use it for educational & knowledge purpose only.](https://pbs.twimg.com/media/G2A-r3WXgAAhuit.jpg)
![learntotrade365's tweet photo. Most Intraday Banknifty & Nifty traders use VWAP.
VWAP + PIVOT POINT COMBO which includes,
🟢 Marking the Zones
🟢 Intraday Trading Strategy
🟢 Catch Trend & Reversal
VWAP + PIVOT POINT is a Fabulous Combo
Learn for FREE in next 10 minutes.
Click on "Show More" to read fully
Like & Retweet is appreciated
1] How to Mark the VWAP + Pivot points Combo Zone ?
I am marking the zone after first 5 minutes and when VWAP & any Pivot Points are closer. [ Refer the 4 charts to understand ]
Also the same VWAP + Pivot point zone can be used to identify DIRECTION,
Price Trading Near and Above the Zone - BULLISH
Price Trading Near and Below the Zone - BEARISH
Now i try to take Multiple-Confirmation from charts to identify the correct direction of Banknifty & Nifty.
Chart 1 - Around the VWAP + Pivot point combo zone i look for rejection & pullback rejection.
In Chart 1 along with the price rejection at the zone , price struggled to move above R1 shows the bulls weakness with Price trading below the zone. [ This is Multiple confirmation ]
Multiple Confirmation in favour of same direction always gives confidence to take trades.
Most traders Lack Confidence because of not believing in charts. [ From my Experience Trust the Chart rest is Noise ] .
Fact is even i lacked confidence in initial days of trading [ Be Honest to improve trading to next level - Learned from experience ]
Chart 2 - Example for Pullback Rejection gives the best Low Risk High Reward Opportunity.
Price Near and Above the zone - This gives me a direction hint so next nearest pullback i use it as a directional opportunity.
Chart 3 - Very good example were price made a Gap Down of more than 2%.
Common question after Gap Down is whether price will continue down or will it reverse to fill GAP ?
Check the Chart 3 - Gap down & after first 5 min candle close - S4 & VWAP is very close this becomes ZONE.
Price immediately rejecting from the zone with Price Trading Near and above the zone obviously means BULLISH.
Multi-confirmation [ Rejecting from the zone + price above vwap with bullish rejection] gives confidence to go with the chart direction.
Chart 4 - Example were Zone is WIDER
As the zone is wider chance of sideways is possible. So i will focus only on Pullback rejection.
How to identify the VWAP + PIVOT POINTS is wider or good in banknifty ?
Range is more than 80 points [ 0.2% ] means WIDER.
Timeframe used is 5 minutes only.
Learn - Upgrade - Earn
If you find this tweet useful kindly share with traders by 𝗟𝗶𝗸𝗲 & 𝗥𝗲𝘁𝘄𝗲𝗲𝘁 this tweet.
Follow me @learntotrade365 for more and more learning content, strategy.
Also to get Live Market updates of Banknifty/Nifty levels during live market by joining the free telegram channel [ Special Private Telegram Channel only for ACTIVE & PASSIONATE Traders ] - https://t.co/y3IQhA6Dyy
I have shared my observation . Use it for educational & knowledge purpose only.](https://pbs.twimg.com/media/G2A-q4ybMAAP-xb.jpg)





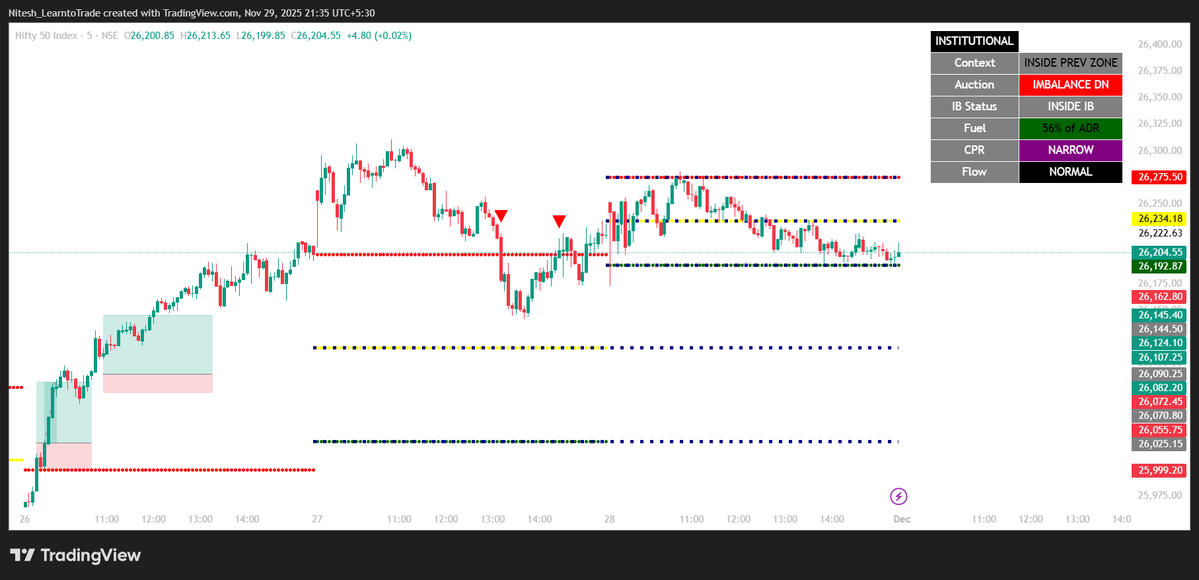

![learntotrade365's tweet photo. Most Intraday Banknifty & Nifty traders use VWAP.
VWAP + PIVOT POINT COMBO which includes,
🟢 Marking the Zones
🟢 Intraday Trading Strategy
🟢 Catch Trend & Reversal
VWAP + PIVOT POINT is a Fabulous Combo
Learn for FREE in next 10 minutes.
Click on "Show More" to read fully
Like & Retweet is appreciated
1] How to Mark the VWAP + Pivot points Combo Zone ?
I am marking the zone after first 5 minutes and when VWAP & any Pivot Points are closer. [ Refer the 4 charts to understand ]
Also the same VWAP + Pivot point zone can be used to identify DIRECTION,
Price Trading Near and Above the Zone - BULLISH
Price Trading Near and Below the Zone - BEARISH
Now i try to take Multiple-Confirmation from charts to identify the correct direction of Banknifty & Nifty.
Chart 1 - Around the VWAP + Pivot point combo zone i look for rejection & pullback rejection.
In Chart 1 along with the price rejection at the zone , price struggled to move above R1 shows the bulls weakness with Price trading below the zone. [ This is Multiple confirmation ]
Multiple Confirmation in favour of same direction always gives confidence to take trades.
Most traders Lack Confidence because of not believing in charts. [ From my Experience Trust the Chart rest is Noise ] .
Fact is even i lacked confidence in initial days of trading [ Be Honest to improve trading to next level - Learned from experience ]
Chart 2 - Example for Pullback Rejection gives the best Low Risk High Reward Opportunity.
Price Near and Above the zone - This gives me a direction hint so next nearest pullback i use it as a directional opportunity.
Chart 3 - Very good example were price made a Gap Down of more than 2%.
Common question after Gap Down is whether price will continue down or will it reverse to fill GAP ?
Check the Chart 3 - Gap down & after first 5 min candle close - S4 & VWAP is very close this becomes ZONE.
Price immediately rejecting from the zone with Price Trading Near and above the zone obviously means BULLISH.
Multi-confirmation [ Rejecting from the zone + price above vwap with bullish rejection] gives confidence to go with the chart direction.
Chart 4 - Example were Zone is WIDER
As the zone is wider chance of sideways is possible. So i will focus only on Pullback rejection.
How to identify the VWAP + PIVOT POINTS is wider or good in banknifty ?
Range is more than 80 points [ 0.2% ] means WIDER.
Timeframe used is 5 minutes only.
Learn - Upgrade - Earn
If you find this tweet useful kindly share with traders by 𝗟𝗶𝗸𝗲 & 𝗥𝗲𝘁𝘄𝗲𝗲𝘁 this tweet.
Follow me @learntotrade365 for more and more learning content, strategy.
Also to get Live Market updates of Banknifty/Nifty levels during live market by joining the free telegram channel [ Special Private Telegram Channel only for ACTIVE & PASSIONATE Traders ] - https://t.co/y3IQhA6Dyy
I have shared my observation . Use it for educational & knowledge purpose only.](https://pbs.twimg.com/media/G2A-to9a0AAw2N_.jpg)


