Still using Gmail or Yahoo for your business? Look more professional with a custom email address like [email protected]. Get up to 15 FREE business email accounts.
Start free today.
Visit Oqumail now.
Chasing multiple women is a waste of time. Dear son, find a good woman. Make her fall in love with you. Grow together. Get married. Have kids. Believe in God. Focus on the things that matter.
Expires Soon
Exceptional Scholarships and Opportunities for international students worldwide are approaching their deadlines. #SRThread
1. Queen Elizabeth Commonwealth Trust Network
Benefit: Training, Access to Resources & Networking
APPLY↙️
https://t.co/E7g7HxzT4q
Said Foundation Scholarship in UK 2026 | Fully Funded
Country: United Kingdom🇬🇧
(i) The United Kingdom is accepting applications for 2026 Said Foundation Scholarship program.
(ii) The scholarship is open to students from selected countries pursuing a Master's degree.
(iii) The Foundation offers fully funded scholarships that cover tuition fees, living expenses throughout the study period, as well as travel allowance for successful applicants.
(iv) The deadline for the application is October 31, 2025
Apply:
https://t.co/JAQBMIM0nI
Study in Finland with Scholarships (BSc, MSc)
The Joint application to higher education, spring 2025
Benefits:
-No application fee
-No GRE
-No essay
-250+ programmes are available in English.
-You can apply for up to six (6) study programmes on one application form
Looking for a remote job? Here are a few websites you should try.
1. Full time jobs- https://t.co/NRDj1EzEex
2. Freelancing - Upwork/ Fiverr
3. Agency- https://t.co/N8WwPRYwID
4. Transcribing- https://t.co/qUPoQSFxni
5. Teaching- Preply/ Nativecamp
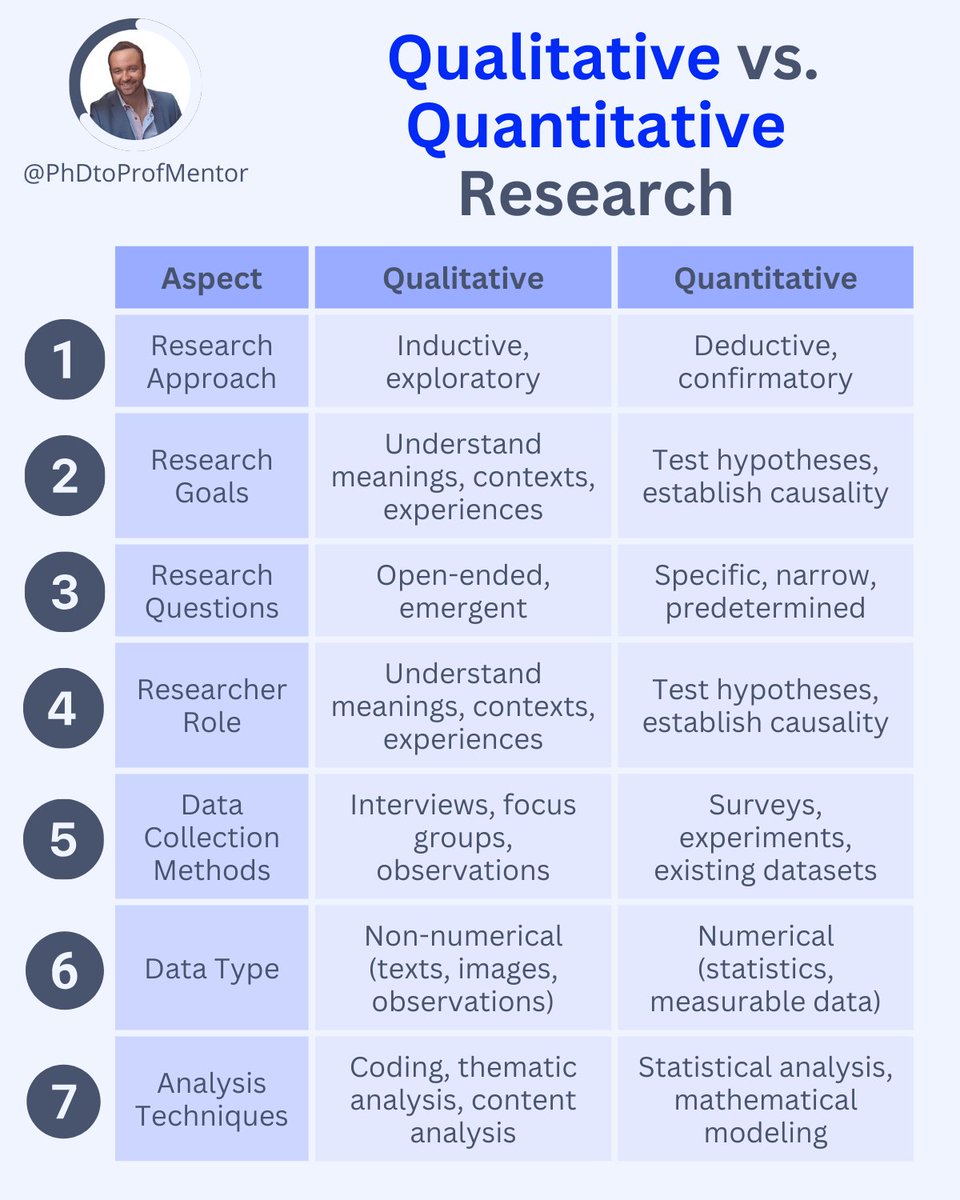
Qualitative vs Quantitative Research → 7 differences you need to know:
Understanding these will help you make informed decisions.
Each approach offers unique insights and outcomes.
Don't ask ChatGPT for any references or citations. It generates fake references to papers that don't even exist.
Instead, use Scite — an AI-powered app designed for researchers.
It answers your questions with references to real, published papers.
Here's how to use it:
TOP 5 REMOTE WEBSITES THAT PAY YOU TO TUTOR ENGLISH ONLINE.
1. https://t.co/lEtzcL9kqc
2. https://t.co/Kl0jndEkb3
3. https://t.co/yEaLCiS23I
4. https://t.co/FsyQ9zPE5C
5. https://t.co/XxnGog6X0u
There's a website called KellyConnect that has numerous jobs from different skill sets. Average pay is $23 per hour and paid after completion of task. Check it out if it suits you!
Bayesian logistic regression is a powerful method for predicting binary outcomes (such as yes/no decisions). It differs from traditional logistic regression by incorporating prior beliefs and quantifying uncertainty using posterior distributions. This makes Bayesian logistic regression ideal for situations where you want to explicitly account for uncertainty or include prior knowledge.
Here’s a breakdown of the four key graphs that provide insights into a Bayesian logistic regression model:
✔️ Posterior Distribution Plot: This plot displays the posterior distributions of the coefficients for predictor1 and predictor2. The shaded area shows the range of probable values (credible intervals), while the vertical line marks the median estimate of each coefficient. Unlike frequentist approaches that provide single point estimates, Bayesian logistic regression gives a distribution of possible values, which allows for a clearer understanding of uncertainty in the model parameters.
✔️ Trace Plot: This shows the trace of the MCMC (Markov Chain Monte Carlo) sampling process over 4000 iterations for predictor1 and predictor2. The traces should ideally look "fuzzy" and well-mixed, moving around the full parameter space without getting stuck. This indicates that the chains have converged and that the model’s parameter estimates are reliable. A poorly mixing chain (one that looks like a straight line or is stuck) would indicate convergence issues.
✔️ Posterior Predictive Check: This plot helps to evaluate the model's predictive performance by comparing the predicted outcomes (y_rep, light blue) with the observed data (y, dark blue). The closer the predicted values align with the observed data, the better the model captures the underlying structure. In this case, the predicted values align well with the observed data, indicating a good fit. This check is crucial for assessing whether the model generates realistic predictions.
✔️ Posterior Interval Plot: This plot visualizes the credible intervals for the model coefficients, including the intercept. The wider the credible interval, the more uncertainty there is in that coefficient estimate. Both 50% (inner) and 95% (outer) credible intervals are shown, providing a range of probable values for each coefficient. If a credible interval includes zero, it means the predictor may not have a strong effect on the target variable.
This grid of graphs allows for a comprehensive understanding of your Bayesian model, showing how well the model fits the data and how much uncertainty there is in the parameter estimates. Bayesian logistic regression provides a richer interpretation than traditional methods by quantifying uncertainty and incorporating prior knowledge into the analysis.
Want more insights on data science? Subscribe to my free email newsletter! Further details: https://t.co/X93SeCeygJ
#VisualAnalytics #Python #datavis #database #RStats
THE 48 LAWS OF POWER
1.Never outshine the master.
2.Never put too much trust in friends, learn how to use enemies.
3. Conceal your intentions.
4.Always say less than necessary.
5. So Much Depends on Reputation – Guard it with your Life.
6. Court attention at all costs.
7. Get others to do the work for you, but always take the credit.
8. Make other people come to you; use bait if necessary.
9. Win through your actions, never through argument.
10. Infection: avoid the unhappy and unlucky.
11. Learn to keep people dependent on you.
12. Use selective honesty and generosity to disarm your victim.
13. When asking for help, appeal to people's self-interests, never to their mercy or gratitude.
14. Pose as a friend, work as a spy.
15. Crush your enemy totally.
16. Use absence to increase respect and honor.
17. Keep others in suspended terror: cultivate an air of unpredictability.
18. Do not build fortresses to protect yourself. Isolation is dangerous.
19. Know who you're dealing with; do not offend the wrong person.
20. Do not commit to anyone.
21. Play a sucker to catch a sucker: play dumber than your mark.
22. Use the surrender tactic: transform weakness into power.
23. Concentrate your forces.
24. Play the perfect courtier.
25. Re-create yourself.
26. Keep your hands clean.
27. Play on people's need to believe to create a cult like following.
28. Enter action with boldness.
29. Plan all the way to the end.
30. Make your accomplishments seem effortless.
31. Control the options: get others to play with the cards you deal.
32. Play to people's fantasies.
33. Discover each man's thumbscrew.
34. Be royal in your fashion: act like a king to be treated like one.
35. Master the art of timing.
36. Disdain things you cannot have: Ignoring them is the best revenge.
37. Create compelling spectacles.
38. Think as you like but behave like others.
39. Stir up waters to catch fish.
40. Despise the free lunch.
41. Avoid stepping into a great man's shoes.
42. Strike the shepherd and the sheep will scatter.
43. Work on the hearts and minds of others.
44. Disarm and infuriate with the mirror effect.
45. Preach the need for change, but never reform too much at once.
46. Never appear too perfect.
47. Do not go past the mark you aimed for; in victory, learn when to stop.
48. Assume Formlessness
Regression outputs contain many different components, each providing crucial insights into the effectiveness and characteristics of the model.
The detailed explanation below will help you understand the various parts of the regression model output provided by R. From the formula used to the statistical significance of the coefficients, each element plays a key role in interpreting the overall performance and validity of the model.
✅ Call: Restates the regression formula and the data set used. Example: Modeling happiness with predictors (gdp, social, freedom, corruption) using data set my_data.
✅ Residuals: Differences between observed values and model predictions. Summary includes:
- Min and Max: Range of residuals.
- 1Q and 3Q: Middle 50% of residuals.
- Median: Middle value of the residuals. Close to 0 suggests accuracy.
✅ Coefficients: Provides estimates of the regression coefficients and their significance:
- Estimate: Impact of each predictor on the target variable. Example: Increase in gdp leads to a 0.25374 increase in happiness.
- Std. Error: Variability of each estimate.
- t value: Test statistic for the significance of each coefficient.
- Pr(>|t|): p-value for the t-test; values < 0.05 often indicate significant effects.
✅ Significance codes: Quick reference for significance levels next to the p-values.
✅ Residual standard error: Measure of the fit quality, indicating the average size of the residuals. Lower values suggest a better fit.
✅ Multiple R-squared: Proportion of variance in the target variable explained by the predictors. For instance, 82.51% in this model.
✅ Adjusted R-squared: Adjusts the R-squared to account for the number of predictors, providing a more accurate measure of model performance.
✅ F-statistic and its p-value: Tests if at least one predictor has a non-zero coefficient. A small p-value rejects the null hypothesis that all coefficients are zero, confirming the model’s significance.
Explore my webinar titled "Data Analysis & Visualization in R," where I demonstrate how to estimate linear regression models alongside other essential techniques. Further details: https://t.co/xZl4UCUpHG
#datascienceenthusiast #datastructure #DataAnalytics