🚨 Last chance for the market to bounce
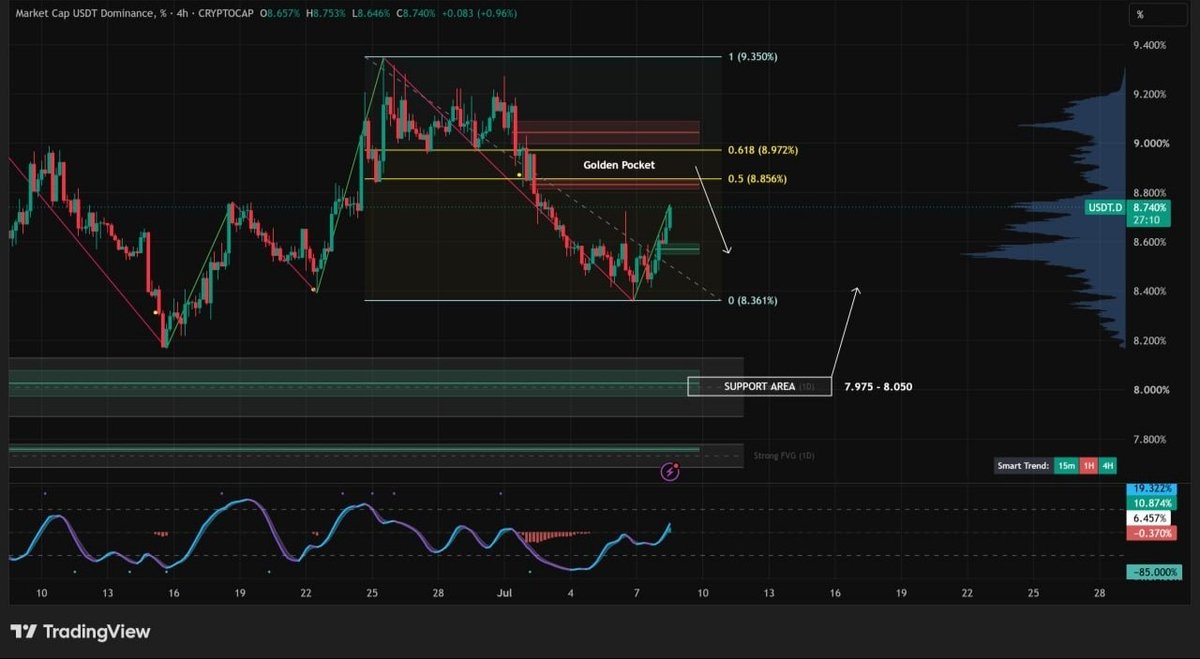
USDT.D Analysis — 4H Chart (Update):
Based on current market behavior, a further dip is likely, as USDT.D still has room to push toward the zone mentioned in yesterday's analysis — near the Golden Pocket 👈🏻
The recommended approach is to wait at minimum for the 0.5 Fibo (8.856%) zone, or below the 0.618 Fibo (8.972%), where $BTC and $ETH would be reaching their Fibonacci retracement levels and key 4H support zones ⏳
The oscillator also has room to climb, so jumping into a LONG prematurely in this environment would be risky ⚠️
What level must USDT.D respect and not break? 🤷🏻♂️
The 0.618 Fibo (8.972%) is critical in this setup. A break above it would invalidate any LONG attempt, as it would push us back to the start of the bearish phase — and BTC would very likely lose the $60,000 level 🩸
We still believe this market pullback is a healthy correction on this timeframe, but it's crucial that USDT.D respects this zone and rejects it for BTC and the broader market to resume their bounce 👍🏻
#Fibonacci #DominanciaUSDT #CryptoAnalysis
BTC and the market may keep bouncing ⚠️
USDT.D Analysis — 4H Chart:
The market has been bouncing since $BTC touched $57,750 (a buyer interest zone we've highlighted before). We're now trading above $63,000, and further upside is likely (the bounce we discussed on the Daily chart) 👈🏻
USDT.D, on the other hand, is showing clear weakness and could continue dropping toward the support zone of the 2 FVGs (4H and Daily, between 7.975% and 8.050%). This could push $BTC close to the $68,000–$70,000 range ⏳
USDT.D is currently holding an Order Block (near the start of the previous bullish phase), giving us 2 scenarios:
1️⃣ If USDT.D keeps rising, the maximum bounce target would be the Golden Pocket — a prime opportunity to enter LONG on the market
2️⃣ If it breaks downward, the maximum retracement for USDT.D would reach both FVGs — an opportunity to take profits on LONGs and start looking for SHORT setups
#CryptoTrading #Bitcoin #TechnicalAnalysis
BTC is showing strength — will it go higher? 🚨
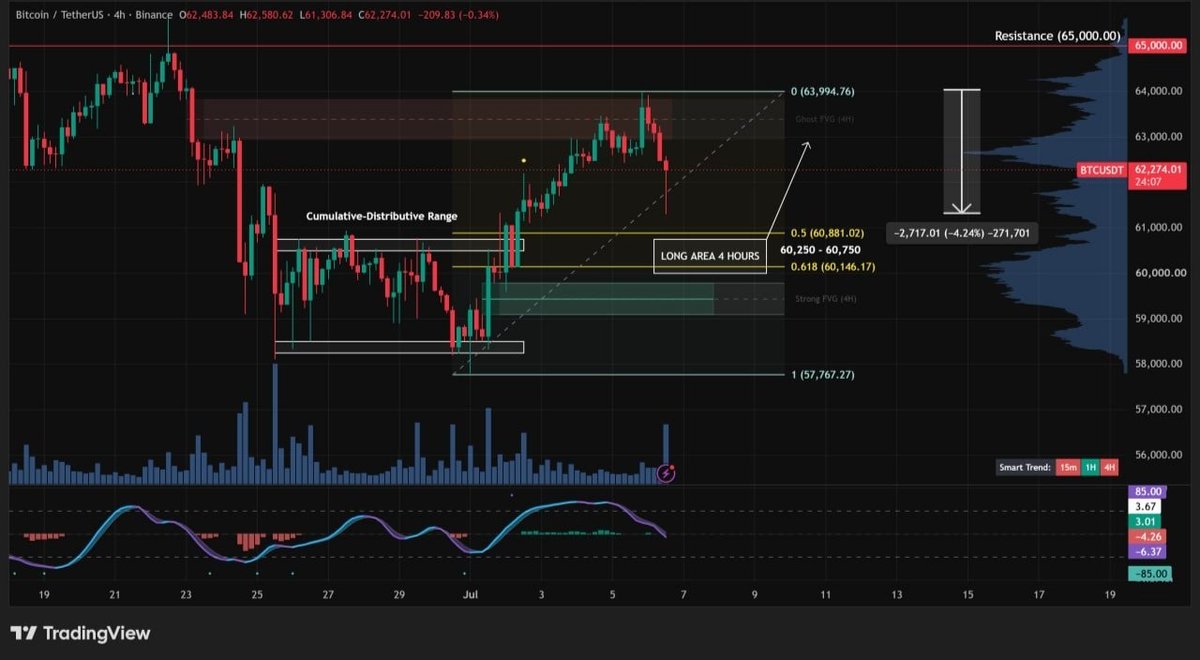
BTC 4H Chart Analysis:
Bitcoin reached and reacted near our zone (with a slight deviation to the upside around $64,000) 🔚
We knew it was risky to keep attempting SHORT trades if the 4H #FVG broke — price tapped the upper range but reversed and dropped 4.0% 🔥
The absorption happening right now cannot be ignored, but it's too early to confirm a clear direction (this is still just volatility). The oscillator still has room to drop, and the possibility of price falling back into our zone for a LONG entry remains open — anticipating a Change of Structure 🚀
Counter-trend entry zone:
1️⃣ LONG Zone ($60,000 – $60,750): Golden Pocket (0.5 – 0.618 Fibo) + Support
If $BTC reaches this level, it's critical that price holds above the 0.618 Fibo and the #FVG slightly below (this is the last support zone — though a deviation is always possible) ⚠️
If #BTC refuses to pull back and continues higher, the next target would be near $65,500 (the start of the previous bearish phase) 👈🏻
#Bitcoin #CryptoTrading #TechnicalAnalysis
Ugh, pay close attention to the Price Action that #BTC is showing, surpassing resistance and re-entering the Accumulation/Distribution Range... generally, these are warning signs of a strong reversal 📈🤓
#BTC#PriceAction#CryptoTrading
BTC could be about to deliver a more interesting bounce 🚨
#BTC Daily Chart Analysis:
It's been a while since we analyzed this timeframe, but after the drop $Bitcoin experienced from $82,900 down to $57,750, there has been no decent recovery bounce ❌
Nearly 2 months of selling and it's possible we're now starting a more prolonged bounce (unconfirmed) on this timeframe. We've reached a key buyer interest zone and selling pressure is already significantly weakened ⚠️
How far could BTC bounce? 🤷🏻♂️
If this holds as a temporary floor and price doesn't seek lower targets, the first stop for $BTC on this timeframe would be $67,000 👈🏻
The next major resistance zone sits between $70,000 and $73,000 — the Golden Pocket (0.5–0.618 #Fibo) of this bounce, where FVGs and the #SmartTrend converge, acting as a rejection zone 🔚
Could we push higher? 🤔
Only if price breaks above the 0.618 Fibo level beyond $73,000 would the path open toward the start of the bearish phase (back near $82,900) — but that carries lower probability. We'll be updating target by target 👍🏻
#Bitcoin #CryptoTrading #TechnicalAnalysis
🚨 If BTC breaks this zone, it flies
$BTC Analysis — 1H + 4H chart (follow-up):
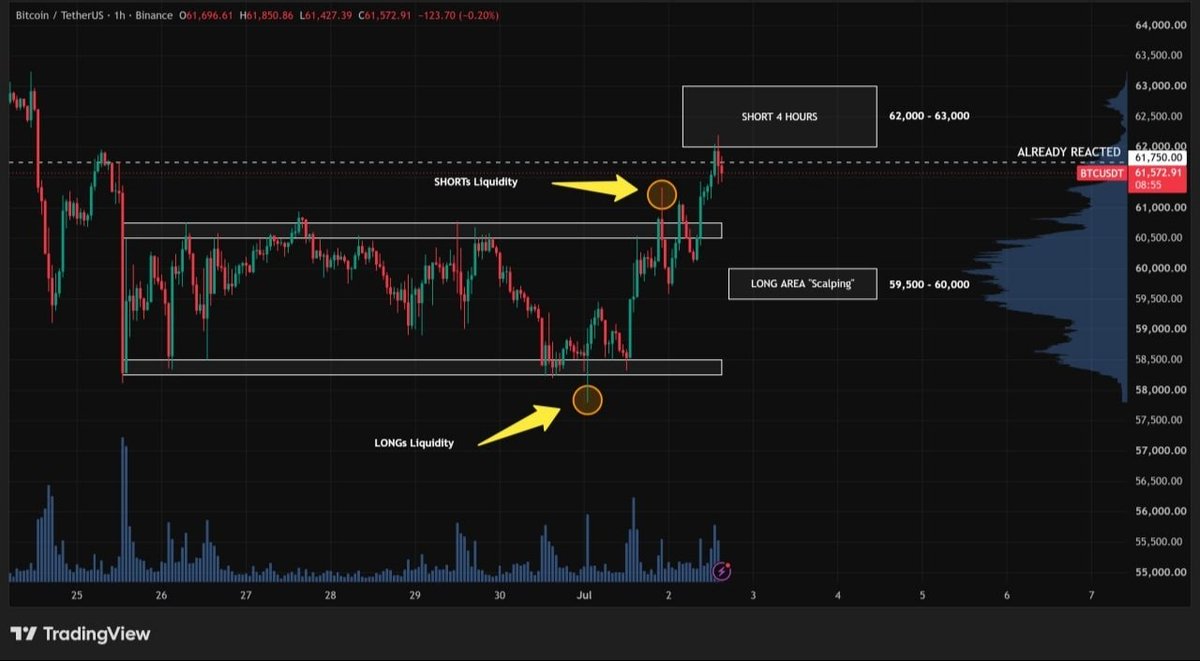
#Bitcoin is apparently breaking out of the range to the upside. We knew that once the downside liquidity was swept, price would do the same on the opposite side. 👈🏻
What move will $BTC make this time? 🤔
We remain bearish on the 4H — both in structure and trend — so SHORT should be the priority in this zone. However, we can't ignore that the 1H structure is anticipating a potential trend change (as we've mentioned in previous analyses). ⚠️
Right now, price is reaching and tapping an important rejection zone (62,000 – 63,000), backed by liquidity, #FVG, #OrderBlock, and Smart Trend. 👀
Can we attempt a SHORT? 🤷🏻♂️
Yes — we're already entering the SHORT zone. In fact, $BTC has already slightly tapped the lower area we marked in previous analyses (around 62,150). 👍🏻
If that pullback occurs, a Scalping LONG zone opens up, where we'd be anticipating that potential trend shift (59,500 – 60,000). 🔚
Very important: if $BTC breaks above 63,500 – 63,750, shorting is no longer recommended. Mindset must shift to 100% LONG on every pullback. 🚀
#CryptoTrading #SmartMoney #Blockchain
🚨 BTC move is coming — and it's going to be aggressive.
$BTC Analysis — 1H + 4H Chart (Update):
Bitcoin made a deviation below the range, near the $57,750 zone (LONG Scalping area), flushing out long positions before snapping back. Price is now pressing the top of the range 👈
What's the most likely next move? 🤔
Following our strategy: when price deviates to one side of a range, liquidates positions, and returns — it typically wants to sweep the opposite side next. That means SHORTs are now in the crosshairs ☠️
Zones to trade with the trend:
1️⃣ Scalping SHORT entry ($61,750) — Liquidity grab
2️⃣ SHORT on 4H ($62,000 – $63,000) — Liquidity + #FVG + Order Block + Smart Trend
LONG zones have lower probability for now, but remain valid — keep them on your radar in case price reverses again 👀
Zones to trade against the trend:
1️⃣ LONG 1H ($56,750 – $57,500) — Liquidity
2️⃣ LONG 4H ($55,000 – $56,000) — Second and stronger entry if #BTC continues dropping
#Bitcoin #SmartMoney #CryptoTrading
📢 Most relevant macro events of the week
1️⃣ Tuesday, June 30 — JOLTS Job Openings: Number of job openings during the reported month, excluding the agricultural sector.
2️⃣ Wednesday, July 1 — ISM Manufacturing #PMI: Index based on surveys of purchasing managers in the manufacturing sector.
3️⃣ Thursday, July 2 — Unemployment Claims: Number of people filing for unemployment insurance for the first time in the last week — a key indicator of how well or poorly the #USEconomy is performing. Expectation: 215K.
⚠️ The highlight of the week is the Unemployment Rate data. Previous reading: 4.3% (percentage of the active population that is unemployed and seeking work). Expected: no change at 4.3%.
Macro data moves markets — and that includes $BTC, $ETH, and the broader #crypto space. Stay sharp. 👁️
#MacroMonday #CryptoTrading #BTC
#BTC is stuck in a range and doesn't want to break 🚨
$Bitcoin #BTC 1H + 4H Chart Analysis (Updated):
$Bitcoin has been consolidating in a massive range for 5 days. Both the lower and upper boundaries have been tested multiple times — if price revisits either Support or Resistance, a breakout becomes increasingly likely. ⚠️
Trading zones remain the same (we've updated with a dotted line marking the alert zone where price begins entering both LONG and SHORT territory — the key areas remain the highlighted boxes). 👈
Counter-trend trade zones:
1️⃣ LONG 1H ($56,750 – $57,500): Liquidity zone
2️⃣ LONG 4H ($55,000 – $56,000): Second and stronger entry if price continues dropping
Trend-following trade zone:
1️⃣ SHORT 4H ($61,750 – $62,750): Liquidity + FVG + Order Block
Keep in mind that today marks the close of the monthly $BTC candle — expect increased volatility. ⚠️
#Bitcoin #CryptoTrading #Blockchain
#BTC compressing — which way will it break? 🚨
$BTC Analysis — 1H + 4H Chart:
Bitcoin hit its lowest point on June 25, touching $58,100 — a level that hasn't been breached since then. Analyzing price action, we're currently in a short-term range (without forgetting that the overall trend and structure remains bearish) 🩸
What are these types of ranges useful for? They help investors accumulate or distribute, but also serve to generate liquidity 💰
Like any range, it's traded as follows: short side at the top, long side at the bottom. However, considering we've been in this range for 4 days, it won't be long before a breakout happens in one direction — trade accordingly ⏳
Zones to trade once the range breaks against the trend:
1️⃣ LONG Liquidity ($56,750 – $57,500): A LONG can be attempted once this short-term liquidity is swept
2️⃣ 4H Support ($55,000 – $56,000): Second entry if price continues dropping
Zone to trade once the range breaks in favor of the trend:
1️⃣ SHORT Liquidity ($61,750 – $62,750): A SHORT can be attempted once this short-term liquidity is swept
#Blockchain #TradingSignals #CryptoInvesting
Has #BTC found its bottom — or is there more downside ahead? 🚨
$BTC 4H Chart Analysis (Update):
Bitcoin continues showing weakness with repeated wicks to the downside, but it's struggling to lose the $58,000 level (key buyer interest zone) — meaning a meaningful bounce isn't far off. That said, the overall structure and trend remain bearish. 🩸
It's currently having trouble breaking above the $60,600–$61,100 zone, which it has now tested twice. ⚠️
If that level breaks, the next reaction zone comes into play:
1️⃣ SHORT Zone ($62,000–$63,000): Golden Pocket + #FVG + #EMA + Resistance
On the flip side, if $BTC drops, a counter-trend long can be considered (prioritize the lower end of the first zone):
1️⃣ LONG Zone ($57,000–$58,000): Order Block + Support
2️⃣ LONG Zone ($55,000–$56,000): Order Block + Strong Daily #FVG + Support
For now, no higher or lower targets can be projected — we need $BTC to react at one of these zones first before mapping the next moves. ⏳
#Bitcoin #Crypto #TradingSetup
🚨 $BTC reaching a key buyer interest zone
#BTC 4H Chart Analysis:
#Bitcoin has officially printed a lower low (near $58,100) and the $59,000–$60,000 support has been breached. Structure and trend are fully bearish with visible price weakness 🩸
Can we drop further? Most likely yes — all signals point toward lower targets. However, we're entering a significant buyer interest zone ranging from $50,000 to $60,000, so looking for a LONG within that range isn't unreasonable (with proper risk management) 👈🏻
Looking at the liquidation map, there's very little liquidity below — in contrast, a heavy cluster has built up on the upside between $72,000 and $78,000, targets that are far from current price and unlikely in the short term ⏳
For now on the 4H chart, we have 3 key zones to watch 👌🏻
With the trend:
1️⃣ SHORT zone ($62,000–$63,000): Golden Pocket + #FVG + EMA + Resistance
Against the trend:
1️⃣ First LONG zone ($57,000–$58,000): Order Block + Support
2️⃣ Second LONG zone ($55,000–$56,000): Order Block + Strong Daily #FVG + Support
#Bitcoin #BTC #CryptoTrading
We have never broken that USDT.D level 🚨
USDT.D Analysis — 4H Chart (Update):
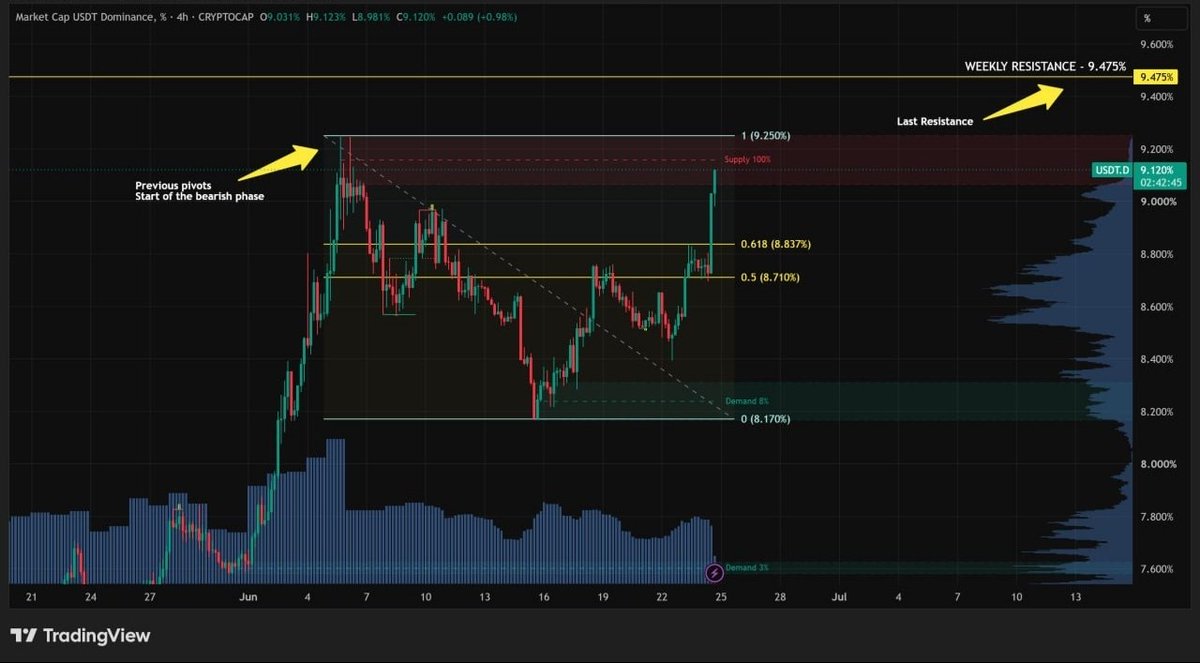
The market has already taken a clear direction, and $USDT.D has broken its Resistance zone (0.618 #Fibo), approaching the start of the bearish phase again (9.25%) 🤷🏻♂️
Right now, USDT.D is touching an Order Block and previous Pivots, which could give the market some relief — without ruling out the possibility that it could push a bit higher 👈🏻
What would happen if USDT.D doesn't hold at the Order Block or the 9.25% level? 🤔
We could reach the next Weekly Resistance at 9.475% — the highest level USDT.D has ever reached in its entire history. Beyond that, we have no data and we'd enter price discovery territory, which would trigger major drops across the market 🩸
For now, reaching and breaking through that zone won't be easy and it's still some distance away — but we can't lose sight of it, let alone rule it out ⚠️
#USDTD #CryptoMarket #DominanceIndex
🚨 Key Zone for the Market
USDT.D Analysis — 4H Chart (Update):
The market continues to respect its temporary floor near $59,000 on $BTC, where USDT.D touched 9.25% and rejected — triggering a broad market bounce. However, based on recent USDT.D price action, that bounce may be nearing its end, and further downside could follow. 🩸
USDT.D is currently testing a critical Resistance zone at 8.84%, sitting very close to the 0.618 Fibonacci level. 👀
For the market to breathe and push higher, USDT.D needs to reject this zone. 👈🏻
If it breaks above that Resistance, a move back toward the start of the bearish phase becomes highly probable — and prices could climb even further, dragging $BTC down to $60,000 or lower. ☠️
One key factor to watch: the Smart Trend is painting green across all timeframes. Remember — if USDT.D is bullish, the entire #crypto market turns bearish. ⚠️
#Bitcoin #DominanceWatch
BTC rejecting at key zone 🚨
BTC 4-hour chart analysis:
#Bitcoin has managed to bounce from our LONG zone mentioned in previous analyses (62,000 – 63,000), near the FVG, and reacted exactly as expected 🔥
At this moment $BTC has reached our key rejection zone (Golden Pocket), specifically the 0.618 level located very close to 65,500, and additionally, the lower boundary of the distributive range (previously Support, now Resistance) 👌🏻
What is the next market move? 🤔
Following the academy's own strategy, $BTC should reject from this point and attack the previous lows again (near 62,250) to seek targets even lower 👀
Remember that the Smart Trend remains painted red on both the 1-hour and 4-hour charts, so the trend is bearish 🩸
In what zone would we have to consider that it was just a deviation and that we can look for targets higher? 🤷🏻♂️
Only if $BTC completely fills the engulfing candle and breaks above 66,000 would the 68,500 – 69,500 range be re-enabled as the next target 👈🏻
#Bitcoin #BTC #CryptoTrading
The weakness $BTC is showing could push it even lower 🚨
BTC Analysis — 4H + 1H Chart:
After Kevin Warsh's Conference, the market turned highly volatile, causing #Bitcoin to break key levels it had to hold to continue its recovery (64,250 – 64,750) 👈🏻
Why is trading below 64,000 bearish? Because it means we've re-entered the previous accumulation range. Losing that level opens the door to lower targets — so if the market bounces, the ideal play is to trade with the trend 👌🏻
1️⃣ SHORT Zone — 1H (64,250 – 64,750): Order Block + Resistance + Smart Trend + Golden Pocket
If BTC reclaims 65,500 – 66,000, the drop would be classified as a deviation and higher targets come back into play — though that's the lower probability scenario right now ❌
On the other hand, the last clear LONG zone was (62,250 – 63,250), where the Golden Pocket (0.5 – 0.618 Fibo) and an FVG converge — $BTC found short-term support right there and is reacting 💪🏻
If the 0.618 Fib (62,250) breaks down, we don't just go back to 59,000 — the door opens to even deeper targets as we've already outlined ☠️
#Crypto #TechnicalAnalysis #BTC
🚨 Last zone for the market to keep bouncing
USDT.D Analysis — 4H Chart:
The market found a temporary floor near $59,000 on $BTC, where USDT.D touched 9.25% and rejected from that zone — allowing a general market bounce. 👈🏻
Right now, USDT.D is testing a key Resistance zone (8.55%) with the oscillator approaching overbought conditions. 👀
For the market to continue bouncing, USDT.D needs to reject this zone — or if it pushes slightly higher, it must not break above the Golden Pocket. ⚠️
If that last zone breaks, it's a strong signal we're heading back to the start of the bearish phase — possibly pushing even higher, triggering more market-wide drops. In that case, prioritizing SHORT positions would be ideal, and $BTC could revisit $60,000 or lower. ☠️
Keep a close eye on the Golden Pocket levels for both #BTC and USDT.D — they are critical for the market's next direction. 🤷🏻♂️
#Altcoins #TradingSignals #Blockchain
$BTC bouncing — will it go higher? 🚨
BTC 4H Chart Analysis (Follow-up):
The market is eagerly awaiting Kevin Warsh's first conference as the new #FED Chair, while $Bitcoin has touched our first LONG zone 🔥
1️⃣ First LONG Entry (64,250 – 64,750): FVG + Support (former Resistance) + EMA
Reacting right now with the oscillator approaching oversold territory 👌🏻
What's next for $BTC? 🤔
If a real bounce zone has been established, this impulse should be enough to break above previous highs (67,250), heading toward our SHORT zone:
1️⃣ SHORT Zone (68,500 – 69,500): FVG + Strong Daily FVG + Strong Weekly FVG + Resistance
Can $BTC drop back and lose 64,000? 🤷🏻♂️
The possibility always exists — though it shouldn't happen. Re-entering the accumulation range would be bearish for price action. However, if it does, there's one last LONG attempt available at the Fibonacci retracement:
2️⃣ Second LONG Zone (62,250 – 63,250): Golden Pocket (0.5 – 0.618 Fibo) + FVG
Losing the 0.618 Fibo level would open the door not just to $59K, but potentially to even lower targets we've already outlined 👀
#Bitcoin #CryptoTrading #TechnicalAnalysis
BTC is gearing up for a big move 🚨
#Bitcoin 4H chart analysis:
#BTC price action shows slight weakness, failing to break above its previous high — but that possibility isn't off the table yet. What it likely needs is a small pullback to build momentum and break out 🚀
Two LONG entry zones are now active:
1️⃣ First LONG Entry (64,250 – 64,750): FVG + Support (former Resistance) + EMA
2️⃣ Second LONG Zone (62,250 – 63,250): Golden Pocket (0.5 – 0.618 #Fibo) + FVG
The second zone is the last viable LONG attempt. Losing the 0.618 #Fibonacci level would not only send $BTC back to 59,000 — it could push prices even lower ⚠️
Now, what happens if we break above the previous high at 67,250? The SHORT zone remains active:
1️⃣ SHORT Zone (68,500 – 69,500): FVG + Strong Daily FVG + Strong Weekly FVG + Resistance
#BTC #Crypto #TechnicalAnalysis