Applications for the Ireland Fellows Programme opens on 29 June 2026!
Apply for the opportunity to study in Ireland on a fully funded master’s scholarship 🎓
Applicants from Nigeria and Ghana can find all info and applications here: https://t.co/vgAi4vZfyU @commercium_afr
The response to this tweet was far bigger than I expected.
Well, here's the opportunity.
I'll be facilitating a mentorship session with @dsn_ai_network this weekend on:
📊 End-to-End Execution of a Data Analytics Project with Power BI
This won't be another "drag and drop charts" session.
We'll cover:
• Understanding business problems
• Data cleaning & transformation
• Data modeling
• DAX
• Dashboard design
• Data storytelling
• Presenting insights to stakeholders
If you've been looking for a practical way to understand how real Power BI projects are executed from start to finish, this is for you.
📅 June 27
🕒 3:00 PM
📍 Google Meet (https://t.co/3TCHHWdK6C)
See you there 🚀
#PowerBI #DataAnalytics #DataScienceNigeria
If you remove immigrants players from
USA 🇺🇸
France 🇫🇷
England 🏴
Canada 🇨🇦
Those countries will not have enough talents to compete in the world cup.
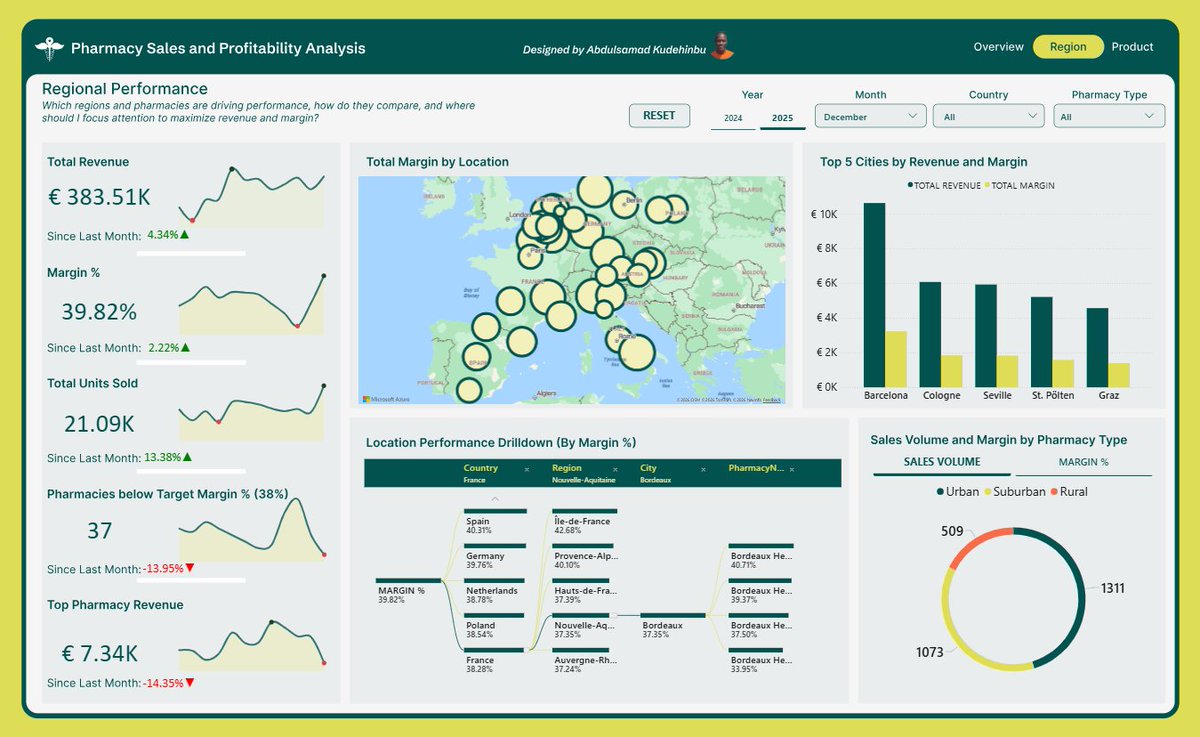
From a blank canvas to a report like this!
This Saturday by 4:30pm, I’ll be recreating this 3-page Power BI report from scratch with CodeSphereHub, for FREE
We will cover data modeling, DAX, report building and data storytelling.
Drop a🔥if you are joining!
#PowerBI#Datafam
I'm excited to share the completion of my recent data analytics project from @AnalystLab Internship Program.
For this project, I worked on two datasets:
Dataset 1: Online Retail
Dataset 2: Netflix Titles
The dashboards provide clear visualizations of key metrics, trends
At the end of every quarter, Sandra has the same challenge.
As the Commercial Analytics Lead at Nestlé Nigeria, she's responsible for preparing performance reports for management.
The problem isn't the reporting itself.
The problem is that the data comes from different regions.
For Q1, sales reports arrived from the North, South-West, and South-East regions as separate CSV files. Each region maintained its own report, which meant slight differences in formatting, naming conventions, and data quality.
Before management could answer questions like:
• Which region generated the most revenue?
• Which products performed best?
• Who were the top-performing sales representatives?
• How did revenue trend throughout the quarter?
The data first had to be prepared.
This project started with three regional sales datasets.
Using Power Query, I imported the files, standardized the structure, corrected data types, cleaned inconsistencies, and appended all three datasets into a single master table.
Once the foundation was in place, I created additional fields to support analysis, including:
• Revenue
• Profit
• Profit Margin
• Week Number
• Month Name
• Performance Indicators
With the transformed dataset ready, the next step was analysis.
Before building any visuals, I summarized the data using PivotTables to identify the key insights and answer the business questions that mattered most.
Only after the analysis phase did I move into dashboard design.
I wireframed the layout, defined the KPI structure, selected the appropriate visualizations, and built an interactive dashboard featuring:
• Revenue, Profit, Quantity, and Transaction KPIs
• Revenue by Channel and Category
• Top Performing Sales Representatives
• Best Selling Products
• Weekly Revenue Trends
• Interactive filters for Region, Month, and Sales Representative
What began as three separate CSV files became a centralized reporting solution capable of delivering insights in seconds.
One lesson I keep reinforcing in my classes:
Most people think dashboards start with charts.
They don't.
Dashboards start with clean data, a structured process, and the right business questions.
Tools Used: Excel, Power Query, PivotTables, PivotCharts, Slicers, Dashboard Design
#DataAnalytics #Excel #PowerQuery #BusinessIntelligence
Day 71 of my Data Analytics journey📊.
Dear Data Analysts,
A simple dashboard with clear insights will always outperform an overly designed dashboard that needs manual to explain it.
Clarity, simplicity, and usability should always come first.
One of my mentees was struggling with a major limitation, her laptop can only comfortably run Excel.
Instead of seeing that as a setback, we turned it into a structure.
I built a full Excel Analytics Handbook for her, a step-by-step learning path from beginner to advanced level, covering everything from basic functions to dashboards, data analysis, and even automation.
This guided roadmap shows her exactly what to learn, what to build at every stage, and how to progress without feeling stuck or overwhelmed.
If you’re a beginner in data analytics or you’re stuck with limited tools but still want to build real skills and projects, this might help you too.
DM “Excel” and I’ll send to you.
Hey everyone! 👋
I just set up an Excel practice module focused on lookups and text-joining functions. It’s perfect for beginners or anyone looking to brush up on their data handling skills.
If you’d like to use it for practice, just let me know in the comments, and I’ll drop the public link for you to download.
Happy learning!
Found 3 versions of the same KYC category silently wrecking my analysis.
No error. No warning. Just wrong results.
One Conditional Column in Power Query → fixed.
Data Analysts don't make charts.
We make sure the numbers tell the truth.
📊 Building a Fintech dashboard in public
Hello Nnenna
Overall, I will give your first Excel Dashboard a 5.5/10 Rating.
The dashboard did a great job in teling stories with core data analysis fundamentals:
It has a clear visual hierarchy, utilizes standard KPIs, includes intuitive filters (slicers), and uses appropriate chart types for the data being displayed. However, it is heavily held back by colour choices, contrast issues, and minor formatting oversights that impact its professionalism and readability.
So here is my detailed feedback & Observations
1. Colour Palette & Contrast
-The Issue: The dashboard relies almost entirely on monochromatic shades of pink and purple. Because the background, slicers, cards, and data bars all share very similar hues, the visuals bleed into each other.
-Accessibility: The low contrast between the light pink text/bars and the white or pink backgrounds makes it difficult to read quickly. For example, in the "Sales By Region" and "Profit by Category" charts, the "Profit" bars are so faint that they are almost invisible against the white plot area.
The Fix:
Use a more neutral background (like off-white or very light grey) and reserve vibrant colours strictly for drawing attention to data points. Choose two contrasting colours for "Sales" vs. "Profit" instead of two shades of pink.
Also, use black for axis and data labels.
2. Visual Elements & Chart Formatting
Axis vs. Data Labels: For the Sales By Region and Profit by Category charts, consider removing the Y/X axis gridlines and adding data labels directly onto or above the bars. It makes it much easier for an executive to see the exact value without trying to trace a line back to the axis.
- Dual-Metric Scaling: In Sales By Region, you are plotting Sales (millions) and Profit (thousands) on the same axis. Because sales are so much larger, the profit bars look tiny and compressed. A clustered column chart might not be the best fit here; consider a Line and Stacked Column Chart (putting Profit on a secondary Y-axis) or a simple data table/matrix to show the side-by-side relationship clearly.
3. Alignment and Layout
KPI Cards: The top KPI cards (Total Sales, Total Profit, Profit Margin, Total Orders) are placed nicely, but their sizing and alignment could be sharper. Profit Margin and Total Orders have different widths than the first two. Standardizing the card sizes to be equal will instantly make the layout look more polished.
Generally, I will say Weldone on this.
If this can be your first dashboard, then you will build better dashboards if you keep the good work going.
Yours in data,
Ekanem
Data Analyst & Powerbi Developer
From June 1st, I will be heading the engineering and technical team of a health startup based in Lagos Nigeria (presently worth $20 million in valuation)
I will be recruiting 10 people into the engineering team for the following positions.
QAs
Product Owners
AI Engineers
DevOps
Software Engineers (Full Stack)
That’s a lot of work for me to handle the recruitment process because we don’t have HR yet.
I can only handle the technical interviews.
Is there any recruitment agency you can recommend?
I recently reached out to a few friends who relocated through visa sponsorship, and it made me realize how many people still don’t know these opportunities exist.
So I decided to gather as much verified information as possible and put together a detailed thread, and no this is not a random info, It's an actual verified information,platforms, job sources, and strategies that have worked for real people.
This is especially for people looking at countries like:
🇬🇧 UK
🇨🇦 Canada
🇩🇪 Germany
🇺🇸 USA
…and others.
I’m dropping the full detailed thread this evening.
Don’t miss it if relocating has been on your mind.
Hottest platforms to get Data Analytics gigs and Jobs:
Social Media: very underrated but the best so far for both gigs and full time jobs.
Upwork: Best overall for freelance data analytics gigs
LinkedIn Jobs: Best for full-time analytics jobs and recruiter visibility
Wellfound: Strong for startup and remote analytics roles
Toptal: Premium high-paying freelance analytics work
Remotive: Remote-only data analytics jobs
Built In:Tech-company and SaaS analytics jobs
Indeed: Massive global job volume
Fiverr Pro: Productized analytics services and dashboard gigs
https://t.co/DhNmmjpvFJ: High volume of freelance analytics projects
DataJobs: Dedicated data and analytics job board
Kaggle Jobs: Data science and analytics opportunities from the data community
Otta (Welcome to the Jungle): Startup and tech analytics hiring
Dice: Tech-focused analytics and BI jobs
FlexJobs: Curated remote and flexible analytics roles
So, guys, like I said, this isn't for the lazy🫢and it's not for one looking for instant money, without putting in the work. It's for people who honestly enjoy reading, any kind of reading...Here’s a thread of 10 legit platforms to start your earning journey;
6. reasons why you should become an Ai powered data analyst in 2026
1. Let’s talk money.
In Nigeria, entry-level data analysts typically earn ₦200,000 to ₦300,000 monthly, mid-level analysts pull in ₦400,000 to ₦700,000, and senior analysts cross ₦1 million.
Go remote with a foreign company and the pay shifts entirely. Junior remote roles start around $1,500 to $2,500 monthly, with experienced analysts earning $4,000 and above.
2. AI made analysts more valuable, not less.
Every company adopting AI still needs humans who can ask the right questions, sanity-check the outputs, and turn raw data into decisions leadership will actually act on. Tools got cheaper. Judgment got more expensive.
3. You can earn globally without leaving home.
Remote analyst roles pay in dollars, pounds, and euros. A Lagos-based analyst billing a US or UK company is no longer a flex story; it’s a standard career path in 2026.
4. Every industry is hiring, not just tech.
Banks, hospitals, logistics, agritech, government, retail, sports, entertainment. Anywhere data exists (which is everywhere now), there’s budget for someone who can make sense of it.
5. The entry barrier is low compared to the payoff.
No four-year CS degree required. SQL, Excel, a BI tool, and a real portfolio can take you from zero to hired in 6 to 12 months. Very few high-paying careers move that fast.
6. It’s a launchpad, not a ceiling.
Analyst opens doors into data science, analytics engineering, product analytics, BI leadership, and consulting. You’re not picking a job. You’re picking a direction with branches.