If you're new at this trading thing you should analyze a chart with RSI+Bollinger bands. For old coins with high MC and a fair amount of holders (more than 5k) it's remarkably accurate most of the time.
The trick is putting the timeframe where it makes more sense so here $1 on 1D chart. You can clearly see that when it hits the lower band it pumps, then you sell when it hits the top band.
If there's momentum you can enter back at the mid average (orange line) and sell at the top band, and repeat. Once it's outside RSI 70 it's "overbought", you can expect a correction. Wait and buy back once it hits the mid average.
In the case of $1 at one point it hit the mid average and RSI 50 on the 24th of November and went back lower, then it hit the boll band again.
Now it's considered overbought again but who knows.
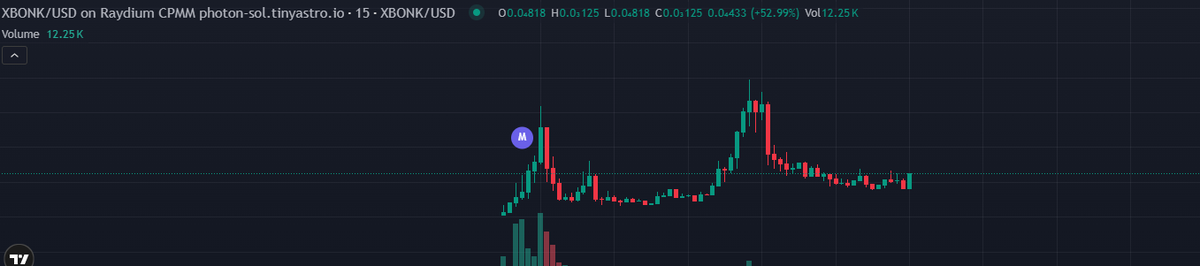
@evee0x $XBONK
dev launched revolutionary tek and they close hic account 3 times for entry-fudding
you make picture, tag @launchbonkx and you have a token on Bonk
ica gud tek