RANGE DEVIATION SETUP — CHEAT SHEET
You voted for this twice. I built it properly.
The setup is simple to describe and brutal to execute. Most traders get the idea, very few have the patience to wait for the actual trigger. Here is how I trade it.
THE CORE IDEA
Markets range more than they trend. Inside a range, liquidity sits ABOVE the high and BELOW the low. The big players hunt that liquidity. Price sweeps out, traps the breakout traders, then snaps back in. That snap-back is the trade. Not the sweep itself. The reclaim.
If you cannot tell the difference between a sweep and a real breakout, you will get chopped. The whole edge is in the RECLAIM.
STEP 1 — DEFINE THE RANGE
Mark the high and the low. Ideally the range needs at least two touches on each side. One touch is a level. Two touches is a level the market respects. HTF or MTF only. I rarely trade range deviation on a 5-minute box. The structure is too small to matter.
STEP 2 — WAIT FOR THE DEVIATION
Price breaks out. Above the high or below the low. This is the sweep. DO NOT ENTER HERE. The sweep alone does not tell you anything yet. It could be a real breakout. It could be a trap. You do not know.
STEP 3 — WAIT FOR THE RECLAIM
Price closes BACK INSIDE the range. This is the confirmation. The breakout failed. The trapped traders are now on the wrong side. The reclaim is the trigger. No reclaim, no trade. This is where 90% of traders get it wrong. They enter on the sweep because it feels obvious. They get stopped out when the breakout continues. The reclaim is the only thing that matters.
STEP 4 — ENTRY
LTF structure break + retest. Drop down to 5m or 15m. Wait for a clean break of the LTF structure in the direction of the reclaim. Wait for the retest. Enter on the retest. No chasing. If you miss the retest, you miss the trade. The setup will come again.
STEP 5 — STOP
Stop ABOVE the sweep high if you are short. Stop BELOW the sweep low if you are long. Never inside the sweep wick. The sweep is the failed move. If price gets back into the sweep zone, the setup is invalidated. Your stop has to live OUTSIDE the failed move.
STEP 6 — TARGETS
First target: mid-range. Take partials. Move stop to break-even. Second target: the opposite boundary of the range. R:R minimum 1:3. If the math does not work, the trade does not exist.
STEP 7 — INVALIDATION
Price closes back outside the range after your entry. Thesis broken. Out. No debate. No averaging down. The setup failed. Move on. The next one is coming.
THE CARDINAL RULE
The sweep is the trap. The reclaim is the trigger.
If you remember nothing else, remember that.
COMMON MISTAKES
Entering on the sweep. Stop too tight inside the sweep wick. Not waiting for the LTF structure break. Chasing after missing the retest. Trading the setup on a range that has not had enough touches. Forcing it when price is mid-range.
All of these are patience problems. The setup is not the issue. The wait is the issue.
THE TRADE PAYS WHEN YOU WAIT.
Powered by @WOO_X Pro this week. Zero fees on spot. Code POPEYE.
https://t.co/iWxTrgYsA3
Protect the capital. Protect the process.
Pop
Value Development (VWAP Specific) Simplified
> How to formulate bias using a top down approach w/ VWAPs
> Use of Standard Deviation Bands
> Combining w/ orderflow
A Comprehensive Visual Thread w/ Notes
(nothing AI generated)
“Michael, so you own 5% of all Bitcoin & decided you were going to sell some to test the liquidity?"
“That’s correct Dave.”
“And you did this immediately after using up your cash to buy back debt at an 8% discount?”
“I did, Dave.”
“So when you actually did what you said you were going to do, the liquidity test didn't go well?”
“Sadly true, Dave.”
"And you only sold 32 BTC, even though you knew that wouldn't be enough to cover the next year of dividend payments?"
"Yes, Dave."
"So in the process of selling BTC to try & save STRC, you ended up killing BTC, STRC, & MSTR?"
"Very astutely observed, Dave."
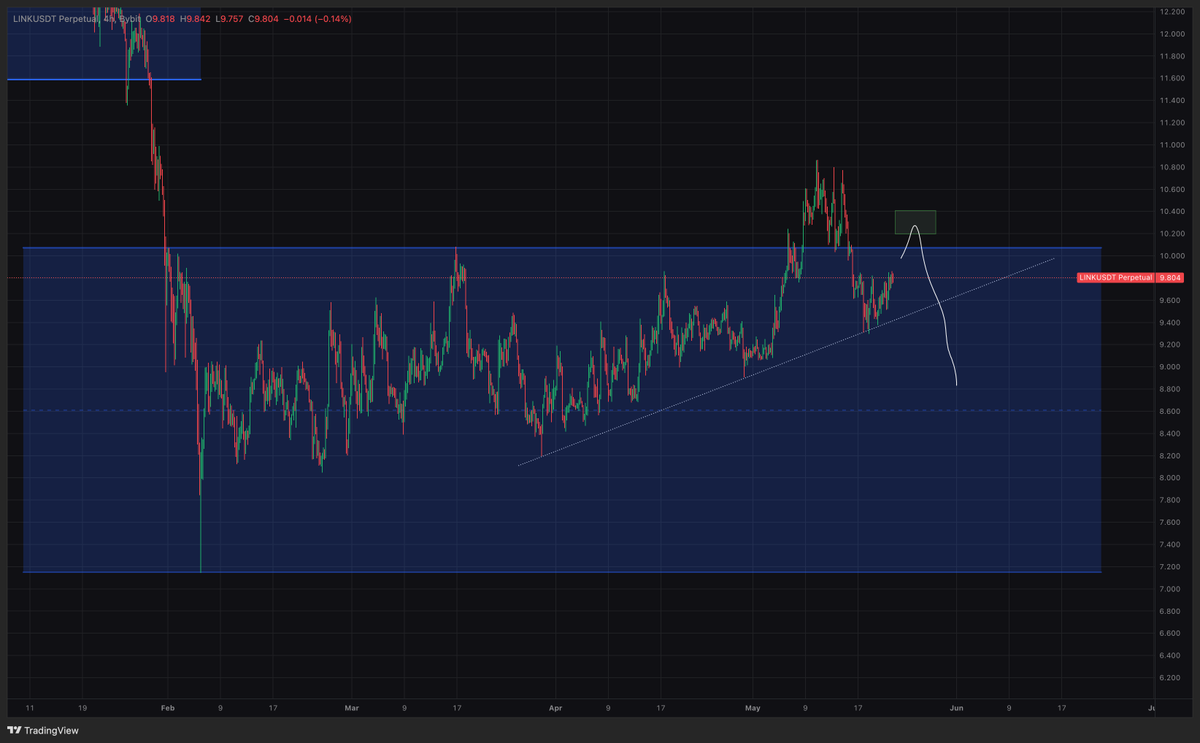
@SailorManCrypto In terms of LINK are you looking to play it as range deviation setup? Pengu, Tia and Useless look like they broke their ranges and switched to trend trading setups while LINK kind of struggling to keep up. I think it might coincide with BTC short setup.
Thanks in advance!
i've gone through quite a few journals the past few years
[ what didn't work ]:
- taking over 2 to 3 trades per day
- back to back entries (re-entering after a loser)
- trading too many pairs (spreading themselves thin)
- random sizing
- only using market orders (they’d always be offside anyways)
- executing using timeframes below 5m
- not having daily structure (some morning routine)
- adding to a losing position (quite obvious)
- entering before knowing where they would exit
[ what was working ]:
- limiting trading to certain session hours (new york/close)
- planning specific levels (not zones) before each session
- sizing in accordance to regime (example: 5d vs 60d atr)
- increasing initial trade size once already in profit
- focusing on price action from their avg trade time
- trading majors (btc,eth) nothing smaller than solana
- aiming for a 45% + win rate (low-mid win % in general)
[ why they were messing up ]:
- trading pnl graph (thinking of past results)
- not accounting for probabilities resetting
- social media impact on their execution
- spreading thin across pairs to avoid boredom
- inability to not mess with an open position
- not stepping away from the desk frequent enough
- outcome focused mindset over input focused
[ actions they used to fix ]:
- collected data (having data = conviction)
- reviewing after every trade (creates time delay)
- turn off the pnl completely
- adopting a 3 question checklist before entering
- removing all trading apps from phone
- strictly limiting time on socials (lookup "brick - social")
none of this is to say there’s a right or wrong way to trade.
i'm 100% certain there are people trading 20 trades per day making money, and people trading 15 different pairs too.
i just wanted to share my personal observations from people I have worked with.
Strategy:
Systematisation
Range / Trend / Rotational
Strategy backtesting / forward testing
Technical Primary:
Price Action / Supply Demand
Volume / Volume profile / Market profile
Understanding Value
Oscillators leading / lagging
Trade Execution:
Tape/DOM/Orderflow
Footprints
Aggregated deltas
Liquidity : Liqudations : OI
Time Based vs Non Time Based
Trading Terminals
Performance:
Trading Manual
Trade Sheet
Journaling Performance
Journaling Mindset Iterative process
Review process
Process oriented> Results oriented
Have an appreciation of the above
Strategy Creation:
Some notes I put together last year...
1. Do I fully understand how and why each strategy works and the contextual environment?
2a. Do I understand my trade execution strategies and can I explain clearly what I'm looking for?
2b. Have I back tested and forward-tested the strategy across multiple market cycles?
3. Do I know the expectancy and edge of each setup?
4. How will I monitor for strategy decay or changing market conditions?
5. Have I accounted for execution costs, slippage, and live market conditions?
6. Is my performance statistically sound (strong Calmar, Sortino, etc.) with a large sample, robust across regimes?
#PriceAction
The Standard Setup
Simple setup that you can easily use in any market. Takes the emphasis of using Ranges, Supply/Demand alongside what a three tap is
Small write up to cover:
- How to format ranges
- Demand/Supply
- Three tap importance
Lets get into it
Beyond A Decade of Setups
The technicals, the probabilities, the execution, and the trader.
---THE TECHNICALS---
For me, technical improvements came from being able to read the market in real time and understand what was likely happening underneath the surface at inflection points: the flows, the positioning, and the reaction at a level.
That’s where microstructure started to matter.
The signs of price failure. The shift in momentum. Tape speed and volume being supported by flows. Understanding price and flow mechanics when the same conditions kept showing up again and again.
I saw it enough times that eventually it stopped feeling like noise. It became data I could interpret and reason about.
Once I could define the structure, understand the pattern, and recognise the flows behind it, I knew I could read the market in almost real time and identify a possible execution trigger.
But from experience, that was still only a small part of the game.
---THE PROBABILITIES---
One of the questions I started asking myself was: how do I grade my performance if I don’t even know how to measure or quantify what I’m actually trading?
For example, placing a stop at some random swing high. How do I measure that over 100 trades? What parameters am I actually tuning? How do I know what’s improving and what’s just noise? Are my MAE/MFE stats meaningful at all?
That was a big realisation for me. How could I really perform at a high level if parts of my process were still random and carrying a high degree of variance?
Maybe I could do okay.
But was okay good enough?
The real question became whether I could trade this with a measurable probability in my favour.
Not perfectly.
But consistently enough to know I wasn’t just operating from randomness.
I was operating with purpose and probability.
---THE EXECUTION---
The deeper work, for me, has been myself as the trader and the process - not just the technicals alone.
I spent a long time obsessing over price action, order flow, and technicals, while neglecting the part that was actually affecting my performance.
I realised I could study price charts all I wanted.
Technical skill alone wasn’t going to move the needle.
I got better technically, but the same flaws in my game kept resurfacing because I hadn’t dealt with them properly.
For me, the strategy in isolation was never really the issue. It was executing when emotion was at its highest.
In my own trading, the problem often wasn’t that I lacked a setup. It was the execution around it - entering too early, exiting too late, cutting too soon, sizing poorly, or freezing when the decision actually mattered.
So I had to ask myself...
Could I explain one of my execution strategies in detail, beyond just saying “look for an SFP”?
Could I explain the logic behind it?
Why it works?
Where it should work?
What I’m actually trying to capture?
Because “look for an SFP” isn’t a strategy.
It’s a label.
Second-guessing, hesitating, cutting too early, oversizing, and letting fear, frustration, or ego influence the decision-making process.
I’ve dealt with all of it for years. And if I’m not fully locked in, it can still creep back in.
For me, the struggle hasn’t always been finding opportunity. Opportunities always exist.
The challenge is executing cleanly when it matters.
The entry. The management. The exit. The full trade life cycle and the statistics around it.
That’s the part I obsess over most now. It serves as a constant feedback loop - the quality of which depends on how honest I’m willing to be with myself.
I know what I’m looking for. The countless hours spent testing, reviewing trades, studying price, and collecting data are all part of turning that into a real strategy.
So the focus is simple: better preparation, better review, better sizing, more patience, and cleaner execution.
Small improvements, repeated consistently.
The 1% changes that compound - think Atomic Habits.
---THE TRADER---
At some point, trading became less about proving I was right and more about executing what I said I would execute.
Not forcing trades. Not reacting emotionally. Not needing to be right. Not caring as much about what everyone else is doing on X.
Just trying to execute a defined process with purpose.
Variance will always exist. Losses will always be part of the game. But with enough data, review, and self-awareness, I started to move away from randomness.
I started narrowing the window of variance - which, in my opinion, is one of the hardest parts of becoming a better trader.
Because if the parameters I journal aren’t quantifiable, what am I really journaling?
Dogshit data.
Randomness.
This matters with things like stop placement, sizing, and trade management.
By bringing more systemisation into my execution - whether that’s structured sizing, defined risk, Kelly Criterion, or whatever framework suits the way I trade - I can narrow the window of variance and trade with more intent.
Let the process do its work.
That’s what it comes down to for me:
Building the structure.
Refining the performance.
Becoming the trader capable of executing it.
Because performance isn’t just the setup.
Performance is how I execute the setup and manage the entire trade life cycle - from strategy creation, to initiation, to execution, to performance review.
Not really giving a flying f**k what anyone else says or does.
Just me against me - sharing my experiences and own journey... mainly talking to myself but hope someone finds it insightful.
@SailorManCrypto The amount of work you put in is insane, thank you!
I have a question- since BTC left it's range can we assume that ALTs will have relief rallies now and range strategy will not work for a while? Should we switch to trend trading now?
How I Journal Every Trade (And Why Most Journals Are Useless)
Most trading journals are useless. People log entry, exit, PnL, maybe the pair and the direction, and think they're journaling.
That's not a journal. That's a spreadsheet with no purpose.
The point of a journal is not to track how much money you made or lost.
The point is to find your weaknesses and your strengths. That's the whole reason it exists.
If your journal isn't telling you what you're doing wrong and what you're doing right, it's just a list of numbers and you're wasting your time filling it in.
I built my own trading journal from scratch and I shared it with my subscribers earlier this year.
This article is the full logic behind it — why it's structured the way it is, how I use it, and what it actually does for my trading.
This post is sponsored by WOO X Pro — trade with zero fees on spot: https://t.co/iWxTrgYsA3
A Journal Without a System Is a Diary
Here's the first problem nobody talks about. If you don't have a predefined set of setups, your journal is a random collection of trades with nothing connecting them.
You can't track patterns if there are no patterns to track.
You can't measure improvement if every trade is different.
Before you even think about journaling, you need to define what you trade. Not 15 setups. Not "whatever looks good on the chart."
Three or four. That's it.
Mine are: Range Deviation, 3 Drive Trend, 3 Drive Range, and Trend Following with Fib and Demand zones.
Every single trade I take fits one of these. If a setup doesn't belong to one of those categories, I don't take it. Period.
This is what makes the journal work.
Because now every trade is tagged to a specific setup. Every entry has a framework behind it. And when you review your data after 30, 50, 100 trades, you're comparing apples to apples instead of looking at a melting pot of 30 different styles with no way to draw conclusions.
The system comes first. The journal comes second. Without the system, the journal is just a diary.
What I Actually Log for Every Trade
The basics are obvious.
Pair, date, direction, entry, stop loss, target, R:R, result. Setup type and timeframe. Status — open or closed.
But here's where most journals stop and where mine actually starts working.
I log the context.
Why did I take this trade?
What was the reasoning?
What confluence was present?
Was BTC supporting the thesis or was I trading against the broader market?
I write this in my own words, not in technical shorthand.
The goal is that when I come back to review this trade in a week, I can read one sentence and remember exactly what I was thinking.
I log why I exited.
Did I hit TP?
Did I get stopped out?
Did I close early because I panicked?
Did the setup invalidate and I cut it manually?
The exit tells you as much as the entry — sometimes more.
I log my emotions.
Before the trade, during the trade, and after the trade.
Was I calm?
Was I anxious?
Was I feeling FOMO?
Was I disciplined or was I forcing it?
This is the column most traders skip because it feels soft.
But it's the one that shows you the real patterns. You'll start to notice that every time you log "FOMO" before the trade, the result is a loss.
That's not a coincidence. That's data.
And the most important column in the entire journal:
"Did this trade follow my plan?" Yes or no.
Green or red.
Binary.
No grey area.
A trade can be a winner and still be red — because you broke your rules and got lucky.
A trade can be a loser and still be green — because you followed the process and the market just didn't cooperate.
This column is the one that tells you if you're trading or gambling.
Before and After — Building Pattern Recognition
I take two screenshots for every trade.
One before I enter and one after the trade closes.
The before screenshot captures what I saw when I made the decision.
The chart, the setup, the levels, the reasoning — everything that made me click the button.
The after screenshot captures what actually happened.
Then I compare them.
Was what I saw before entry truly compliant with my system?
Did the setup actually meet all the criteria or did I bend the rules because I wanted to be in a trade?
Was the entry clean or did I rush it?
Could I have placed a better stop loss?
Could I have set a better target?
The outcome matters, but less than you think.
What matters more is the comparison between what you planned and what you did.
A winning trade where you broke three rules teaches you nothing good.
A losing trade where you followed every step of the process teaches you that the process works — you just got unlucky this time.
And over 100 trades, the process wins.
This before-and-after system builds something you can't get from watching charts: actual pattern recognition of your own behavior.
After a few months you start seeing your own tendencies — where you get impatient, where you move stops, where you exit too early.
That's where the real improvement comes from.
The Weekly Review — Why Weekly, Not Monthly
I review my trades every week. Not every month. Not when I feel like it. Every single week.
Why weekly?
Because your memories are still fresh.
You remember what you felt, what the market looked like, what pushed you to take the trade.
Wait a month and all of that is gone.
You're staring at numbers with no emotional context. The data is there but the story behind it is lost.
I go trade by trade. One at a time.
First question: was this trade compliant with the system?
Did it follow my rules?
Did the setup meet the criteria?
I check this first — before I even look at the result.
This is important. If you look at the PnL first, your brain will justify everything.
A winner was "obviously a good trade" and a loser was "just bad luck."
But if you check compliance first, you get an honest answer.
Second question: how was the result?
Win, loss, break even.
What R did I get?
Third question: was there anything external I missed?
Was BTC moving against me?
Was there a macro event I didn't account for?
Did I check the correlation before entering or did I trade in isolation?
This takes 15 to 20 minutes per week. That's it. And it gives you more improvement than 40 hours of screen time.
One Problem at a Time — The Compound Effect
This is the part that changed everything for me.
After the weekly review, the journal always tells you something. It highlights a pattern.
A recurring mistake. A tendency.
Week 1: the journal tells you that you were impatient. You entered before confirmation on two out of three trades.
So next week, that's the one thing you focus on. Not everything. Just patience. Wait for confirmation before you click.
Week 2: you review again. You were patient. You waited for confirmation. The system was respected. Good. Nothing to fix this week — keep going.
Week 3: the journal tells you something new. You exited too early on a trade that would have hit full TP if you had let it run.
So next week, you focus on that. Hold the trade. Trust the TP.
Week 4: you held. But now you notice you're stacking risk — too many positions open at once.
So next week, you fix that.
One problem. Maximum two. Never everything at once.
This is why I call it a marathon.
You're not going to fix your trading in one week.
You're not going to have a breakthrough moment where everything clicks.
What actually happens is you fix one small thing, then another, then another.
You compound small improvements over time.
After six months that's 25 problems addressed.
After a year that's 50.
After two years that's 100.
And at some point everything starts clicking — not because of one big change, but because of all those tiny steps stacked on top of each other.
That's how real consistency is built. Not overnight. Trade by trade. Week by week.
Setup Performance — The Dashboard That Shows Your Real Edge
When every trade is tagged to a specific setup, the data starts talking.
My journal tracks each setup type separately.
Win rate, average R per win, average R per loss, best trade, worst trade, average R per trade.
After enough trades the numbers paint a clear picture.
You start seeing things like:
Range Deviation has a 65% win rate with a 2.1R average.
3 Drive Trend wins less often at 45%, but the average R is 3.8 because the winners run further.
That tells you exactly where your edge is.
Not what you feel.
Not what you think.
What the actual data says over a real sample size.
And that changes how you trade. You stop forcing setups that don't work for you.
You double down on the ones that do.
You allocate more risk to the setup with the best numbers and less to the one that's been underperforming.
Every decision is backed by your own data, not someone else's opinion.
That's the point of the journal.
It turns you from someone who trades on instinct into someone who trades on evidence.
Your own evidence, from your own trades, reviewed every week.
The Bottom Line
A journal without a system is a diary.
A system without a journal is guessing.
Both together is how you build an edge you can actually measure and improve.
Stop tracking PnL as the main metric.
Start tracking process.
Track compliance.
Track emotions.
Track whether you followed your own rules.
The money follows. It always does — when the process is right.
I shared my trading journal template with subscribers earlier this year. If you want access, you know where to find it.
Popeye
WOO X Pro — zero fees on spot: https://t.co/iWxTrgYsA3
18 videos all for Free covering
-Auction Market Theory
-Orderflow
-Vwap
-Open Interest
-Footprint
-Execution
-Etc.
If you want me to start making videos again let me know in comments. Most of these are from 3-5 years ago
https://t.co/MS63YnvIbW
How I Read a Chart in 60 Seconds.
Most traders open a chart and immediately start drawing lines. Trendlines, fibs, indicators stacked on indicators. No structure. No process. Just visual noise.
This educational post is sponsored by @_WOO_X, where I trade crypto with zero fees on spot.
I have been doing this for years. When I open a chart cold — no context, no bias, nothing — I know what I'm looking at within 60 seconds.
Not because I'm fast. Because I follow the same 5 steps every single time.
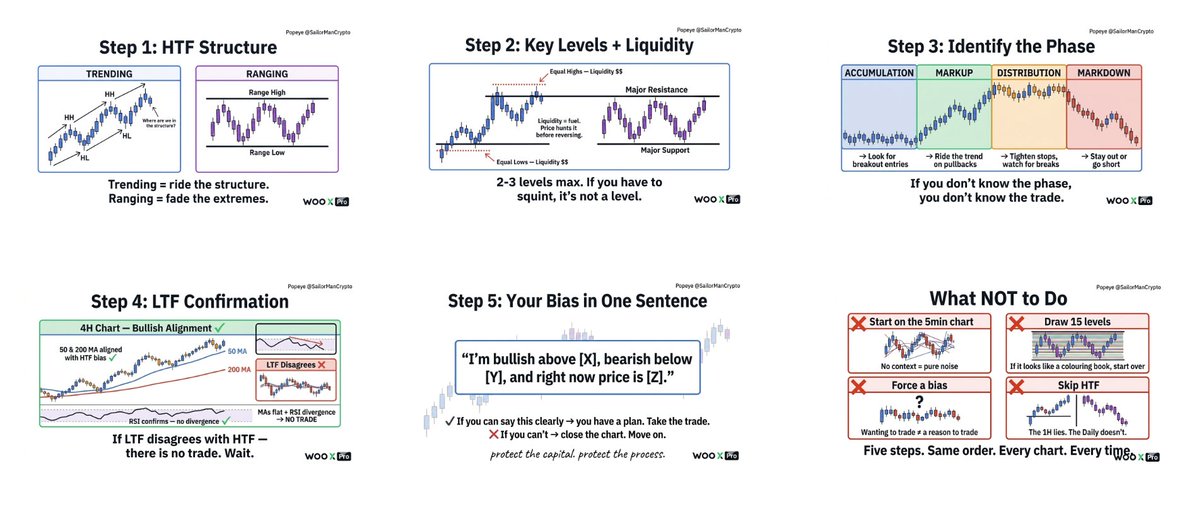
Here they are.
STEP 1 — HTF Structure First (Weekly / Daily)
Before anything else, I zoom out. Weekly or Daily chart. Clean. No indicators yet.
I'm asking one question: what is the trend?
Higher highs and higher lows? Bullish structure.
Lower highs and lower lows? Bearish structure.
Neither? Then we're in a range — and that changes everything.
If it's trending, I want to know where we are in that trend. Are we near a key support? Pushing into resistance? Mid-leg with no reference points?
If it's ranging, I define the boundaries first. Where is the range high? Where is the range low? Because in a range, the strategy flips completely — you're not chasing breakouts, you're fading extremes and waiting for deviation.
This step takes 10 seconds. And it eliminates 80% of bad trades before they start.
STEP 2 — Key Levels + Liquidity
Now I mark levels. But here's the rule: 2 or 3 levels maximum. Not 15.
I want the levels where price has reacted multiple times. The ones that are obvious. If you have to squint to see whether it's a level — it's not a level.
Then I look at liquidity. Where are the equal highs? Where are the equal lows? Where are the stop clusters likely sitting?
Liquidity is the fuel. Price needs it to move. If there's a pool of liquidity sitting above a range high, I know price is likely going to hunt it before reversing. If there are clean equal lows below support, the market will sweep them.
This is not about drawing every level you can find. It's about identifying the 2-3 zones where the real action will happen — and understanding where the liquidity traps are.
STEP 3 — Market Phase
Now I identify the phase. Every market is always in one of four phases:
1. Accumulation — price is basing after a downtrend. Low volatility, tight range, smart money is loading.
2. Markup — the trend begins. Higher highs, higher lows. This is where most of the easy money is made.
3. Distribution — price is topping after an uptrend. Same low volatility and tightness as accumulation, but at the top.
4. Markdown — the downtrend. Lower highs, lower lows. Exits and shorts.
Why does this matter? Because the phase tells you what kind of trade to look for.
In accumulation, you're looking for breakout entries. In markup, you're riding the trend on pullbacks. In distribution, you're tightening stops and watching for structure breaks. In markdown, you're either short or on the sideline.
If you don't know the phase, you don't know what you're trading. You're just reacting.
STEP 4 — LTF Confirmation (4H / 1H)
Only now do I zoom in. 4-hour or 1-hour chart.
I'm looking for three things:
Does the lower timeframe structure agree with my HTF bias? If I'm bullish on the daily, I want to see bullish structure forming on the 4H.
Moving averages — are they aligned with my bias? If price is above the 200 EMA/MA on the 4H and both are sloping up, that confirms the bullish read. If they're flat or crossing down while I'm trying to go long, something doesn't fit.
RSI — I'm not trading RSI signals. I'm checking for divergence. If price is making a new high on the daily but RSI on the 4H is making a lower high, that's a warning. If price is pushing up and RSI confirms, that's clean.
Here's the most important rule of this step: if the LTF disagrees with the HTF, there is no trade. I don't force it. I don't talk myself into it. I wait. The next setup is always around the corner.
STEP 5 — Bias in One Sentence
After those four steps — 60 seconds total — I should be able to say one sentence:
"I'm bullish above X, bearish below Y, and right now price is doing Z."
That's it. That's the whole read.
If I can say that sentence clearly, I have a bias. I have a framework. I have a plan. Now I can look for entries.
If I can't say that sentence — if it feels forced, if I'm unsure, if the data conflicts — then I don't have a read. And that's fine. I close the chart and move to the next one. There are hundreds of charts. Not every one needs to be traded.
The discipline to say "I don't have a read" is worth more than any setup.
What NOT to Do.
Don't start on the 5-minute chart. Ever. The 5-minute chart without context is pure noise. It will give you a bias that contradicts the higher timeframe and you'll lose money following it.
Don't draw 15 levels and call it "analysis." If your chart looks like a colouring book, you have too many lines. You don't need more levels — you need fewer, better ones.
Don't force a bias because you want a trade. Wanting to trade is not a reason to trade. If the chart doesn't speak to you in 60 seconds, it has nothing to say right now.
Don't skip HTF because "it looks good on the 1H." The 1H can look perfect and still be sitting right under daily resistance with bearish divergence on the weekly. Context kills bad trades before they happen.
Don't make it complicated. Five steps. Same order. Every chart. Every time.
The process is the edge.
It's not the indicator. It's not the pattern. It's not the setup. It's the process you follow before you even consider clicking buy or sell.
Same steps. Every chart. Every time. No shortcuts.
Trade spot with zero fees on WOO X Pro: https://t.co/iWxTrgYsA3
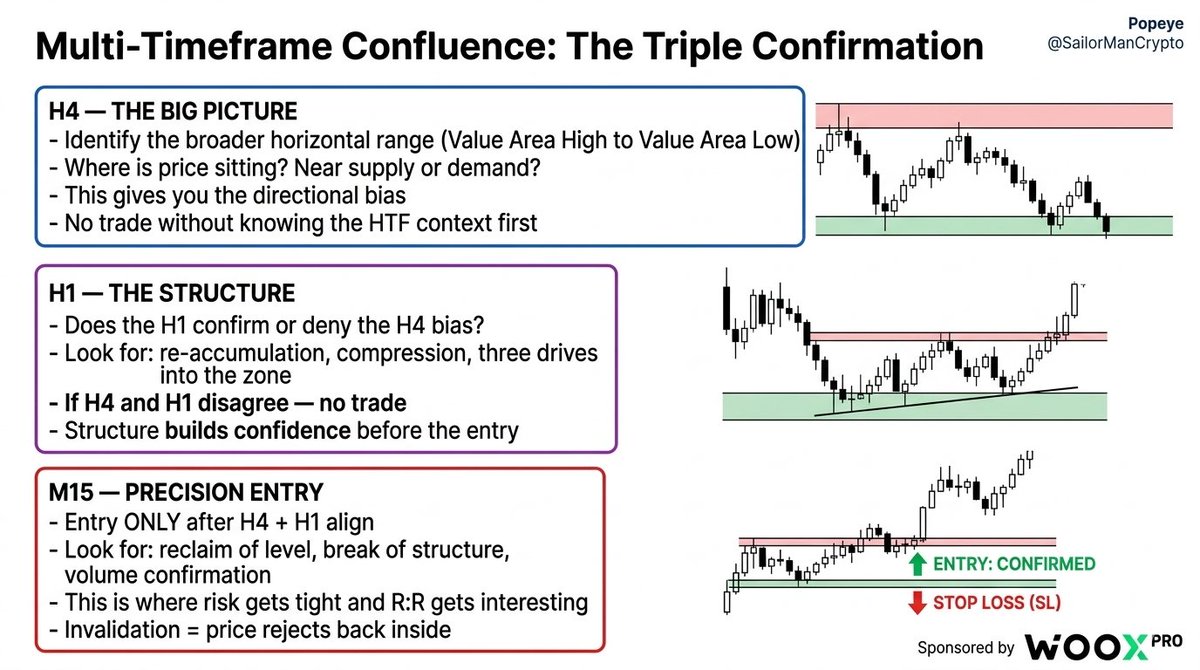
One timeframe is a guess. Three timeframes is a trade.
One of the most common mistakes I see is traders finding a setup on one timeframe and pulling the trigger immediately.
That's not a trade.
That's a coin flip with extra steps.
This educational post is sponsored by @_WOO_X — where I trade crypto with zero fees on spot.
Here's how I actually build a position — and why I need multiple timeframes to agree before I risk anything.
Start with the H4 — the big picture.
Where is price sitting in the broader range?
Is it near a key demand or supply zone?
This gives you the directional bias. Nothing else matters until you know this.
Then drop to the H1 — the structure.
This is where patterns develop.
Re-accumulation, compression, three drives into the zone.
The H1 confirms or denies what the H4 is suggesting. If they disagree, I sit on my hands.
Finally the M15 — precision entry.
You already know the direction.
You already know the zone. Now you're waiting for the trigger — a reclaim, a break of structure, a volume confirmation at the level.
This is where the risk gets tight and the R:R gets interesting.
The magic isn't in any single timeframe.
It's in the overlap.
When the H4 shows demand, the H1 builds a re-accumulation into that demand, and the M15 gives you a confirmed entry — that's when I trade.
Multiple reasons. One position. Tight risk.
Most traders skip the top-down process because it feels slow.
But honestly, this is the part that separates the setups that work from the ones that stop you out right before the move.
I execute these setups on @_WOO_X — zero fees on spot, which matters when you're scaling in and out across timeframes.
One single setup might be wrong. But the process keeps me in the game.
Popeye
#bitcoin #TradingStrategies


![Luckshuryy's tweet photo. i've gone through quite a few journals the past few years
[ what didn't work ]:
- taking over 2 to 3 trades per day
- back to back entries (re-entering after a loser)
- trading too many pairs (spreading themselves thin)
- random sizing
- only using market orders (they’d always be offside anyways)
- executing using timeframes below 5m
- not having daily structure (some morning routine)
- adding to a losing position (quite obvious)
- entering before knowing where they would exit
[ what was working ]:
- limiting trading to certain session hours (new york/close)
- planning specific levels (not zones) before each session
- sizing in accordance to regime (example: 5d vs 60d atr)
- increasing initial trade size once already in profit
- focusing on price action from their avg trade time
- trading majors (btc,eth) nothing smaller than solana
- aiming for a 45% + win rate (low-mid win % in general)
[ why they were messing up ]:
- trading pnl graph (thinking of past results)
- not accounting for probabilities resetting
- social media impact on their execution
- spreading thin across pairs to avoid boredom
- inability to not mess with an open position
- not stepping away from the desk frequent enough
- outcome focused mindset over input focused
[ actions they used to fix ]:
- collected data (having data = conviction)
- reviewing after every trade (creates time delay)
- turn off the pnl completely
- adopting a 3 question checklist before entering
- removing all trading apps from phone
- strictly limiting time on socials (lookup "brick - social")
none of this is to say there’s a right or wrong way to trade.
i'm 100% certain there are people trading 20 trades per day making money, and people trading 15 different pairs too.
i just wanted to share my personal observations from people I have worked with.](https://pbs.twimg.com/media/HIr8DHubYAAn8s5.jpg)