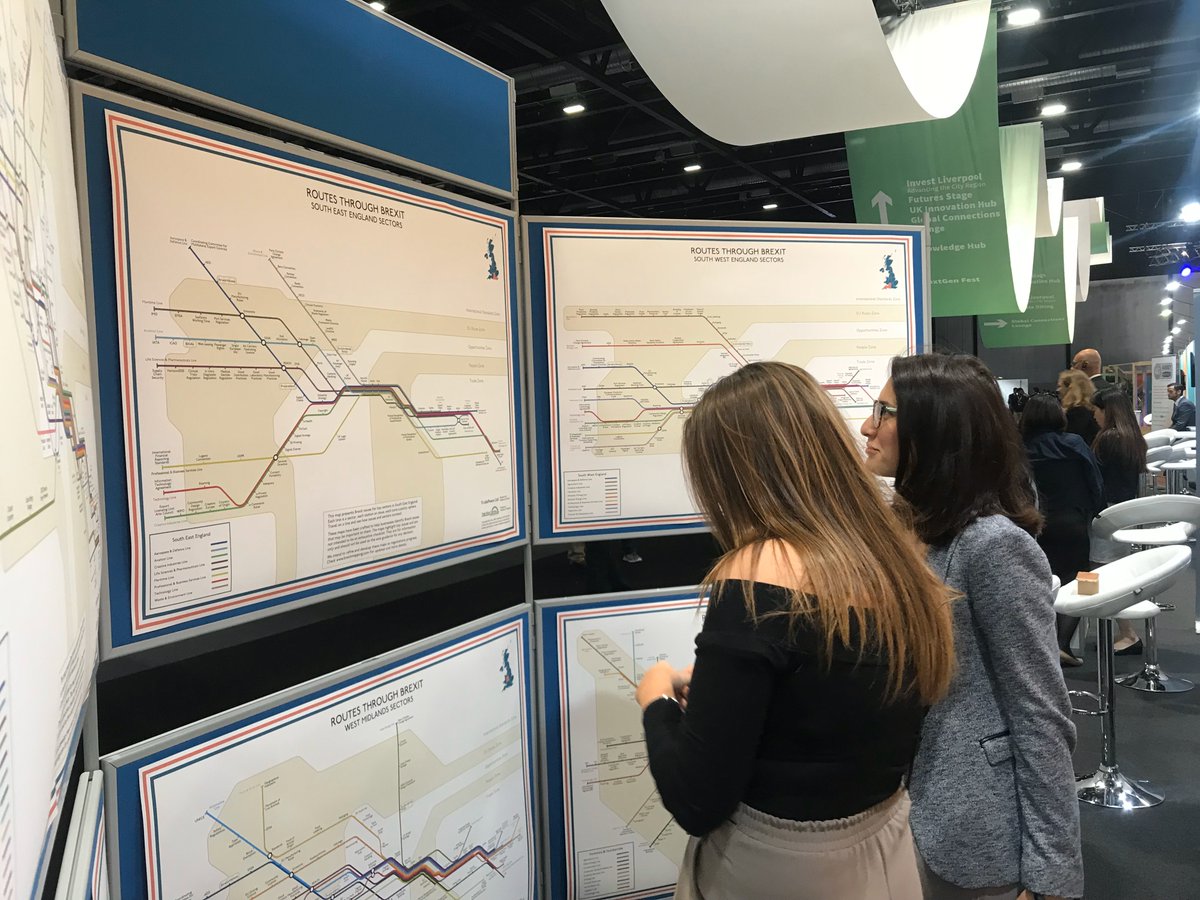
A picture is said to be worth 1,000 words, but this one is 24,000: the number in the Ireland/Northern Ireland Protocol. We have interpreted this graphically, showing how trade flows of the British Isles will be governed by rules that apply post transition https://t.co/JmfvrZMG6R
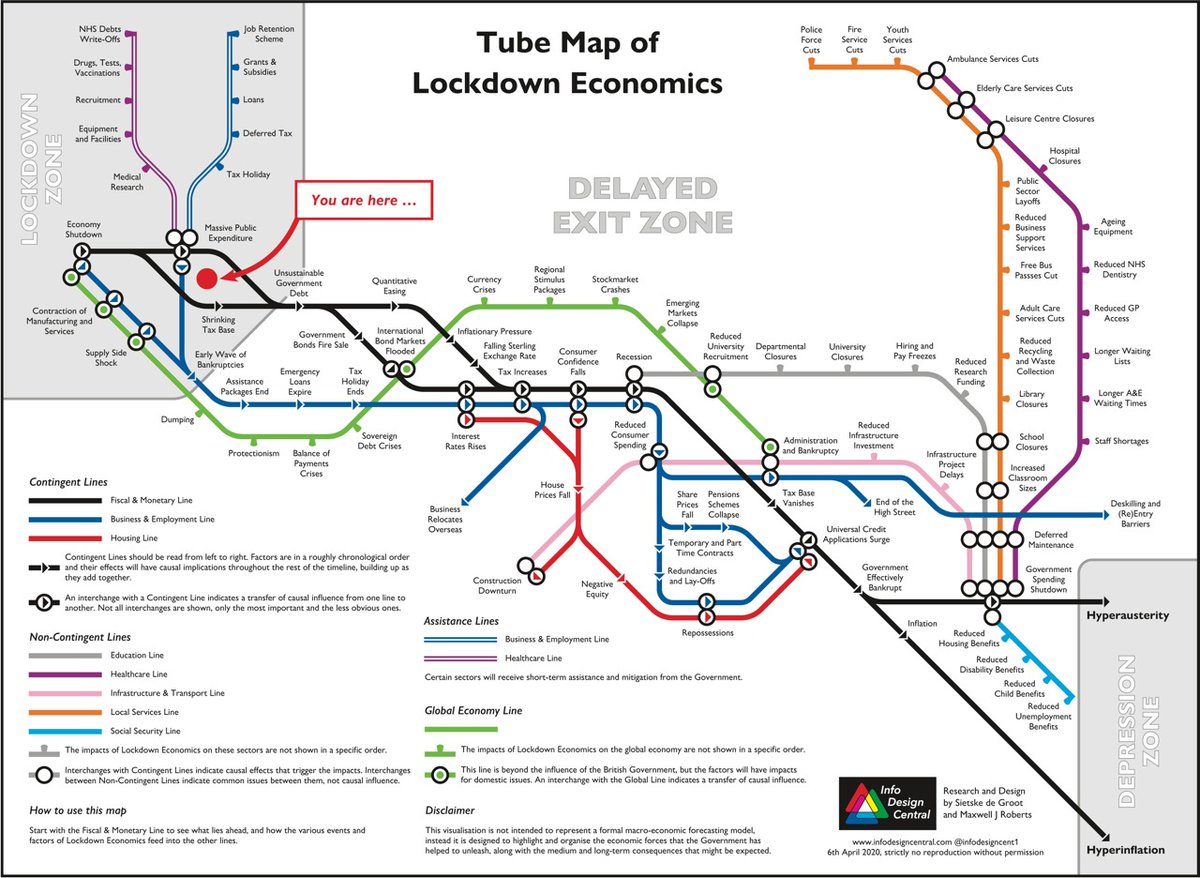
@simondolan Meanwhile, in the world of people on the receiving end of Ferguson's treatments, the unleashed forces of economics build up. Tube Map of Lockdown Economics from Info Design Central, https://t.co/eDpgFVeoud
There are complicated, emotional issues to resolve with the #Corona crisis. To illuminate factors that have perhaps been neglected in these difficult times, we created a Tube Map of #lockdowneconomics and an explanatory blog
https://t.co/MVrRtY2yMZ: #hyperausterity#lockdown2
Good #informationdesign can illuminate any complex topic. If you have ever struggled with making sense of a woodwind instrument, this map shows that there are hidden patterns to the fingering
Two years ago we created #Brexit Maps. We intended to update them by “closing” stations (issues) as negotiations progressed. However, none have been crossed out yet and the maps are as relevant to businesses today as they were two years ago: https://t.co/eDpgFVeoud
Tube Map Central and TradePeers are delighted to announce our new joint venture: Info Design Central. Our mission: to create research-based #infographics that clarify complex issues in accessible ways. Check out our new website: https://t.co/eDpgFVeoud