Two live FX strategies. Two different architectures.
🔶 Coral Smart Hedge DCA
• 5+ years live
• 8,000+ trades
• ~77% profitable trades
🔷 CoralGrid DCA Sentinel
• New-generation system
• Directional signal entries
• Progressive DCA
• Sentinel Hedge protection
Both run on live accounts with independently tracked performance.
Compare the strategies & review the live track records:
https://t.co/ScP99ufowH
Past performance does not guarantee future results. Forex trading involves substantial risk.
Canada has weaker employment, but why does USDCAD still carry a momentum warning? Read the distinction between the existing risk instruction and weekly structural invalidation.
USDCAD W42: bullish three-week view, low confidence.
At 15/10/2026 09:35 UTC, USDCAD was 1.42165, below weekly VWAP 1.42485 and above weekly TrendSL 1.39741. Source: mt5:USDCAD:1m, a timestamped broker quote.
The momentum warning is already active: price is below the weekly average, running against the bullish thesis. For existing longs, reduce position size now; this is not a future contingency and requires no daily or weekly close.
A completed weekly close below 1.39741 would invalidate the bullish structure, requiring an exit from longs and reassessment. That structural condition remains pending.
https://t.co/ZobkbfjsSW
---
Intermarket Edge | Institutional Macro & Intermarket Analysis
For information and education only. Not financial advice.
USDCAD W42: a bullish three-week view with low confidence. The upward structure does not make every long entry attractive.
At 15/10/2026 09:35 UTC, USDCAD was 1.42165, below weekly VWAP 1.42485 and above weekly TrendSL 1.39741. Source: mt5:USDCAD:1m, a timestamped broker quote.
The momentum warning is already active: price is below the weekly average, running against the bullish thesis. For existing longs, reduce position size now; this is not a future contingency and requires no daily or weekly close.
A completed weekly close below 1.39741 would invalidate the bullish structure, requiring an exit from longs and reassessment. That structural condition remains pending.
Canada's September employment decline, reported on 9 October, remains prior-week context. Reduced expectations of another BoC increase do not establish a commitment to cut rates. Reuters reported dollar gains after US inflation data on 14 October, but a verified actual-versus-consensus comparison is not available in this analysis. The headline cannot establish the size or direction of an inflation surprise.
The supplied Reuters feed describes CAD weakness alongside different benchmark-yield moves at different times. Compare US and Canadian yields of the same maturity before concluding that the spread has widened. Follow DXY and oil as additional checks; neither an old dollar thesis nor a general oil relationship substitutes for a fresh observation.
ForexFactory's secondary calendar lists US PPI and retail sales on 15 October and a Fed Chair appearance on 16 October. Outcomes are unknown. A recovery of the weekly average that holds, with supportive cross-market reactions, would improve the timing argument. A failed recovery or renewed CAD support would challenge it.
Existing longs face an active instruction to reduce exposure. New entries can wait for clearer price behaviour after the releases. No target or win probability follows from the distance to the structural reference.
The FXSSI broker sample dated 15 October is 85% short. That is limited retail context, not proof of stop locations or a coming short squeeze. The percentage alone does not raise confidence.
#USDCAD #CAD #USD #Forex
US September CPI: headline did what oil told it to, core did not.
Headline 3.7% y/y vs 3.6% expected, 0.6% m/m in line. Core 0.3% m/m vs 0.2%, 2.6% y/y vs 2.5%, two tenths above the broader 2.4% street call. That core beat undercuts the case for the Fed looking through the energy shock.
The front end led: 2Y up about 15bp, 10Y up about 10bp, DXY +0.5%, gold -1.6%, VIX still near 15.7. This is a rates-channel dollar bid, not a haven bid, so CHF and EUR take the hit.
The ceiling is lower than it looks. The ECB, BoJ and BoE are all leaning hawkish into the same oil shock, September payrolls added just 29k, and US real wages are negative. The cleanest expression is fading EURUSD rallies. Chasing USDJPY toward intervention territory is not.
Watch the 2Y: if it gives back the CPI move, so does the dollar.INTERMARKET EDGE | US SEPTEMBER CPI: HEADLINE ON SCRIPT, CORE IS THE SURPRISE
14 Oct 2026
---
THE DATA
→ CPI y/y: 3.7% (forecast 3.6%, prior 3.4%)
→ CPI m/m: 0.6% (in line)
→ Core m/m: 0.3% (forecast 0.2%)
→ Core y/y: 2.6% (forecast 2.5%, broader consensus 2.4%)
The energy component was already priced. The real information sits in core: two tenths above consensus, enough to shake the argument that the Fed can look through the oil shock. Before the release, the probability of an October Fed hike was only about 22%.
---
CROSS-MARKET REACTION
→ US2Y up about 15bp, US10Y up about 10bp: the front end led, the market is repricing the near-term Fed path
→ DXY +0.5%, CHF and EUR the weakest in the basket
→ Gold -1.6%, silver -2.5% on higher real yields
→ VIX 15.7, equities only slightly lower
This is a dollar bid through the rates channel, not a haven flow. In this regime, low-yielding currencies take the heaviest hit.
---
DXY: CONDITIONAL UPSIDE BIAS
Short term the dollar is supported as long as US2Y holds its post-CPI gains. Over the medium term three forces cap it:
→ Not a one-way divergence: the ECB has hiked to 2.50% with eurozone inflation at 3.8%, the BoJ sits at 1.25%, the BoE held at 3.75% with three votes for a hike
→ Stagflation risk: September payrolls added just 29k jobs, nominal wages at 3.0% trail CPI at 3.7%, real income is negative
→ Chair Warsh dislikes forward guidance, so Thursday's data and Friday's remarks carry unusual weight
---
G7 MAP
→ EURUSD: cleanest setup, sell rallies. ECB October hike expectations are fading, the US-German yield spread is widening
→ USDCAD: buy dips, moderate size. The 175bp rate gap favors USD, oil is the variable that cushions CAD
→ EURGBP: leaning toward selling rallies. The BoE is more hawkish than the ECB, the risk is a gilt shock
→ GBPUSD: neutral, GBP is absorbing the hit better than EUR
→ USDJPY: do not chase. Upside to 160 to 162 is only 2 to 4 yen, while a 3% intervention move from the 158 area is about 4.7 yen
→ EURJPY: stay sidelined until the ECB 29 Oct and BoJ 30 Oct window
Common invalidation: US2Y gives back the entire CPI move, returning to the 4.77 to 4.80 zone.
---
WHAT TO WATCH (GMT)
→ 18:00 Wed 14 Oct: Fed Beige Book
→ 12:30 Thu 15 Oct: PPI, retail sales, jobless claims, Philly Fed
→ Fri 16 Oct: Chair Warsh speaks in Bangkok
→ 13:45 Wed 28 Oct: BoC
→ 18:00 Wed 28 Oct: FOMC
→ 13:15 Thu 29 Oct: ECB
→ Fri 30 Oct: BoJ
---
This is analysis, not investment advice. Manage your own risk and position size within your system.
Intermarket Edge | Institutional Macro & Intermarket Analysis
EURUSD has a bearish trend, but why is the analysis waiting before CPI?
At 14/10/2026 05:57 UTC, EURUSD was 1.12099, above weekly VWAP 1.11921. Price remains below weekly TrendSL 1.14514. Source: mt5:EURUSD.sml:1m, a timestamped broker quote.
The short-term momentum warning against the bearish thesis is already active. Existing short exposure calls for reviewing and reducing risk under the trader's plan now; this warning does not require a weekly or session close.
A completed weekly close above 1.14514 would invalidate the bearish structure, requiring an exit from the bearish thesis and reassessment. This condition remains pending; an intraday move is not a completed weekly close.
Pre-release analysis: September US CPI is scheduled for 14 October at 12:30 UTC / 19:30 GMT+7. No actual release outcome or post-release reaction is assumed. Update this analysis after publication of the data.
Read the policy context, the intermarket checks and the limits of retail positioning: https://t.co/aefx7y4GAm
---
Intermarket Edge | Institutional Macro & Intermarket Analysis
For informational and educational purposes only. Not financial advice.
EURUSD W42 retains a bearish three-week view with low confidence. Price is already challenging that direction.
At 14/10/2026 05:57 UTC, EURUSD was 1.12099, above weekly VWAP 1.11921. Price remains below weekly TrendSL 1.14514. Source: mt5:EURUSD.sml:1m, a timestamped broker quote.
The short-term momentum warning against the bearish thesis is already active. Existing short exposure calls for reviewing and reducing risk under the trader's plan now; this warning does not require a weekly or session close.
A completed weekly close above 1.14514 would invalidate the bearish structure, requiring an exit from the bearish thesis and reassessment. This condition remains pending; an intraday move is not a completed weekly close.
Pre-release analysis: September US CPI is scheduled for 14 October at 12:30 UTC / 19:30 GMT+7. No actual release outcome or post-release reaction is assumed. Update this analysis after publication of the data.
Collins on 13 October kept further Fed tightening in view, conditional on incoming data. The supplied Williams recap mentions a possible additional hike, not a committee commitment. Lane's ECB speech describes tighter financial conditions from global long-term rates, not an ECB rate promise.
Watch DXY and comparable US-German yields after the release. A firmer dollar and a relative yield shift toward the US would support the bearish interpretation; the opposite combination would challenge it. A US yield alone cannot establish the spread, and softer CPI does not guarantee lower real yields.
For new exposure, wait for clearer agreement between price and the wider evidence before assessing an entry. No new weekly-close rule is attached to VWAP. The structural closing condition is separate from the momentum warning.
FXSSI's broker sample recorded at 05:45:43 UTC on 14 October shows 68% on the buy side and 32% on the sell side. The precise provider observation time is not established here. This is not the whole currency market and does not locate stops, measure leverage or prove that a reversal is imminent. The buying majority supplies contrarian context, not an independent reason to sell. Distinguish the existing price warning from a prediction about how the next release will trade.
#EURUSD #CPI #ECB #DXY
@ZacTradesFX Appreciate that. You’ve captured the tension well. A directional lean still needs price confirmation; when the drivers pull in different directions, confidence should reflect that. I’d rather be transparent about the uncertainty than force a stronger call.
GBPUSD W42: A bearish three-week view, with low confidence.
At 13/10/2026 05:01 UTC, GBPUSD was 1.32168, below weekly VWAP 1.32403 and below weekly TrendSL 1.34076. Source: mt5:GBPUSD.sml:1m, a timestamped broker quote.
If price sustains above 1.32403, the momentum warning against the bearish thesis would activate and call for reducing risk. This condition remains pending; it does not require a weekly close.
A completed weekly close above 1.34076 would invalidate the bearish structure, requiring an exit from the bearish thesis and reassessment. This condition remains pending.
Mace News headlines on 13 October report Greene calling for proactive action against second-round inflation risks while describing a loose UK labour market. This is one MPC member's view, not a rate decision. Firmer UK rate expectations could support sterling relative to the dollar; the remarks are not automatically bearish for GBP.
Reuters on 12 October described sterling holding steady as the dollar remained firm. Watch DXY and comparable UK-US yields to assess whether that pressure persists. A US yield level alone cannot establish the spread, and a softer CPI result does not guarantee lower real yields.
ForexFactory, a secondary calendar source retrieved on 13 October, lists US CPI on 14 October, UK GDP and US retail sales/PPI on 15 October, and BoE Governor/Fed Chair appearances on 16 October. Outcomes are unknown.
For new exposure, wait for the releases and the subsequent currency and bond response before assessing entry timing. Existing shorts should distinguish the momentum warning from structural invalidation and apply their own risk limits. A downward trend does not make every entry attractive.
FXSSI's broker sample dated 13 October shows 71% on the buy side and 29% on the sell side. The precise provider observation time is not established here. This is not the whole currency market and does not locate stops, quantify leverage or prove that forced selling will follow. Its contrarian context cannot replace confirmation from price and relative yields. The earlier Reuters report linking sterling strength to lower oil is prior-week context only.
#GBPUSD #BoE #DXY #CPI
GBPUSD has a bearish trend, but could firmer BoE expectations challenge the next move? The three-week view has low confidence.
At 13/10/2026 05:01 UTC, GBPUSD was 1.32168, below weekly VWAP 1.32403 and below weekly TrendSL 1.34076. Source: mt5:GBPUSD.sml:1m, a timestamped broker quote.
If price sustains above 1.32403, the momentum warning against the bearish thesis would activate and call for reducing risk. This condition remains pending; it does not require a weekly close.
A completed weekly close above 1.34076 would invalidate the bearish structure, requiring an exit from the bearish thesis and reassessment. This condition remains pending.
The full analysis examines Greene's inflation argument, the UK-US yield comparison and the limits of retail positioning. Follow DXY and bond responses around the data rather than assuming a headline guarantees a currency move.
Read the analysis: https://t.co/OrH5CbG8lt
---
Intermarket Edge | Institutional Macro & Intermarket Analysis
For informational and educational purposes only. Not financial advice.
Gold is rebounding, but the broader trend assessment still points down. Why does the analysis choose to stand aside?
At 12/10/2026 07:41 UTC, XAUUSD was 4198.50 USD per troy ounce, above weekly VWAP 4195.23. Price remains below weekly TrendSL 4394.02. Source: mt5:XAUUSD.sml:1m, a timestamped broker quote. The near-term momentum warning against the bearish view is already active. This is not a future contingency and does not require a weekly close.
The full article examines:
-> Why lower oil does not automatically lower real yields.
-> How to separate a rebound from a structural reversal.
-> What the FXSSI broker sample can and cannot establish.
A completed weekly close above 4394.02 would invalidate the bearish structure. That condition remains pending; an intraday move is not a completed weekly close.
Read the full analysis: https://t.co/Ioo9wNvfwP
---
Intermarket Edge | Institutional Macro & Intermarket Analysis
For informational and educational purposes only. Not financial advice.
Gold W42: Bearish direction, stand-aside decision.
Daily, weekly and monthly trend assessments point down, but near-term momentum is working against the bearish view. A rebound is not yet a structural reversal, and the trend alone does not justify a new short.
At 12/10/2026 07:41 UTC, XAUUSD was 4198.50 USD per troy ounce, above weekly VWAP 4195.23. Price remains below weekly TrendSL 4394.02. Source: mt5:XAUUSD.sml:1m, a timestamped broker quote. The near-term momentum warning against the bearish view is already active. This is not a future contingency and does not require a weekly close.
A completed weekly close above 4394.02 would invalidate the bearish structure. That condition remains pending; an intraday move is not a completed weekly close.
Reuters on 12 October linked gold's rise to a softer dollar and oil. Actual extra energy supply remains uncertain. Lower oil does not automatically lower real yields: nominal yields and inflation expectations can change differently.
ForexFactory, a secondary calendar source retrieved on 12 October, lists CPI on 14 October, retail sales and PPI on 15 October, and a Fed Chair appearance on 16 October.
For new exposure, wait for clearer agreement between price and the wider evidence. Existing short exposure warrants reviewing and reducing risk under the trader's plan while the warning is active. Check fresh DXY and real yields alongside gold after the releases; do not assume one inflation outcome guarantees a particular currency or bond response.
The entry trap is confusing an intact downward trend with attractive timing. A single price observation does not establish sustained acceptance, and the weekly average can change as the week develops. Its role differs from the completed weekly closing condition at the structural reference. Neither distance to that reference nor the direction of the last headline provides a position size. The 09 October bargain-buying report is historical context, not a new support level. No investor-flow claim follows simply because gold rose while oil fell.
#Gold #XAUUSD #RealYields #DXY #CPI
DXY enters inflation week with an upward trend, yet the three-week view leans bearish with low confidence. What would turn that disagreement into usable evidence?
At 12/10/2026 06:15 UTC, DXY was 102.218, below weekly VWAP 102.239. Price is already above weekly TrendSL 100.329. Source: yfinance:DX-Y.NYB:1m, a timestamped one-minute observation.
The full analysis separates the momentum watch from the weekly structural condition:
-> Why one observation around the weekly average is insufficient.
-> How oil and EUR can complicate the US inflation story.
-> What broker-sample positioning can actually tell us.
A completed weekly close below 100.329 would provide bearish structural confirmation. This condition remains pending; an intraday move is not a completed weekly close.
Read the full analysis on the website:
https://t.co/jgChpmnFxk
---
Intermarket Edge | Institutional Macro & Intermarket Analysis
For informational and educational purposes only. Not financial advice.
DXY W42: An upward trend meets an unconfirmed bearish view.
The three-week assessment leans lower with low confidence, while daily, weekly and monthly trend readings remain upward. That conflict is already present.
At 12/10/2026 06:15 UTC, DXY was 102.218, below weekly VWAP 102.239. Price is already above weekly TrendSL 100.329. Source: yfinance:DX-Y.NYB:1m, a timestamped one-minute observation.
Two conditions matter:
• Sustained trading on the higher side of the weekly average would work against the bearish view. A single observation is insufficient; no weekly-close rule is attached to this momentum watch.
• A completed weekly close below 100.329 would provide bearish structural confirmation. This condition remains pending; an intraday move is not a completed weekly close.
Reuters on 12 October highlighted inflation risk and oil uncertainty around a potential energy ceasefire. Lower oil could ease energy costs if sustained, but additional supply is not confirmed. Check EURUSD and yields before assigning a dollar effect.
ForexFactory, a secondary calendar source retrieved on 12 October, lists CPI on 14 October, retail sales and PPI on 15 October, and a Fed Chair appearance on 16 October. Outcomes are unknown.
Waiting for stronger agreement is reasonable for readers without exposure. Existing bearish positions face an intact upward structure; bullish positions still need resilience after the releases.
The main trap is treating a plausible policy story as an entry signal. Softer inflation could reduce expected tightening without establishing a rate-cut cycle. Relative-rate claims require comparable observations for the other currencies, not just a US release. Euro weakness discussed by Reuters on 09 October remains prior-week context until refreshed. The index can rise because its largest counterpart weakens; that alone does not demonstrate broad USD strength or investor flows. After the releases, reassess price against updated weekly levels instead of extending an early-week observation across the entire analysis horizon.
#DXY #USDollar #CPI #ForexAnalysis #IntermarketAnalysis
DXY enters inflation week with an upward trend, yet the three-week view leans bearish with low confidence. What would turn that disagreement into usable evidence?
At 12/10/2026 06:15 UTC, DXY was 102.218, below weekly VWAP 102.239. Price is already above weekly TrendSL 100.329. Source: yfinance:DX-Y.NYB:1m, a timestamped one-minute observation.
The full analysis separates the momentum watch from the weekly structural condition:
-> Why one observation around the weekly average is insufficient.
-> How oil and EUR can complicate the US inflation story.
-> What broker-sample positioning can actually tell us.
A completed weekly close below 100.329 would provide bearish structural confirmation. This condition remains pending; an intraday move is not a completed weekly close.
Read the full analysis on the website: https://t.co/qen2EAAnHY
https://t.co/jgChpmnFxk
---
Intermarket Edge | Institutional Macro & Intermarket Analysis
For informational and educational purposes only. Not financial advice.
The yen was heading for a fourth weekly decline, yet buying the USDJPY trend still faces a momentum warning. The week had not closed.
At 04:54 UTC on October 9, 2026, USDJPY was 157.811 on MT5 USDJPY.sml:1m. Price 157.81 is below weekly VWAP 158.04. The adverse momentum warning is already active, not a future condition.
Price remains above TrendSL 157.54. Only a completed weekly close below 157.54 would invalidate the bullish structure. That condition is pending; an intraday crossing is insufficient.
Explore the full analysis: https://t.co/DQKRpNow2w
Intermarket Edge | Institutional Macro & Intermarket Analysis
For informational purposes only. Not financial advice.
USDJPY W41 | An uptrend with an active momentum warning
At 04:54 UTC on October 9, 2026, USDJPY was 157.811 on MT5 USDJPY.sml:1m. Price 157.81 is below weekly VWAP 158.04. The adverse momentum warning is already active, not a future condition.
Price remains above TrendSL 157.54. Only a completed weekly close below 157.54 would invalidate the bullish structure. That condition is pending; an intraday crossing is insufficient.
A sustained recovery through the weekly average would prompt reassessment of momentum. This does not require a weekly close. The decision at the snapshot is to stand aside, with a three-week review window.
Japan's August real household spending fell 3.1% YoY but increased 0.1% MoM seasonally adjusted, according to the supplied Mace News headlines. Compare fresh US-Japan yields and dollar behavior; equity weakness alone does not establish yen inflows.
FXSSI Current Ratio collected at 04:54:25 UTC on October 9: 57% Buy / 43% Sell. Collection time, not verified provider observation time. This broker retail sample is not the whole FX market or a standalone entry signal.
The entry trap is treating agreement across trend measures as permission to buy immediately. An intact structure does not resolve the adverse momentum already visible at the snapshot. A weekly structural reference also does not automatically define the right execution stop for every position.
The bullish case would become more coherent if momentum recovered and comparable US-Japan yields supported the same explanation. Continued weakness would instead increase attention on the weekly structural condition. Neither scenario is a forecast with a guaranteed target, and neither has an assigned probability.
Use DXY as a cross-check, remembering that euro-specific weakness can lift the index. The pair and the index need not move identically. For readers without exposure, waiting remains consistent with the framework; a directional view does not require immediate participation.
Educational analysis, not a trade recommendation.
#USDJPY #Yen #DXY #IntermarketAnalysis
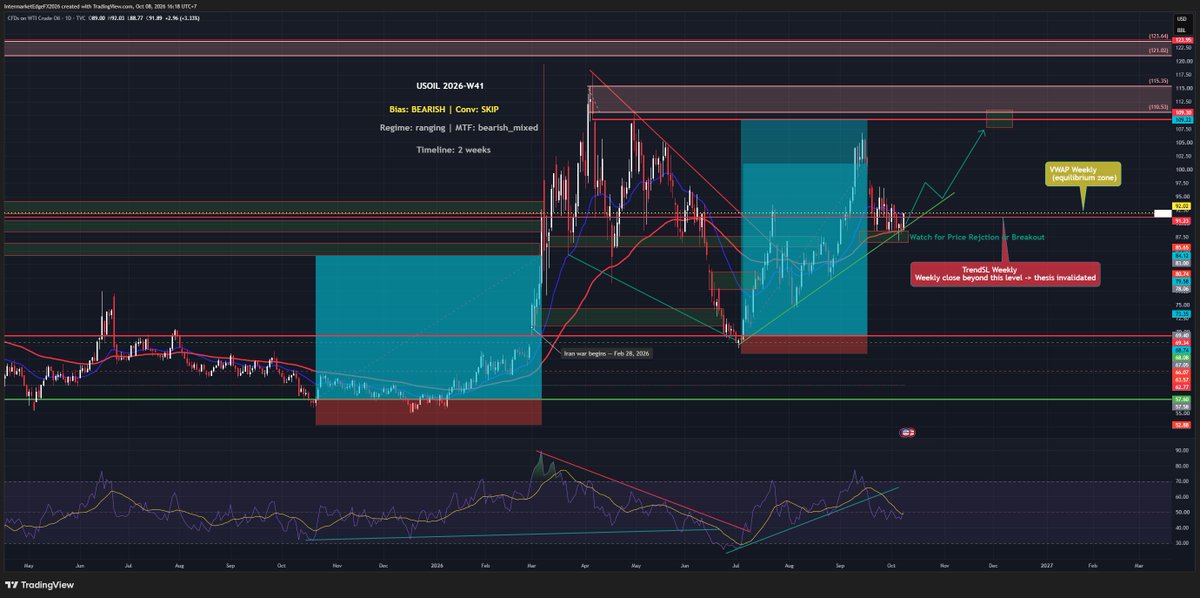
Supply-risk headlines support oil, but the previous rally failed to hold. The more important question is whether price confirms the bearish interpretation.
USOIL was 91.836 at 08:44 UTC on October 8, 2026 (MT5 USOIL.sml:1m), displayed as 91.84. Price is below weekly VWAP 92.02 and already above weekly TrendSL 91.23. The structural conflict with the bearish view is active now, not a future risk.
A completed weekly close below 91.23 would provide bearish structural confirmation for the first time. This is confirmation, not invalidation, and remains pending. An intraday crossing is insufficient.
Read the full analysis for the inventory components, the dollar cross-check and the distinct momentum warning.
https://t.co/Lw8q75W67K
Intermarket Edge | Institutional Macro & Intermarket Analysis
For informational purposes only. Not financial advice.
USOIL W41 | Supply fears, demand doubts, no confirmed short setup
USOIL was 91.836 at 08:44 UTC on October 8, 2026 (MT5 USOIL.sml:1m), displayed as 91.84. Price is below weekly VWAP 92.02 and already above weekly TrendSL 91.23. The structural conflict with the bearish view is active now, not a future risk.
A completed weekly close below 91.23 would provide bearish structural confirmation for the first time. This is confirmation, not invalidation, and remains pending. An intraday crossing is insufficient.
If price sustains above 92.02, momentum would work against the bearish view and call for a short-side risk review. This warning is pending and does not require a weekly close.
Shipping and storm headlines describe supply risks, not quantified outages. Trading Economics, citing EIA for the week ended October 2, reported crude stocks down 3.186 million barrels, Cushing up 0.444 million and gasoline up 0.382 million. The components are mixed. Barchart reported a demand-forecast reduction; no exact revision is asserted here.
Compare fresh dollar moves with oil-specific evidence. A weaker dollar is not another bearish oil signal by itself. The decision is to stand aside over a two-week review horizon while structure and direction disagree. This is a dated broker quote, not an exchange futures settlement.
The entry trap works both ways. A buyer can mistake a disruption concern for confirmed physical losses. A seller can mistake a bearish interpretation for completed technical confirmation. A report of futures turning lower despite the inventory draw is a price response to that same event, not a separate supply-demand shock.
For existing exposure, risk limits matter before any weekly condition is completed. A level used to assess structure is not automatically the correct execution stop for every position. A range also does not establish equal odds of an upward and downward move. Follow actual evidence rather than attaching invented probabilities to the two scenarios.
Educational analysis, not a trade recommendation.
#USOIL #WTI #Energy #IntermarketAnalysis