Q1 real GDP is down by .3%. Is this the recession the bond market had been predicting? Could be but seems like a stretch. Good forecasts depend on good data and manageable uncertainty and we haven't had much of either in recent times.
Employment increased in February by 151K as per the establishment survey, less than expected, and DECREASED by 588K as per the household survey. Quite frankly, it's getting harder to make sense of the monthly fluctuations and revisions in these numbers.
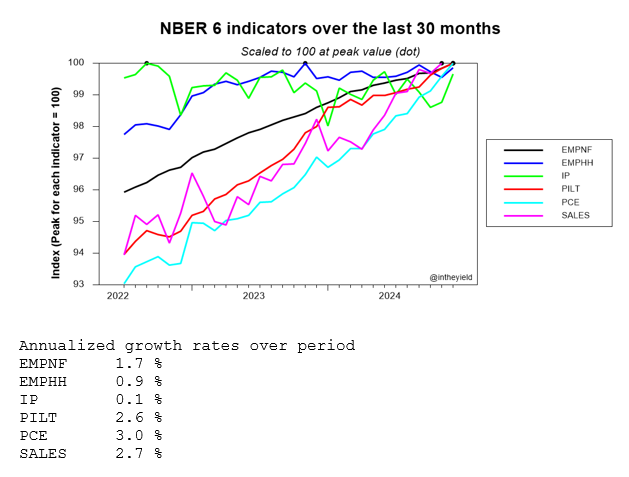
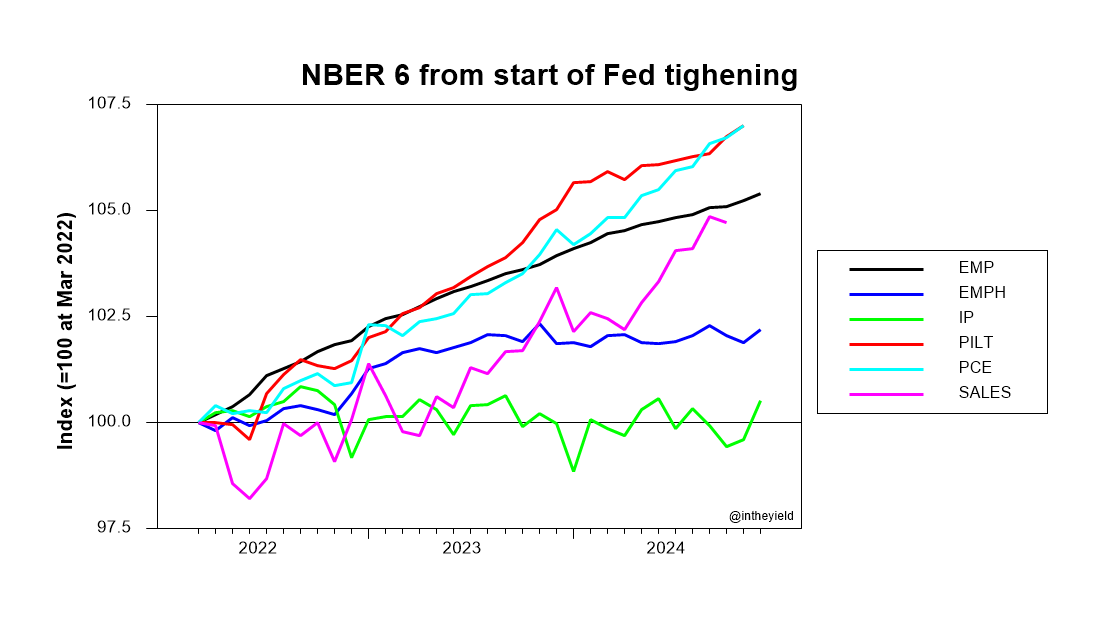
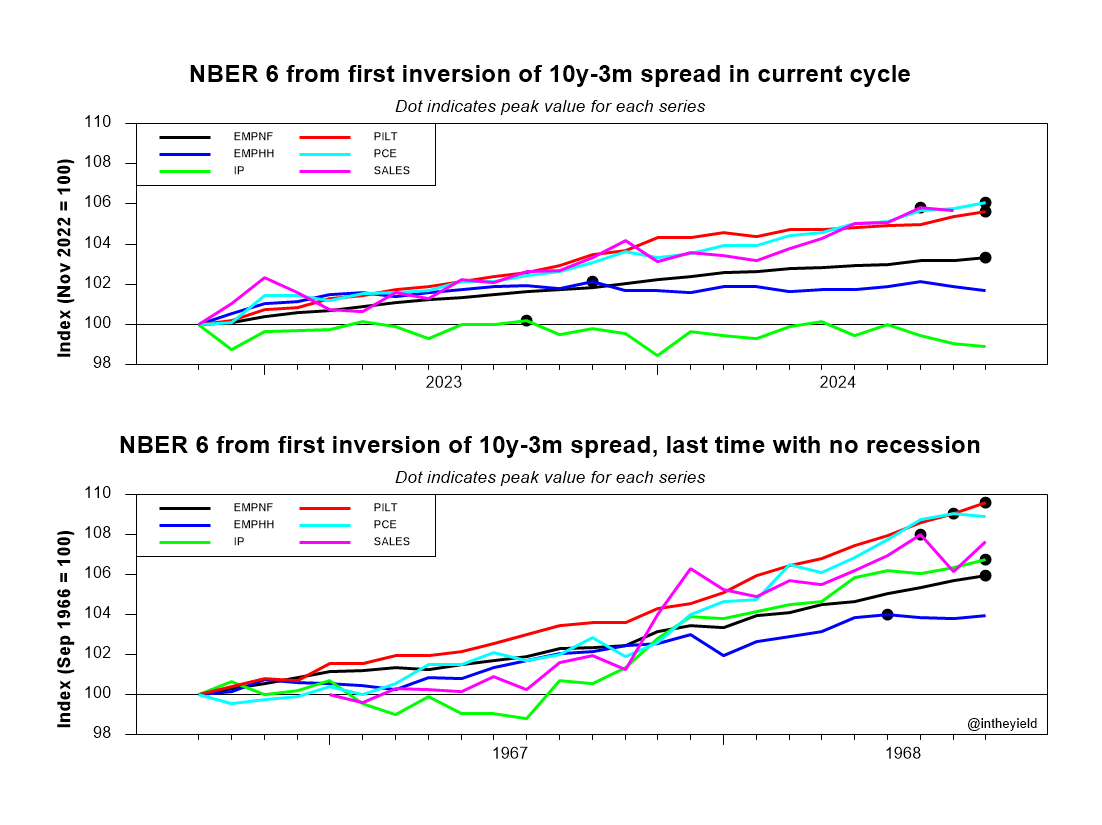
Worried about tariffs, inflation and recession? Here's a new way to track the NBER 6 recession indicators. Shows the last 30 months scaled to the peak of each series. Employment (household) and industrial production already look fragile. The rest look OK for now.
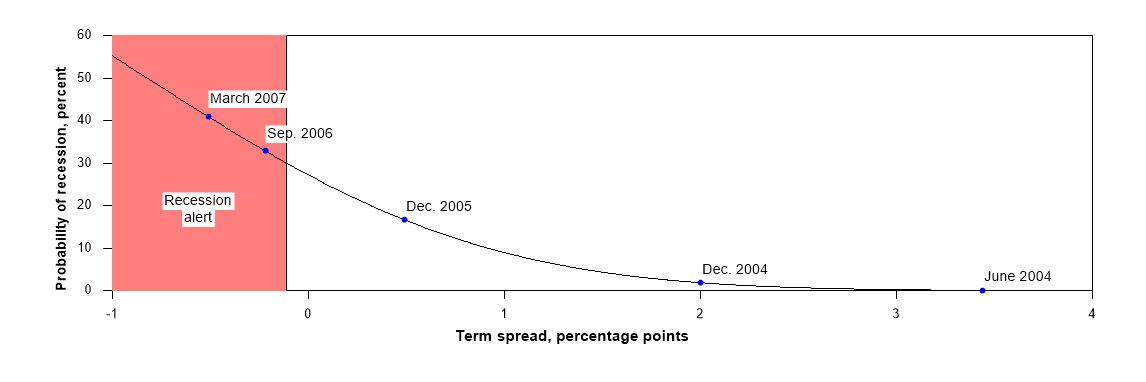
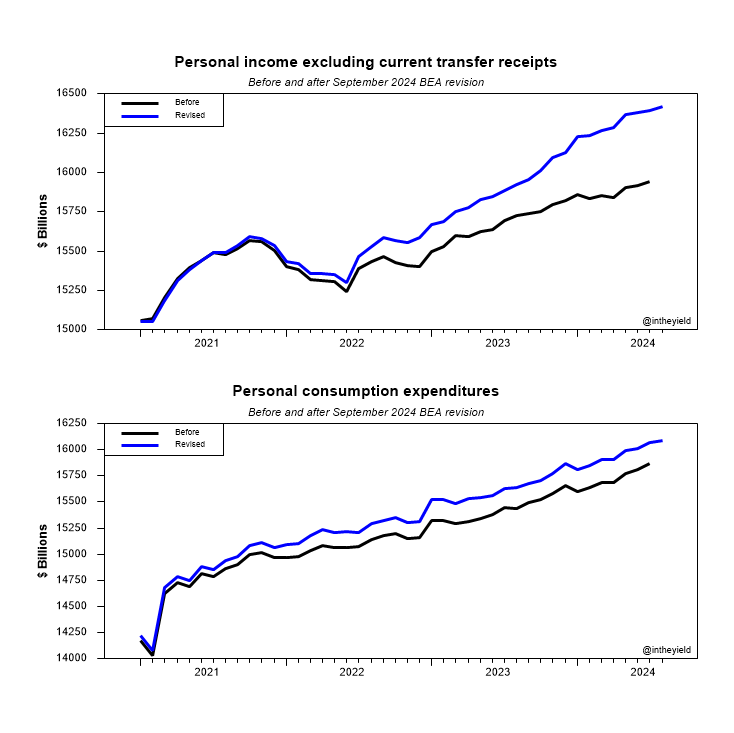
When did it become clear that the 2022 Fed tightening was unlikely to lead to a recession? Chances of recession tumbled on 9/27/2024 when the BEA revised some of the NBER 6 recession indicators retroactively. Rational forecasts were bound to change dramatically that day.
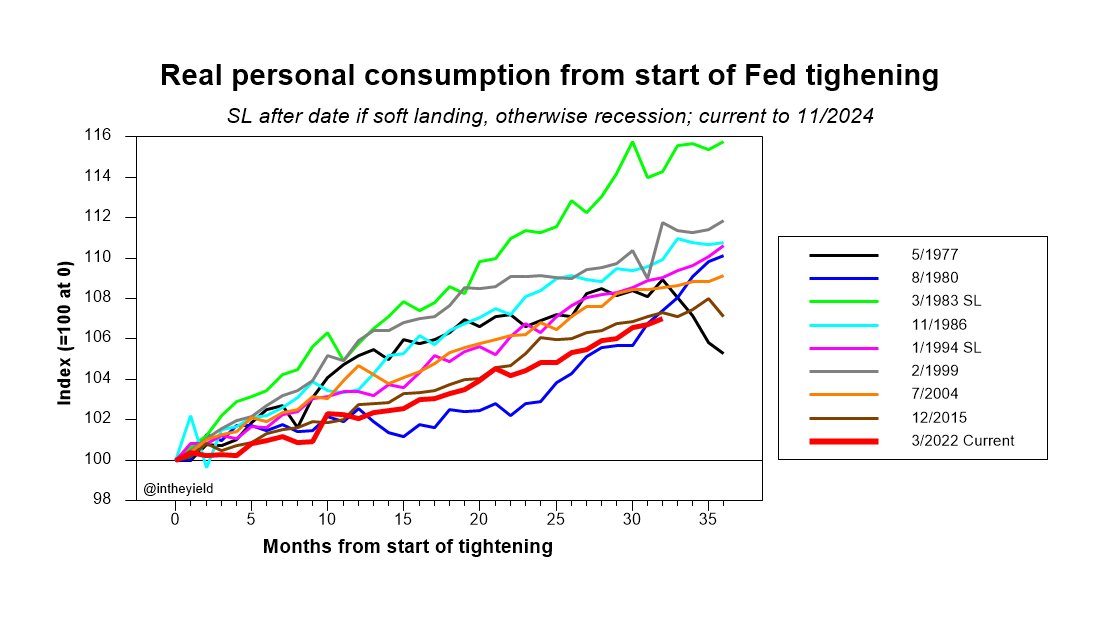
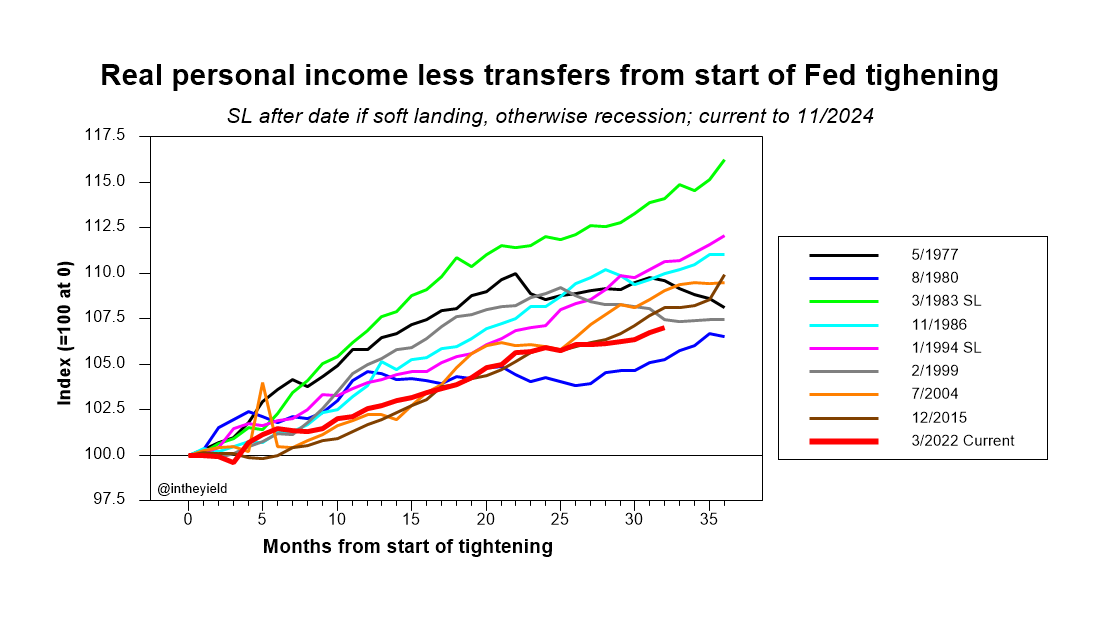
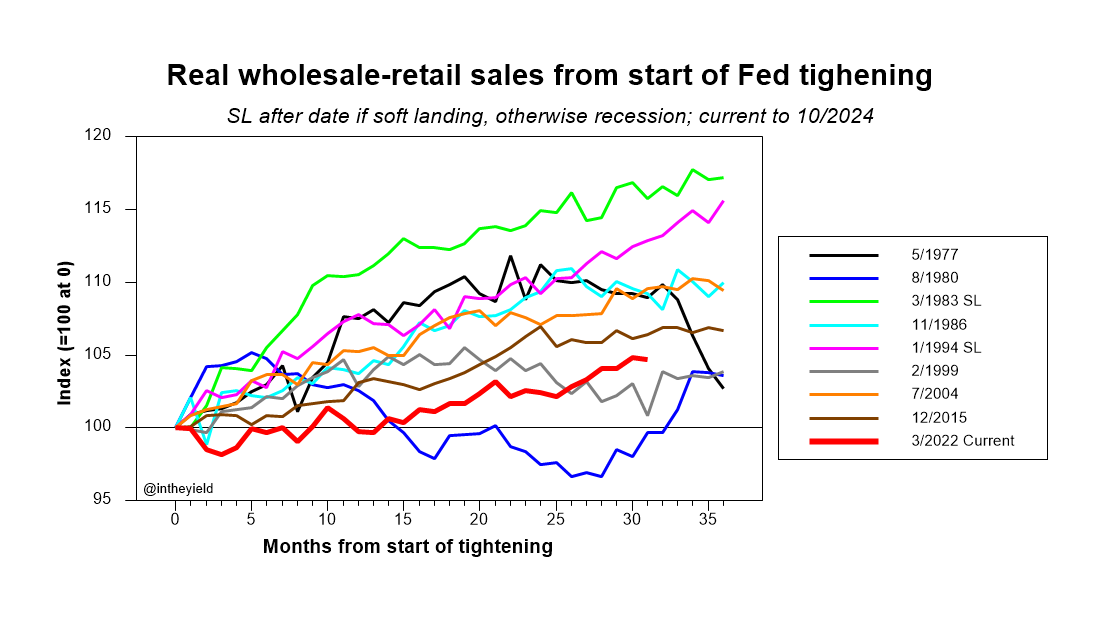
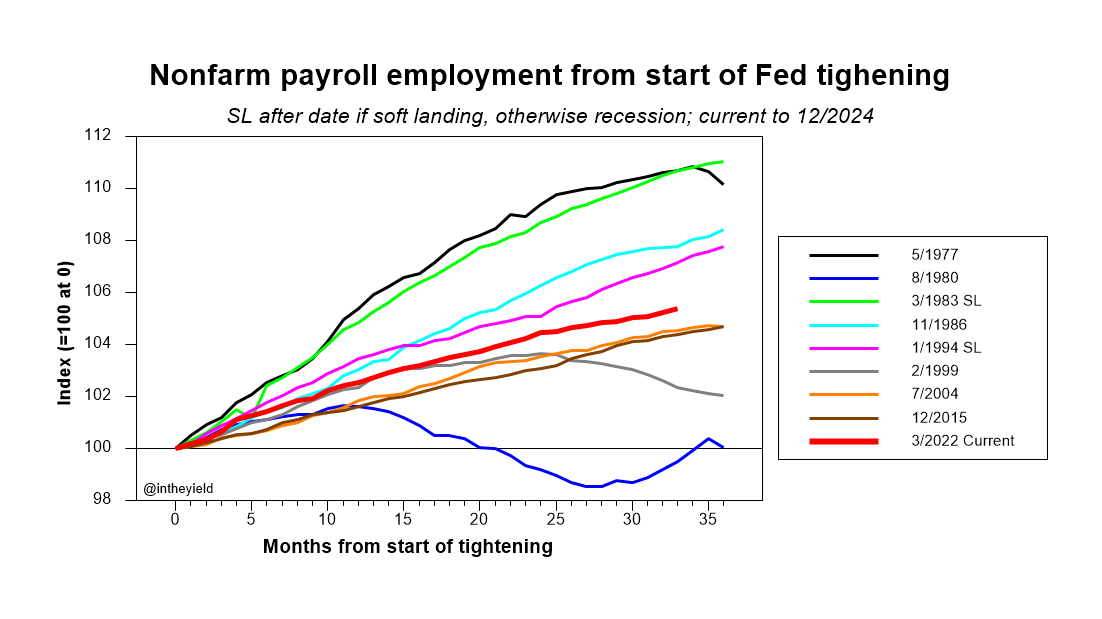
My previous 6 graphs show that Fed tightening that started Mar 2022 was followed by performance of the NBER 6 indicators that fell generally short of the prior 8 tightening episodes, 2 followed by soft landings and 6 by recession. No recession perhaps but not a model expansion.
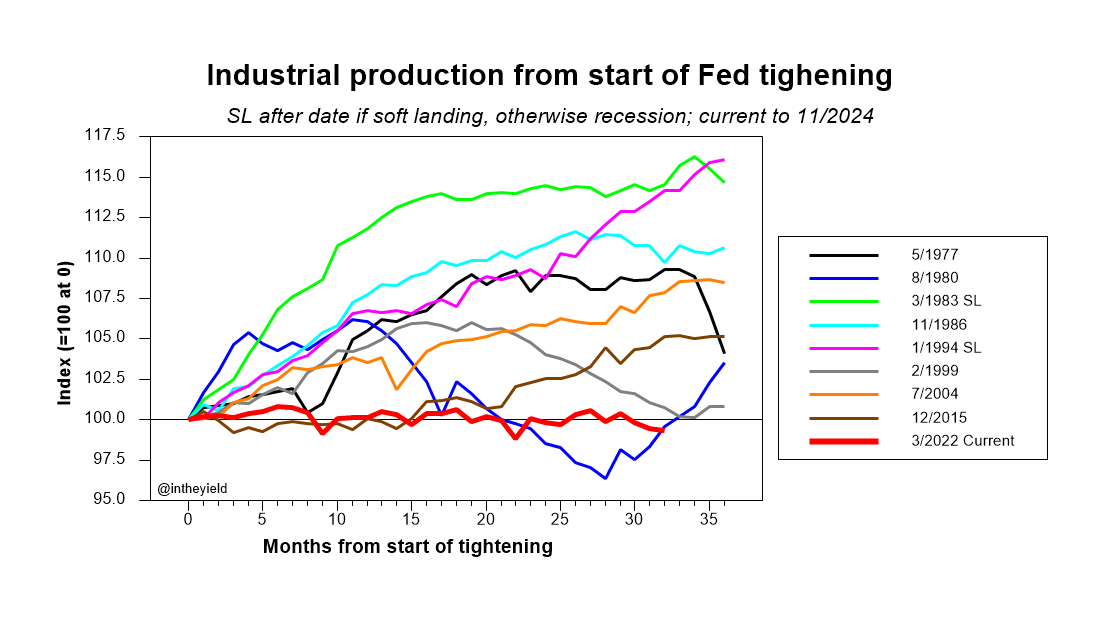
Industrial production clearly stalled from the start of Fed tightening. We all know the issues with "post hoc..." but this looks bad anyway. It's worse than in the 2 soft landings and all 6 recessions.
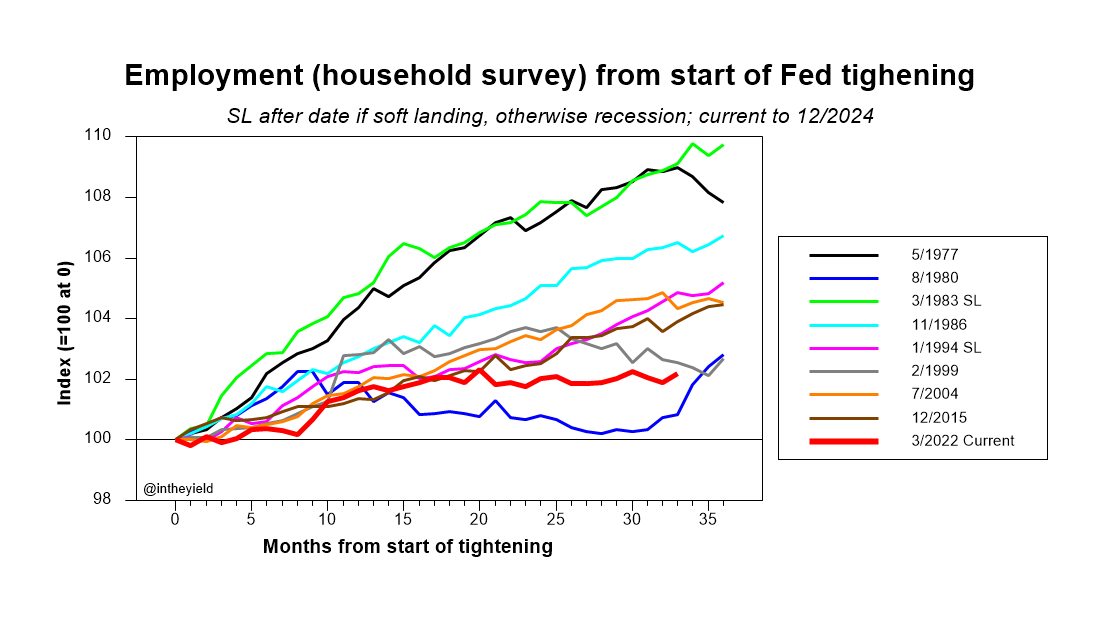
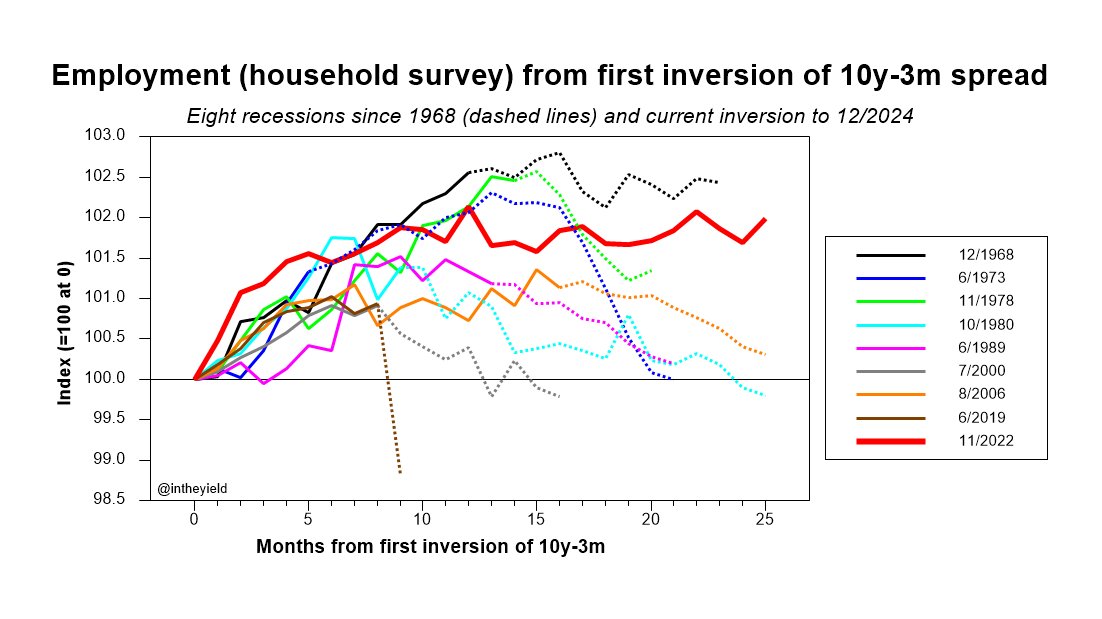
Employment from the household survey (no double counting) grew at first when Fed tightening started but then flattened out. At this point, it's worse than in the 2 soft landings and 5 of the 6 recessions in the sample.
What did the most recent Fed tightening episode accomplish? Looking at the NBER 6 indicators, industrial production was paralyzed and employment (HH) was flattened, but the others mainly grew. How does this compare to previous tightenings? Let's see 1 by 1.
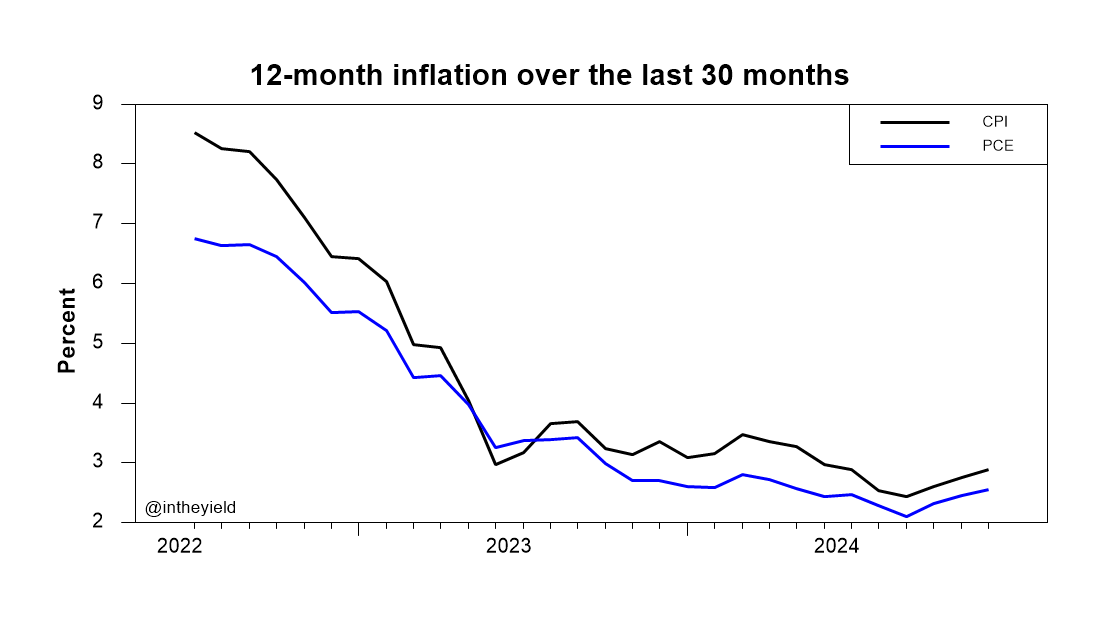
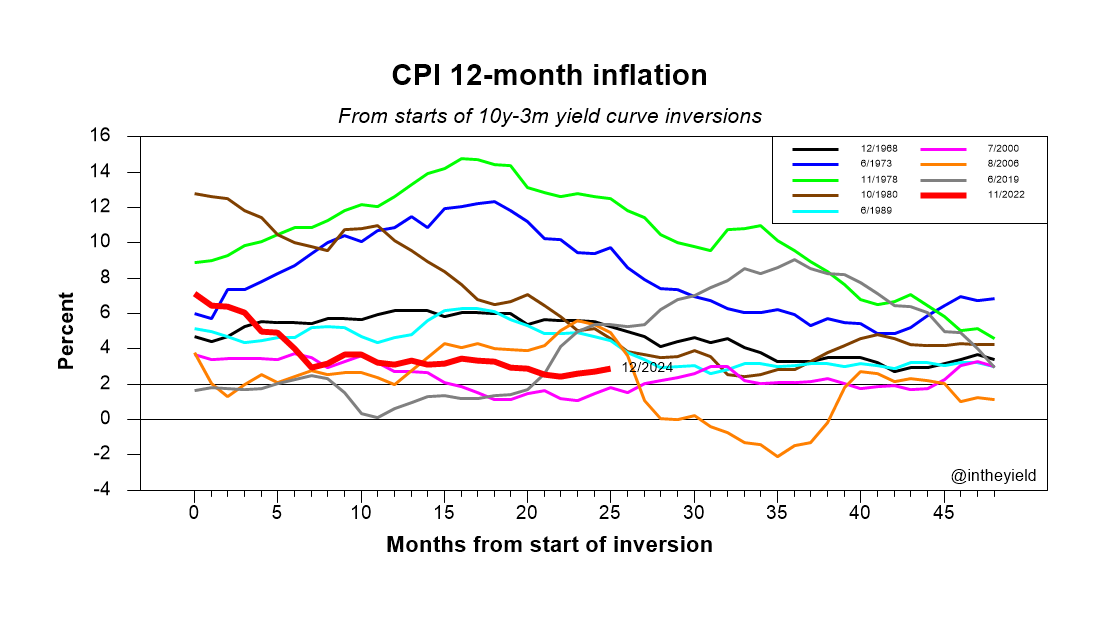
Headlines say December CPI is encouraging. Maybe because it's only going up slowly? Neutral seems like a better reading while we wait to see what's next.
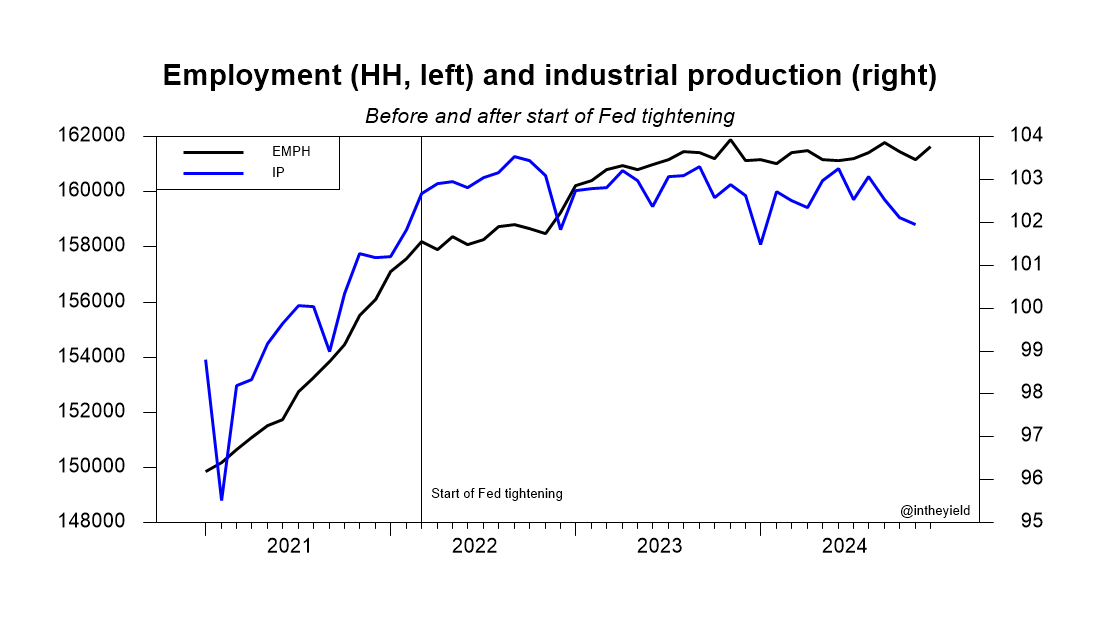
Start with 2 of the NBER 6, employment from household survey and industrial production. This may not be a recession but growth doesn't look so hot. Employment peaked in Nov 2023 and IP in Sep 2022.
The yield curve inversion did not lead to recession this time, unlike the last 8 times. Did monetary tightening have no effect? Hardly. From the start of Fed tightening, all NBER 6 indicators did worse than in soft landings, in many case worse than in recessions! Examples coming.
Employment from the household survey went up in Dec 2024 but is still below the peak from Nov 2022. In fact, this indicator never fully broke out of the recession zone after the yield curve inverted. So, jobs increased but the number of people employed failed to keep pace.
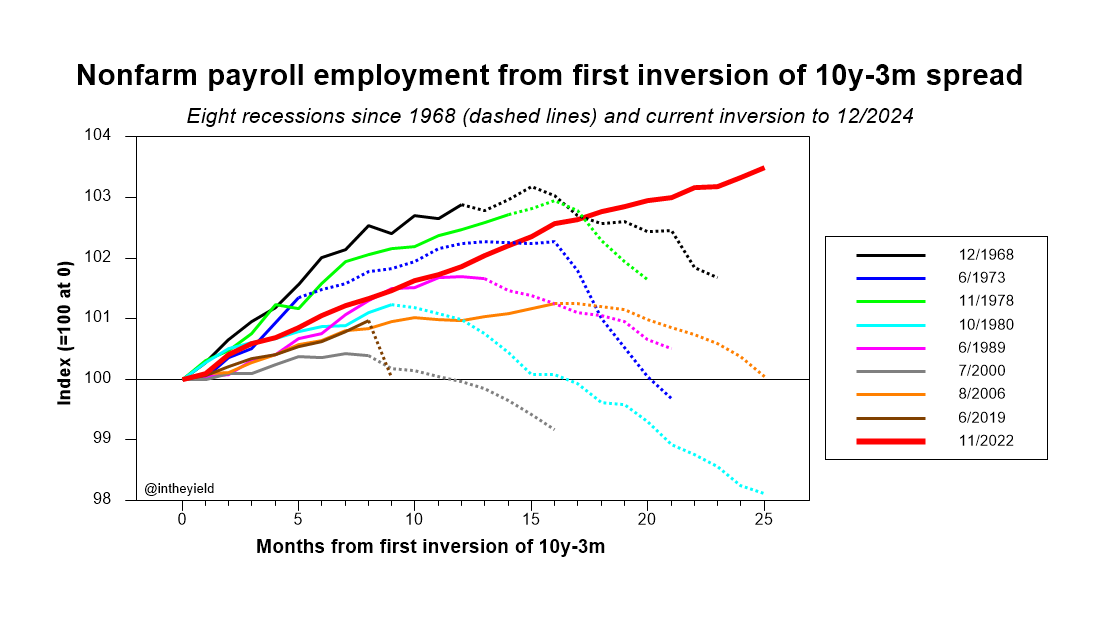
It's time to retire the recession tracking graphs based on the yield curve inversion starting Nov 2022. Dec 2024 employment numbers came out today and the establishment survey firmly suggests that the economy broke of the recession pattern a while ago. Caveat follows, though.
What happened the last time the yield curve inverted and there was no recession? We have to go back to 1966, 9 inversions ago. Industrial production was weak for about a year, compared with 2 years now. Overall, growth of the NBER 6 indicators is generally weaker this time.