Looked at 4 Euro countries, 1 Asian & 15 states for indoor dining cases. All increased. Many 2-5x or 10x in 1-2 mos. 2 had max of 20 & 25x increase. Indoor dining is NOT SAFE. Please share. This will help save lives. #coronavirus#COVID19
BREAKING: China bought +10 tonnes of gold in May, the largest monthly addition since January 2025.
This follows +8 tonnes acquired in April, marking their 3rd consecutive monthly net purchase.
China has now bought gold for 19 consecutive months, the longest streak since at least 2015, when its central bank began publishing more regular data on its gold reserves.
This brings China's official gold reserves to a record 2,331 tonnes, worth over 9% of their total FX reserves.
The country is also the 3rd-largest central bank buyer year-to-date, after Poland and Uzbekistan, with a total of +27 tonnes added.
China’s demand for gold is accelerating.
"Fed speak has become more hawkish recently, especially in the minutes. Markets are now pencilling in one Fed hike as early as Q1 next year."
@Daniel_VonAhlen@TS_Lombard
As Home Sellers Grapple with Reality, Listing Prices Fall by Most in at Least a Decade.
But each market dances to a different drummer, and declines have been far bigger in many markets
https://t.co/INkN8bnuGs
Today was one of those sessions where every single asset class got hit simultaneously and that combination tells you something specific about what just happened.
The trigger was the May jobs report.
The US economy added 172,000 jobs in May, coming in well above the forecasts that ranged from 80,000 to 105,000.
On the surface that sounds like good news but in this market, it was the worst possible number.
The Federal Reserve has been on hold for months, with markets hoping for rate cuts.
A strong jobs report especially alongside PCE inflation running at 3.8% annually tells the Fed that the economy is not cooling fast enough to justify cuts.
Instead, traders immediately repriced the probability of a rate hike in December from 26% to 43%.
That one shift in rate expectations rippled through every asset class at once.
Stocks sold off because higher rates mean higher borrowing costs for companies and more competition from bonds for investor capital.
The S&P 500 dropped 1.65%, wiping out $1.14 trillion in market value, Nasdaq dropped 2.60%, losing $1.11 trillion, with semiconductor and AI stocks leading the decline after Broadcom left its full year AI chip targets unchanged the day before.
Gold dropped 3.38%, wiping out $1 trillion.
This seems counterintuitive until you understand that higher interest rates make non-yielding assets like gold less attractive, cash and bonds start paying more, so gold loses its relative appeal.
Silver dropped 6.9%, losing $280 billion, and was already under pressure from a separate wave of Chinese investor selling earlier in the week.
Bitcoin dropped 6.31%, wiping out $80 billion, crypto has been trading as a risk-on asset in this cycle, meaning when fear spikes and rates rise, Bitcoin sells off alongside tech stocks rather than acting as a safe haven.
The fact that everything dropped together stocks, gold, silver, and Bitcoin is the key signal here.
This is not a story about any one sector being overvalued or any company reporting bad results.
This is a macro repricing event, where a single piece of economic data forced the entire market to recalibrate its assumptions about where interest rates are going.
When rates rise, the discount rate investors apply to future earnings goes up, which mechanically compresses valuations on every asset that is priced on future cash flows which is effectively everything.
The important context is that this does not change the underlying AI investment thesis, the $7.6 trillion capex buildout, or the fundamental demand for the companies we have been discussing this week.
What it does mean is that the market is entering a more volatile phase where inflation and Fed policy become as important as earnings and revenue growth.
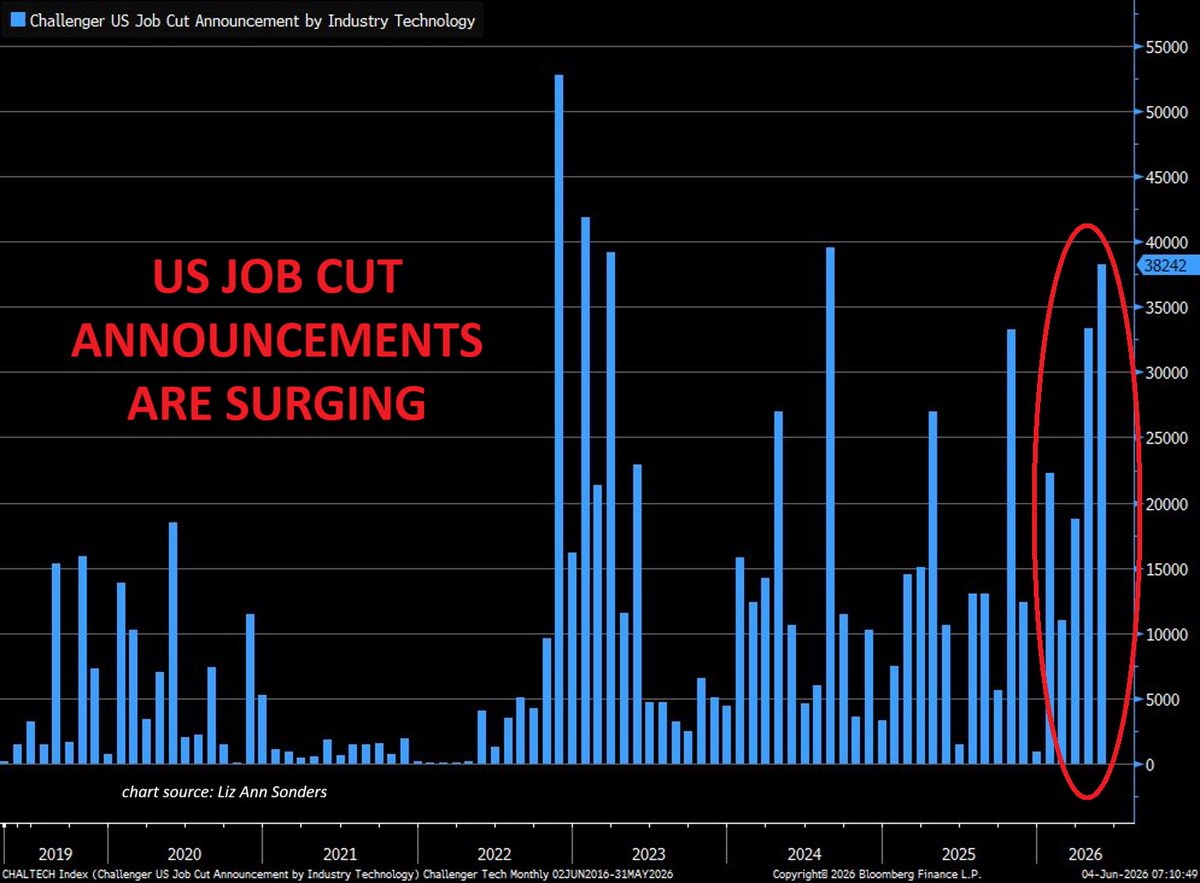
🚨The US technology sector is cutting jobs at an accelerating pace:
Technology sector employers announced 38,242 job cuts in May, the
highest monthly total since August 2024, according to Challenger, Gray and Christmas data.
Year-to-date, the technology sector has announced 123,653 job cuts in 2026, up +66% YoY from 74,716 over the same period in 2025.
The technology sector remains the largest source of job cuts in 2026 by a wide margin, accounting for the largest proportion of all US layoff announcements this year.
On one hand, many tech companies cite AI automation as a driver, with roles in customer support, coding, and data analysis increasingly replaced by AI tools.
On the other hand, much of this wave reflects a correction from aggressive over-hiring during the 2020 to 2022 pandemic boom rather than a structural AI shift.
What is the real reason for tech firms cutting jobs?
The S&P 500 fell 2.6% today, its biggest one-day decline since last October. Downside volatility is the price of admission for investors. Embrace this risk - for without it, there would be no reward. $SPY
⚠️The BofA Bull & Bear indicator is flashing its most extreme SELL SIGNAL in months:
The indicator rose to 8.5 this week, up +0.5 points from 8.0, pushing further into sell signal territory.
TAP IMAGE TO SEE FULL INSIGHT👇
https://t.co/0VGXqg3FUS
🚨 WARNING: AI BUBBLE IS ABOUT TO BURST
Microsoft gave OpenAI $13 BILLION.
OpenAI sent it back through Azure.
Microsoft booked it as revenue.
Amazon and Google are running similar loops with Anthropic while marking up huge paper gains from AI valuations.
OpenAI is spending over $60 BILLION a year on compute while generating only $25 BILLION in revenue.
Ray Dalio has warned that late stage bubbles are driven by fake flows, not real economics.
That is exactly what this is starting to look like.
For the 3rd month in row, AI was the #1 reason for job cuts in the US.
88k job cuts were attributed to AI so far this year, a 60% increase over the AI-driven job cuts in all of 2025.
https://t.co/notk7mWk7Z
NO, WAIT, THAT'S ACTUALLY INTERESTING
You know how you think to yourself, "that's way more expensive than it *USED* to be"?
Instead of looking at the usual ONE year inflation, I wanted to know how much more expensive things are vs TEN years ago.
➡ The current 10y inflation is the highest it's been since early 1998, but even that was on the way down, so it felt like relief then.
➡ It's the highest it's been ON THE WAY UP (meaning you feel it emotionally) since ***LATE 1972***.
➡ The big news at the time was America trying to end an unpopular war and a looming oil crisis; and of course, you see what happened next.
BREAKING: The S&P 500 closes at its highest level on record, now on track for a 10-week win streak for the first time since 1985.
That's +$11.7 TRILLION in market cap since March 30th.
The US manufacturing sector recovery is accelerating:
Chicago’s PMI Manufacturing Index jumped +13.5 points in May, to 62.7, the highest since March 2022.
This marks the largest monthly increase since the 2020 pandemic recovery and the 2nd-largest since this index's inception in February 1967.
This index has now been in expansion territory, above 50 points, in 4 out of the last 5 months.
New orders jumped to their highest level since January 2022, alongside a recovery in order backlogs and supplier deliveries.
Meanwhile, prices paid surged to their highest level since May 2022, led by rising oil prices and transport fuel surcharges.
US manufacturing activity is gaining momentum.
How is this different than the GFC
We have a larger housing bubble
Larger stock market bubble
Worse demographics
More debt
We already went to 0% rates
What this means, any TARP like response won't have the same impact as it did during the GFC likely reinflating inflation causing even higher rates over the long term.
The ponzi age is over for this 80+ year cycle.