Two satellite images of San Sebastián. Almost a decade apart.
New buildings. New infrastructure. Shifted land use. All visible from space, all comparable over time.
Cities change fast. Satellite data keeps up. 🛰️
De la final de ayer podemos sacar muchas conclusiones xo las +obvia es que algunos jugadores argentinos no saben perder y se comportaron como el culo. Espero que haya un buena sanción xa Paredes, Otamendi, Nahuel y compañía. De lo +rastrero que he visto sobre un campo de fútbol.
A satellite image shows what is there. A Land Use / Land Cover (LULC) map shows what it means.
LULC turns imagery into structured geospatial data by classifying each pixel into land categories like residential, vegetation, water or roads, enabling GIS analysis.
5 satellite images. 2 acquisitions. 7 days apart. One seamless mosaic over coastal Galicia.
Orthorectification ensures every pixel aligns perfectly before the strips are joined.
This is how large-area coverage works from space.
Ground truth without groundwork.
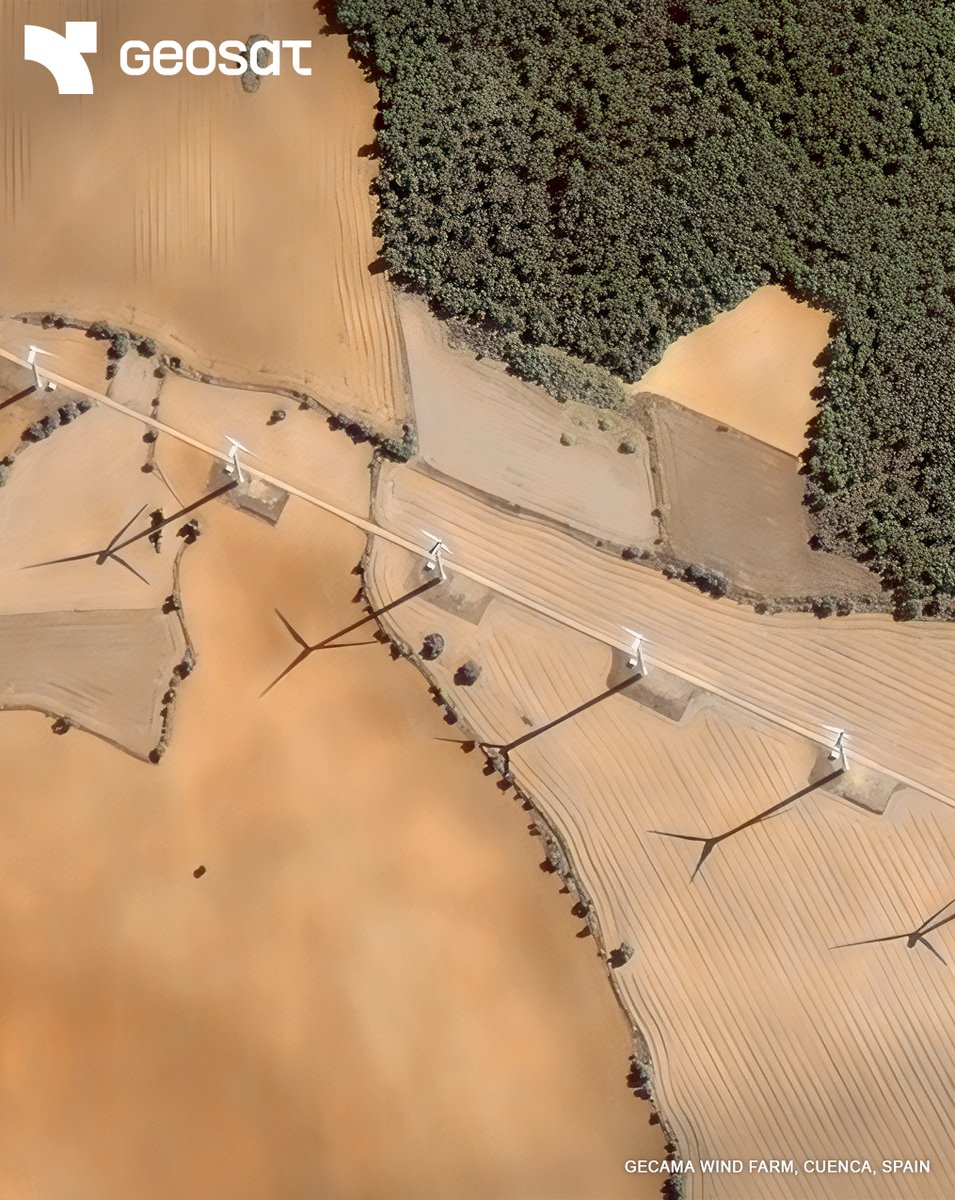
At sub-metric resolution, every turbine, access road, and terrain detail is visible from orbit.
Track construction, spot deviations, and verify what’s actually on the ground. 🛰️
Before & after: the Doñana wildfire burn scar, captured in false-color satellite imagery.
Near real-time monitoring and change detection help deliver rapid situational awareness for emergency response and disaster assessment.
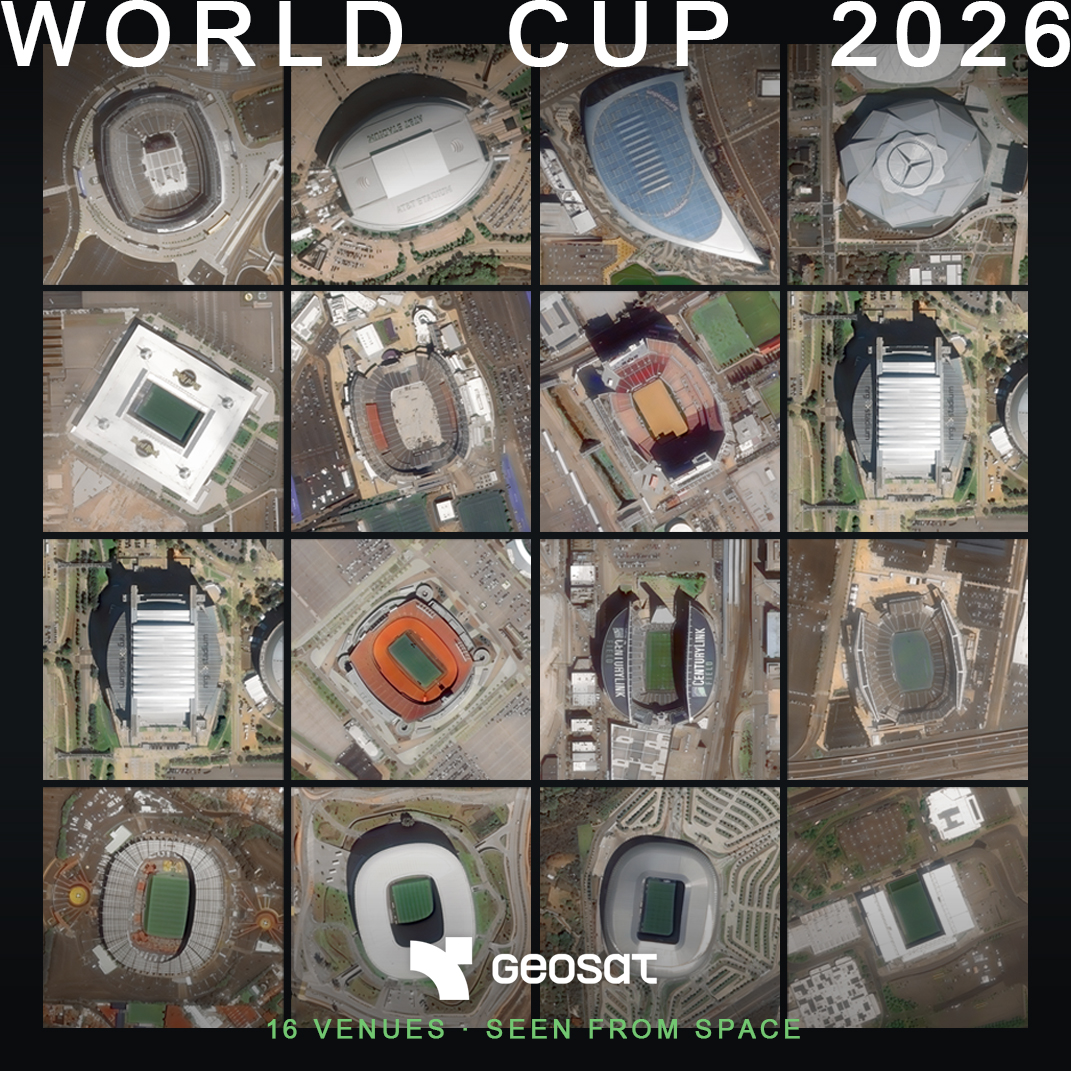
The 16 World Cup stadiums seen from space at Very High Resolution. 🛰️
🏆 48 Teams.
⚽ 104 Matches.
🌎 3 Countries.
Every stadium, captured by satellite.
https://t.co/lSHR7TXfEJ
@FIFAcom