@kenklippenstein The Tim Walz fall off should be studied. He went from carrying the D ticket on his populist policies in 2024 to capitulating to a fascist regime in less than 18 months
@Bickey_kr Get the Github desktop app. If you are using an IDE like Visual Studios Code, then you can link it to your github desktop app gui. Then making commits are only a few clicks. Good luck!
Regardless, it is extremely fulfilling to reflect on the fact that only a few months ago i was writing code to print "Hello World" and now i am programming Machine Learning for real world applications.
And doing it all while deployed is just cherry on top
#python3#DataScience
Day 101 of #100DaysOfCode
Practicing new ML techniques i have learned.
Yeah i never posted on my 100th day. Looking back on my journey, the 100th day became less and less important to me. I wasnt going to stop at 100 so whats the point?
Day 96 of #100DaysOfCode
Implemented single feature Linear Regression models and multiple Linear Regression models.
I might be able to make this work with my Veteran Employment Outcomes project. Now that would be cool.
*checks twitter to see when my last update was*
Okay its time. Day 93 of #100DaysOfCode
Learned a lot of stats for data science mostly. Yesterday i learned about LinearRegression, how it works, and how to implement it using scikit-learn.
Also side projects on #Python 🐍
Day 87 of #100DaysOfCode
Learning more statistics and hypthesis testing for Data Science and how to implement them in Python.
Also more Army veteran career outcome data analysis for my project.
#DataScience#Python
Day 85 of #100DaysOfCode
I started the machine learning course! Excited to keep the Data Sciencr process going.
Started with Linear Algebra and Diffy Eq fundamentals. Havent seen this stuff since college so its a good refresher. Love learning how to do it all with #Python
@blarson424 Do you mind elaborating on what you mean by "captivating"?
Is it by using an eye catching data visual or slide deck? Or is it elegantly explaining the "so what" of the data that you are presenting?
Day 81 out of #100DaysOfCode
Finished my first data science portfolio project! It is a project on the biodiversity in US National Parks. It was a ton of fun! Got raw data, in multiple files, cleaned it up, did some analysis and made a presentation for the analysis. #DataScience
Day 77 out of #100DaysOfCode
Learned how to handle missing data based on different types of "missingness" (MCAR, MAR, MNAR).
Worked on my Veteran employment data analysis. Made some new visuals that help tell even more of the story of soldiers post-ETS outcomes.
#DataScience
Day 76 of #100DaysOfCode
Learned Regex and how to implement that into my data cleaning processes. Mainly splitting variables and removing non-integer characters in order to aid in data visualization.
I like to think I have a good personal and professional relationship with my soldiers. Today they said, "Sir, you are so predictable. All you do is work, go to the gym, and do your programming thing." I was not even insulted because they were right. 😅
It has been... 8 days! Since my last #100DaysOfCode post. I am pretty sure this will be day 75 of 100? Im bad at Twitter.
Nonetheless, I have been coding everyday. I have 2 projects in the works. GDP/life expectancy data viz and the Army retirment outcomes analysis.
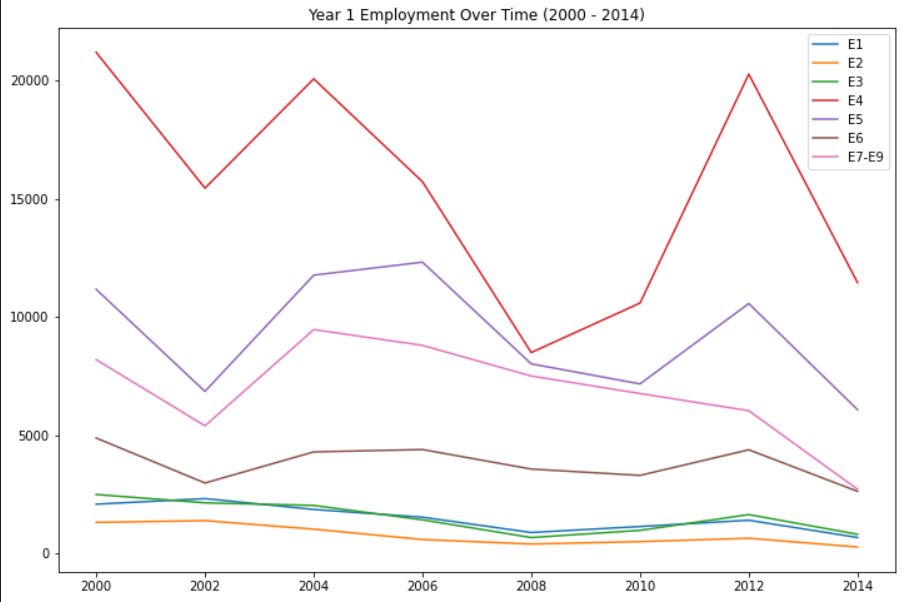
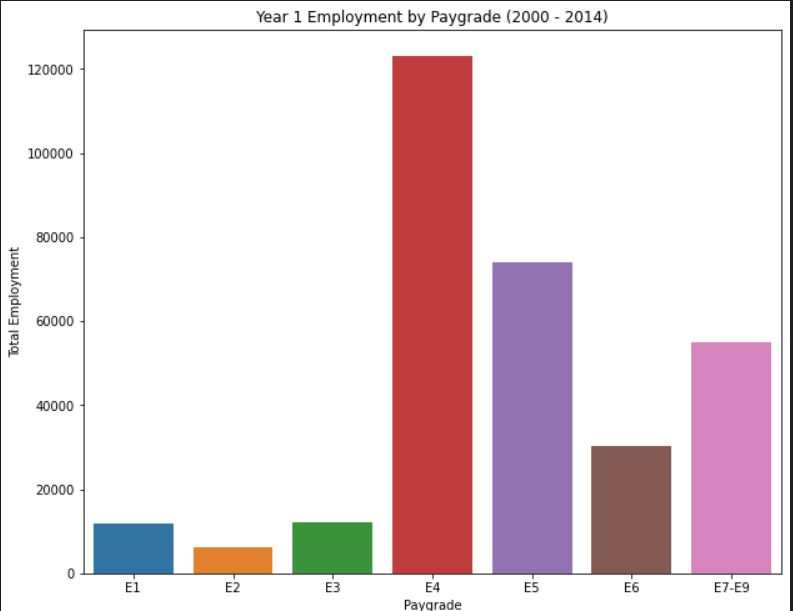
It feels great to share this! My first data visualization on my own. It isn't great and still needs work but it still feels great. This is from a data set that tracks veteran employment after leaving the Army. I need feedback! Criticism makes me better!
#DataScience
@blarson424 Yeah i think right now I am just doing the data visualization so that i can get the story. Tbh, that is what interests me most about data science. I am still learning the field so maybe later i will do a full analysis with this data set.