$BTC Just found something crazy 🚨
This is one of the craziest charts out there
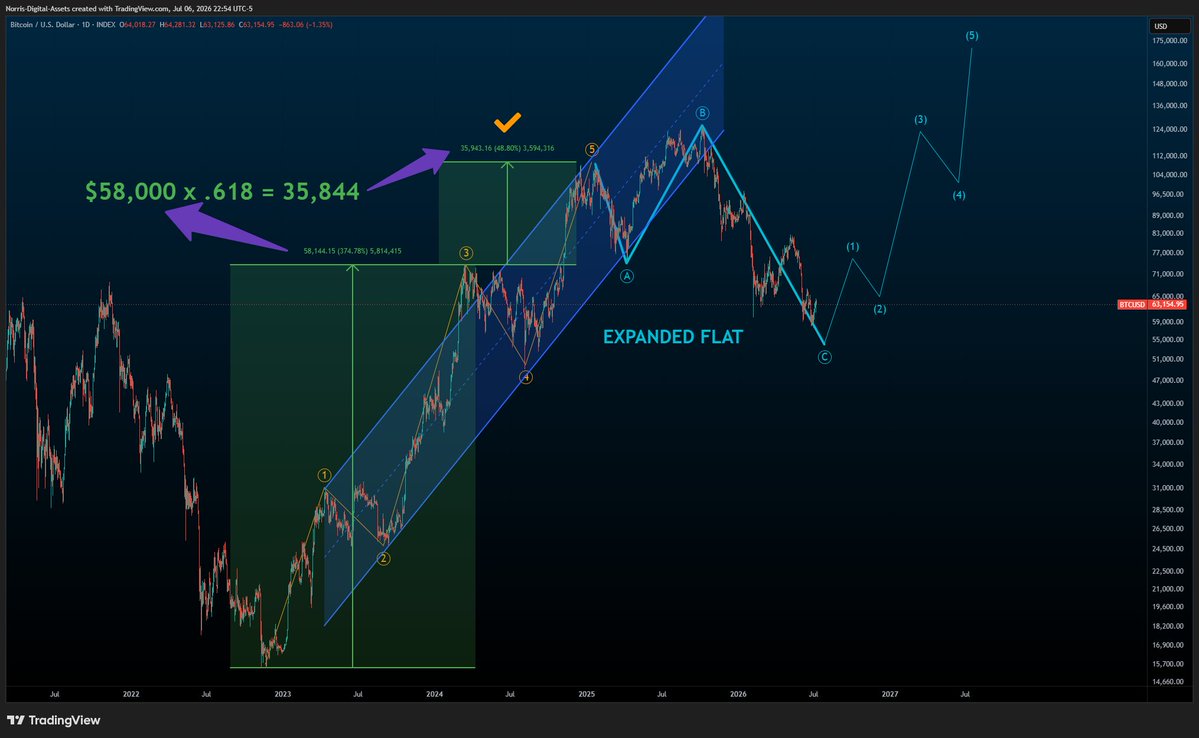
Both of these charts are an exact match for Elliott Fibonacci
The wave 1 through 3 rise, provides the basis for measuring the distance to the orthodox top. The formula is first 3 waves X .618, then add that number to the top of 3, to find wave 5 peak
(See the green, follow the purple arrows)
Both of these charts: 5 wave moves were around ~800 days
The London Gold Bullion chart from 1974 has the exact same Fibonacci ratio formula pointing to its wave 5 peak within $1
They are nearly IDENTICAL moves
🚨 The Move We've Been Waiting For Is Here! 🚨
The market is dropping hard, exactly the type of move we've been preparing for, and ripple:native is approaching the major support levels we've been tracking! 😍
Key levels below:
$1.00
$0.93 where my buy is
$0.87 (primary target/macro .854)
This is THE MOST critical moment in the market cycle!
📉Correction is approaching its final level. The fear will be LOUD! People will likely start calling for lower and lower prices as the level is reached. They'll tell you the market is going to zero. But don't let someone else's fear cause you to miss your own opportunity.
Every major trend begins when sentiment is at its worst. The correction is doing exactly what it should. This is perfect market structure.
Stay focused. We're SO close!
#Xrppriceprediction #xrpholders #CryptoMarkets
🎯 The Level We've Waited Months For!🎯
XRP reached the major .786 macro support at $1.09 (Coinbase) perfectly. You can see how well the daily timeframe is respecting it so far!
Now, we're focused on the reaction.
📈The key resistance levels I'm watching are:
-$1.19
-$1.27
Both levels are valid and keep the larger correction alive, which would leave the possibility for a deeper low toward the $0.90 support zone (0.854).
On the other hand, if XRP starts showing real strength and pushes through resistance, we'd have to consider that the market may be building a new trend rather than preparing for another wave lower.
This is one of the most important moments of the entire correction!
The support has been reached.
Now we watch the reaction.
#XRPCommunity #XRPAnalysis
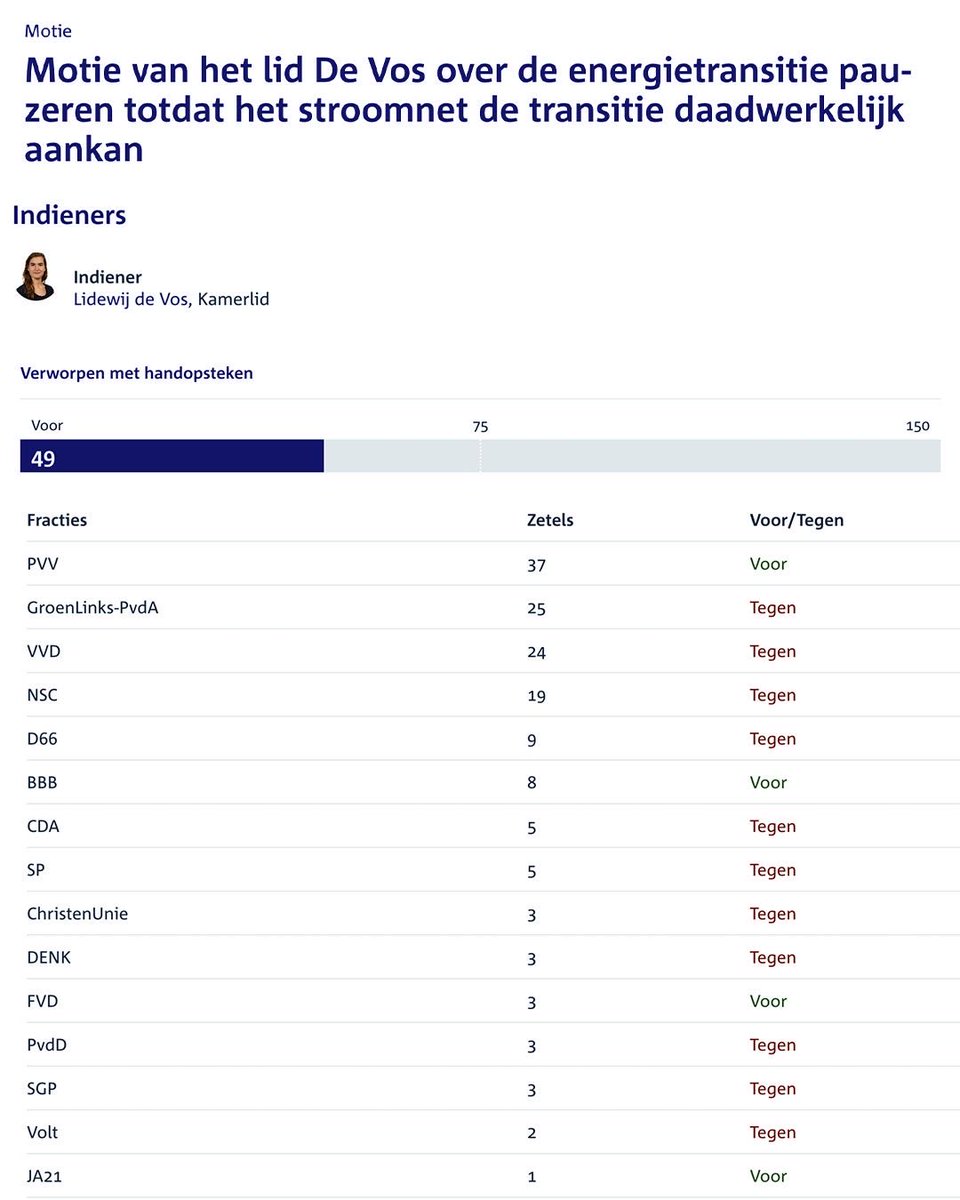
De energietransitie maakt ons stroomnet instabiel. Nederlanders krijgen hierdoor te maken met piektarieven en andere 'prikkels' om hun leefpatronen aan te passen.
FVD wil deze groene manie stoppen. Zelfs mijn voorstel om tenminste te stoppen totdat het net het aankan, werd verworpen.
I posted this earlier in the week on @RealVision, but thought it was worth sharing here as well, just to give everyone something to think about.
If you step back and look at the data, something interesting is happening in markets right now…
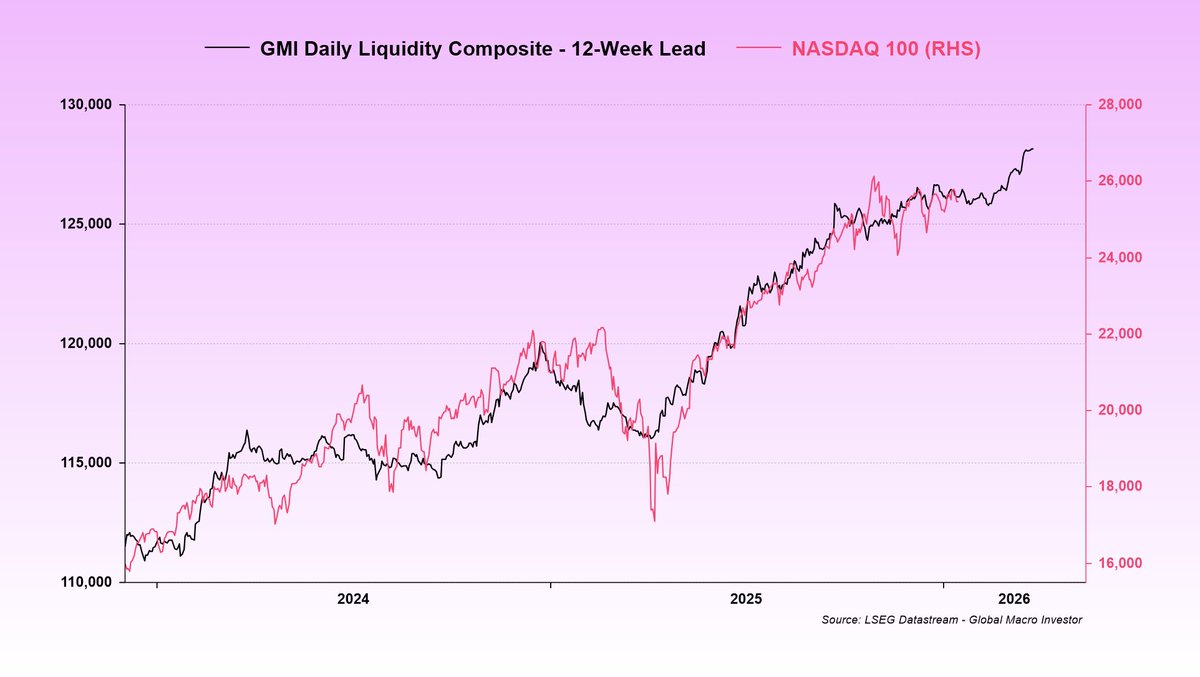
When you line up liquidity with equities, you get this (chart 1).
And then compare that with the same liquidity measure versus Bitcoin (chart 2), a simple truth emerges:
Both cannot be right...
Either equities are fundamentally mispricing liquidity despite trading near record highs, or Bitcoin is correctly signaling that the liquidity cycle has already peaked and that risk assets are about to roll over. Only one of these outcomes can ultimately be correct.
Now let’s separate data from opinion for a moment...
The data is clear:
Global liquidity has not yet peaked.
Now to my subjective view…
I think Bitcoin remains the outlier here, and that the events around 10/10 temporarily distorted price discovery, for reasons I’ve discussed at length previously.
Equities, credit, and broader risk assets are behaving exactly as you would expect in a rising liquidity regime. They’re hovering near all-time highs...
Bitcoin, by contrast, is pricing a liquidity peak that the data simply does not support at this stage.
At some point you have to step back and ask:
Is it more likely that one asset is right, or that every other BTC-correlated risk asset is wrong (chart 3)?
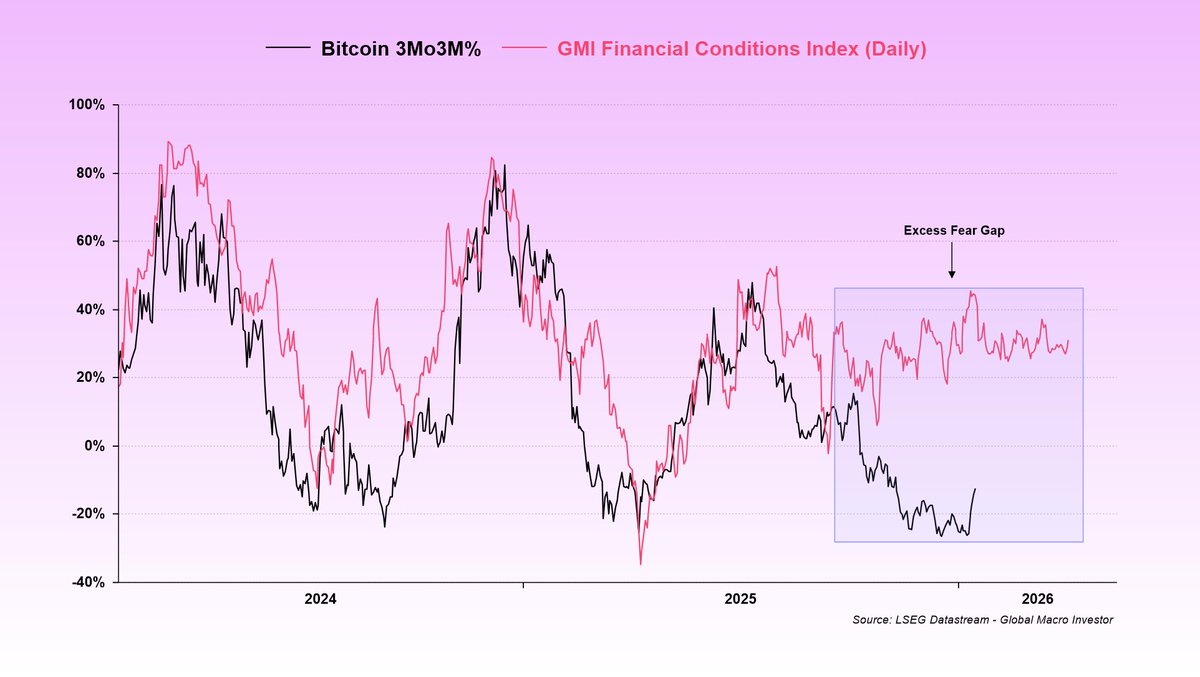
If you then layer in broader financial conditions, it stops being about opinion and becomes more about probabilities (chart 4).
What really stands out to me is the sheer magnitude of the “Excess Fear Gaps” that have opened up relative to the macro and liquidity fundamentals.
Right now, the weight of the evidence suggests liquidity is still rising and, in our view, will continue to rise, and that is what risk assets are reflecting.
That means Bitcoin is the anomaly.
What I’ve done here is present the data objectively and my view subjectively.
This is the battlefield for 2026.
The bull versus bear debate comes down to one thing and one thing only:
The direction of global liquidity...
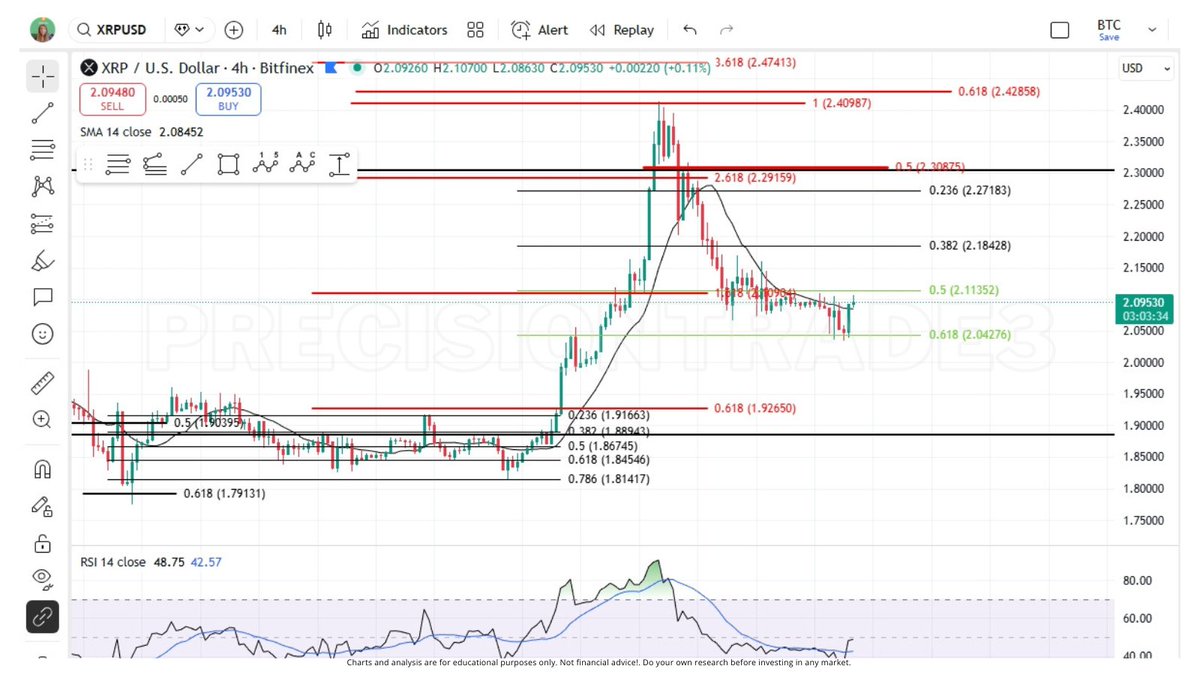
NICE bounce on #XRP right at the $2.04 level. Price is now above the MA and looks like the RSI broke up too.. It still needs to break above the $2.11 level to start to confirm the next wave. I'm targeting a double top $2.41-$2.43 next! I'll keep you updated as it develops! #Ripple #XRPHolders #XRPCommunity
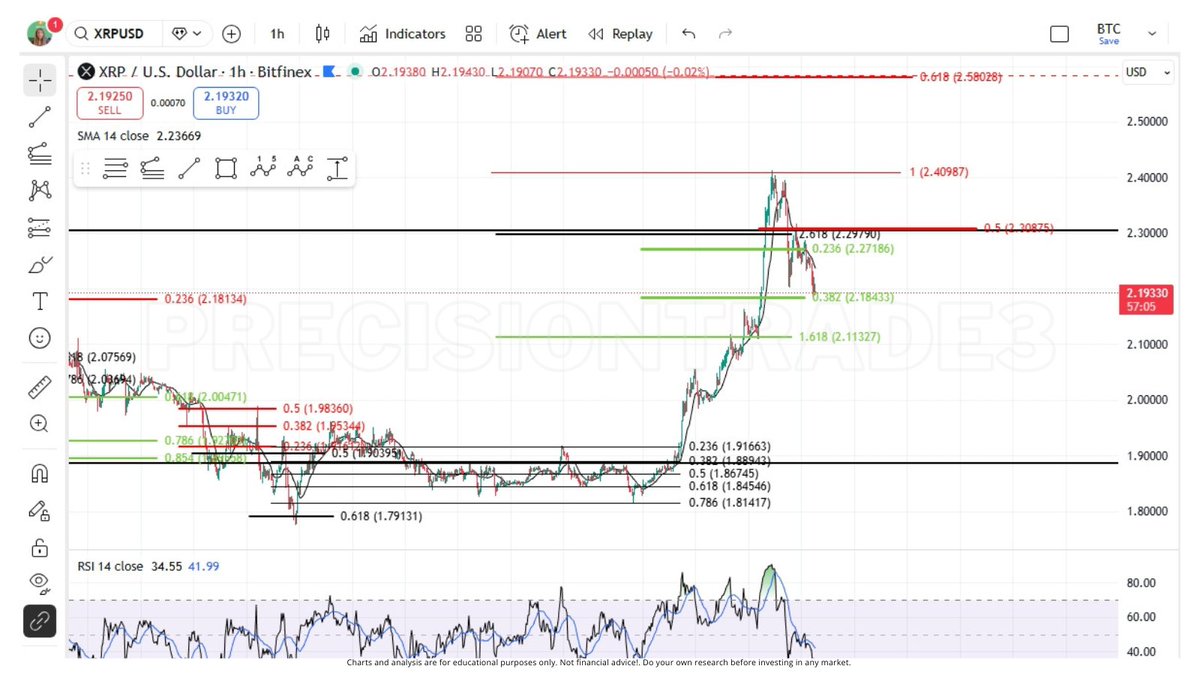
#XRP EXACTLY as expected. It pushed up for subwave B right to the $2.30 (.5) resistance and is now on the final wave of the correction RIGHT at the textbook .382 support at $2.18. #XRP needs to hangout here while #BTC finishes up- almost done with this short-term correction.
The subwave 5 top is now measuring $2.58 with this correction low. We had a range at $2.49-$2.66 before the correction was finished and that is now the updated target. This will complete 5 full waves and the first wave of the new trend! #Ripple #XRPFamily #XRPArmy
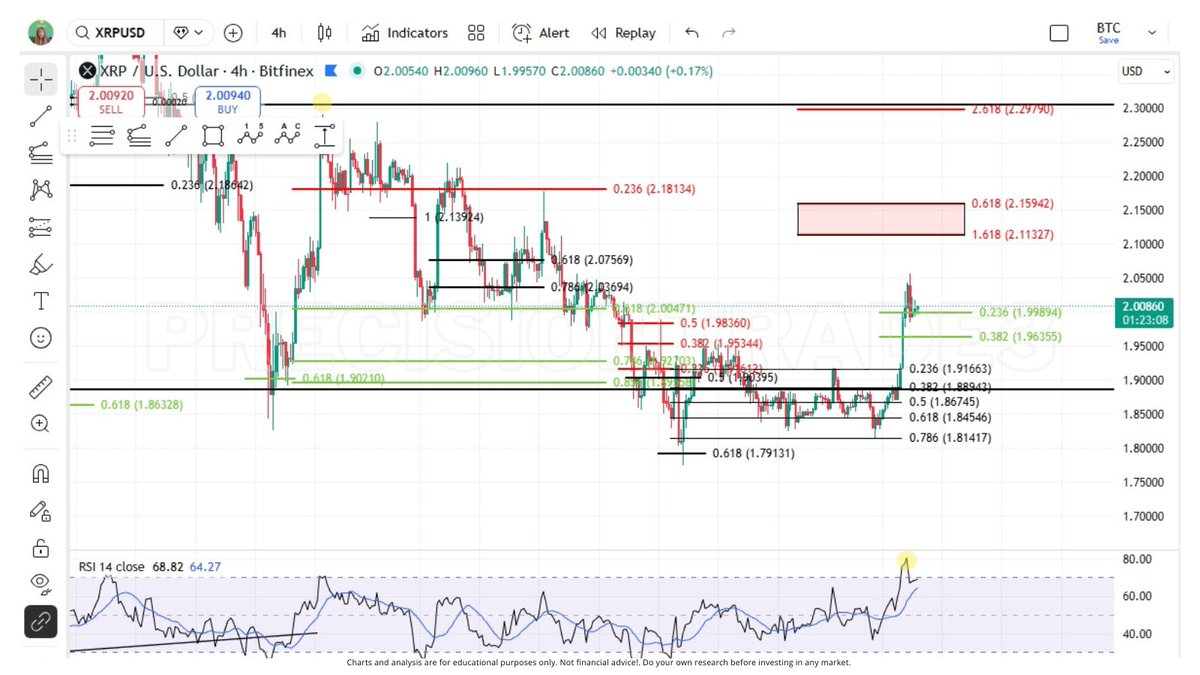
#XRP is beginning to look a lot like a new trend 👀
The RSI is continuing to print bullish and is not signaling a top yet! I marked local supports in green which looks like the $2 level has now flipped to support. Holding these levels means that $2.11-$2.15 is next.
#BTC has also held the major $90k support level-this should help #XRP hold and push to higher targets. Mid-term, still expecting $103k resistance on #Bitcoin which should line up with #XRP reaching its resistance at $2.30. I'll keep you updated as it continues! #Ripple #XRPHolders #XRPCommunity
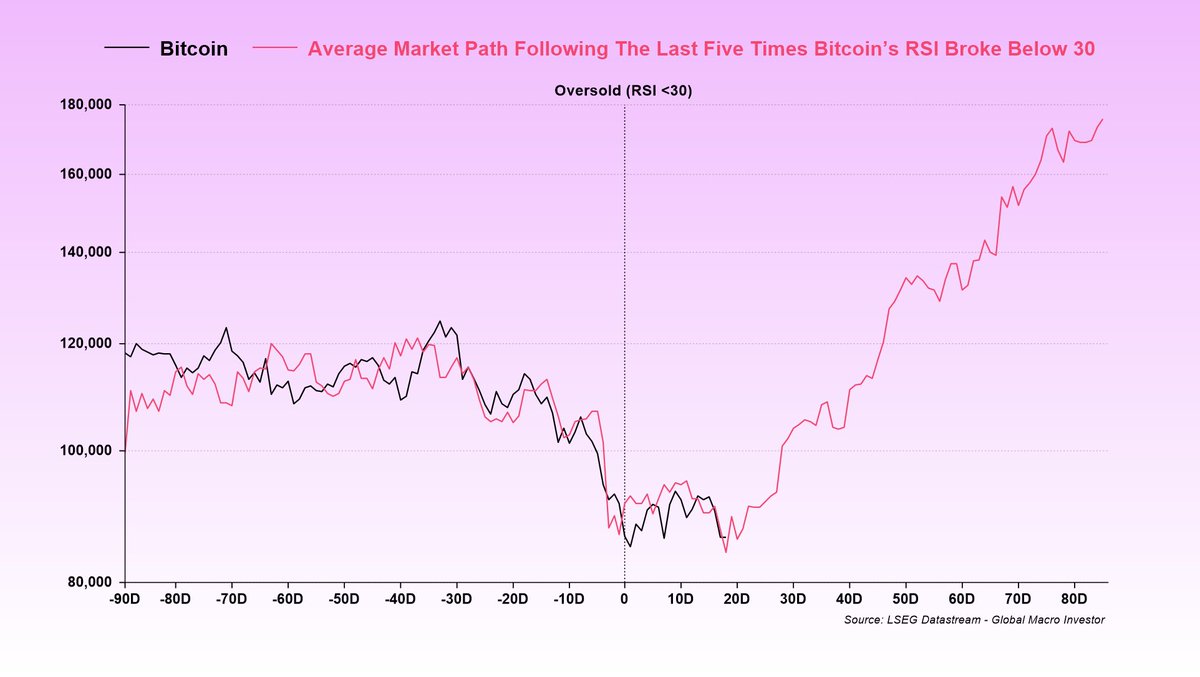
A lot of people have been asking for an update on this chart, so I’ll just leave this here for anyone who needs to see it.
This shows the average BTC trajectory following an oversold RSI reading, with RSI falling below 30 at t=0.
So far, it’s been pretty bang on.
Unless you believe the 4-year cycle is still in play, which we don’t, this chart should hold up contextually over time.
No, it won’t be perfect, but assuming the bull market isn’t already over, it’s a useful chart to keep in mind.
As we’ve outlined many times, based on our work on the business cycle, the current path of financial conditions, and our expectations for overall liquidity, the balance of probabilities is that this cycle extends well into 2026.
In that world, the 4-year cycle is dead.
Remember, the 4-year cycle was never about the halving, despite widespread belief that it is, but instead has always been driven by the public debt refinancing cycle, as outlined in our work at GMI, which post-COVID was pushed out by one year.
In our view, the 4-year cycle is now officially broken because the weighted average maturity of the debt term structure has increased.
And the bigger picture is that there is still a vast amount of interest expense that needs to be monetized, which has far exceeded GDP growth.
Another thing to keep in mind is that bases can take time to form and usually come with plenty of chop before the bigger up-move kicks in.
Finally, let me repeat what I said when I first posted this chart last month.
If you think the bull market is over and we are now facing twelve months of pain, this chart is not for you. Move along...