Checkout my latest in-depth interview with Michael Howell, Managing Director of @crossbordercap
In this interview, Michael explains:
- Key Drivers of the Global Liquidity Cycle
- Bitcoin’s Correlation with Global Liquidity
- Bitcoin Valuation Model: P/M Ratio
Links below ↓
bitcoin:native off the volatility bands🚨
If price were to fall back to Hikaru Bands' average, it would be a 15% recovery.
Per RSI, it's currently at 2020 COVID crash levels.
Global Liquidity-wise, no big surprises! (by @JackGreenCrypto)
DYOR!
While your classic trend indicators have gone Risk-Off for bitcoin:native there are many altcoins doing their own thing,
A sign of encouragment for wider a Risk-On enviroment is the Global Liquidity RoC by @JackGreenCrypto
A great time to sharpen your systems and approach.
DYOR!
GM!
The 90-day-lagged inverted DXY indicator acts as a leading proxy. Dollar moves take time to reach risk assets. In a nutshell, what the dollar did three months ago is lined up against where $BTC trades now. BTC sitting below that line means it has underperformed what the earlier dollar setup would normally point to.
The gap between price and the midline is a representation of where BTC sits relative to the inverted dollar action. In this case, BTC looks to be priced close to -2 standard deviations away from where it should be. The chart here suggests a bearish outlook with a small possibility of price consolidating towards its implied "fair value"; even then, downward pressure still wins.
Three probable outcomes:
- Mean reversion: if the lead-lag holds, BTC is behind and closes the gap by moving up or consolidating (refers back to what I mentioned above).
- Regime break: correlation to this metric breaks and BTC breaches above it. Same way it happened with the famous M2 charts last year when the correlation flipped negative.
- Correlation remains: BTC maintains its relationship with the inverted dollar and nukes for the next month or so.
What decides it? Direction. A narrowing gap supports mean reversion. A widening one means the correlation is breaking down, and that's the riskier setup. The lag is the whole point. Without it you're plotting two correlated lines and calling it confirmation. The 90 days is what turns the second line from "these move together" into "this one moves first." It's also worth stress-testing, since that lag drifts with the macro regime.
@JackGreenCrypto's metric.
Two different macro tools are aligned with a current risk-off regime for $BTC.
The 3M and 12M annualized RoC in Global Liquidity is signaling that the current market state is not in favour of growth (pink and green plot).
The GLI (+11W) & BTC 6W Changes from @JackGreenCrypto not only agrees with the above report but also suggests a high probability chance of seeing a risk-on regime only until around early July, 2026.
Beware the Global Liquidity path ahead of us!
1. Hikaru's M2 Watch
2. bitcoin:native Price vs. Global Liquidity RoC (by @JackGreenCrypto)
Could your systems survive a possible drawdown?
DYOR
Bitcoin's sensitivity to global liquidity is not a constant. It's a regime that can be measured.
The rolling β coefficient, built out by @JackGreenCrypto measures how strongly BTC responds to a unit change in global liquidity over a trailing 52-week window. Full-sample reference: 0.0404.
When β sits above the reference line, Bitcoin is in a hyper-sensitive period where liquidity changes carry outsized weight. When β compresses below, the macro link breaks down, typically during idiosyncratic shocks like exchange failures or regulatory events.
Current read: β sitting near 0.018, well below the full-sample reference. Bitcoin is in a macro-decoupled regime.
Periods where β climbs well above 0.04 have preceded the strongest expansion phases. Sustained compression below the reference often coincides with macro-disconnected drawdowns where idiosyncratic flows dominate price action.
Liquidity is not always the driver. Knowing when it is matters more than knowing the level itself.
GM everyone, I joined BlockPhi (@JackGreenCrypto)
I hope you join us soon when the website is live, lots of great macro analysis soon.
In the meanwhile DYOR!
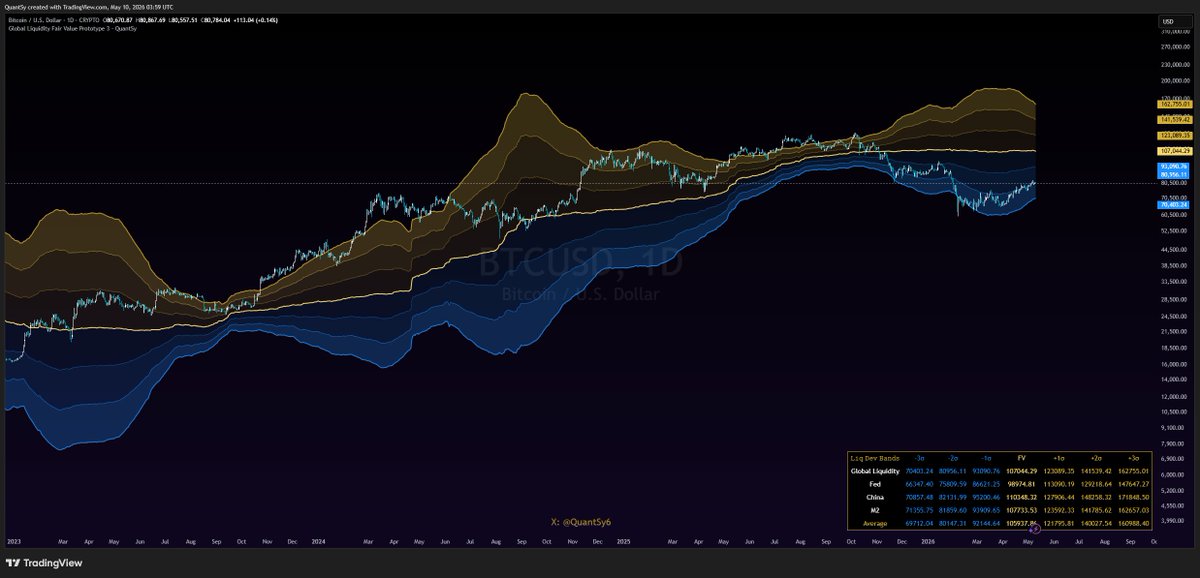
$BTC at ~$80.7K is trading below Global Liquidity Fair Value of ~$107K, placing it nearly 25% beneath where liquidity prices it.
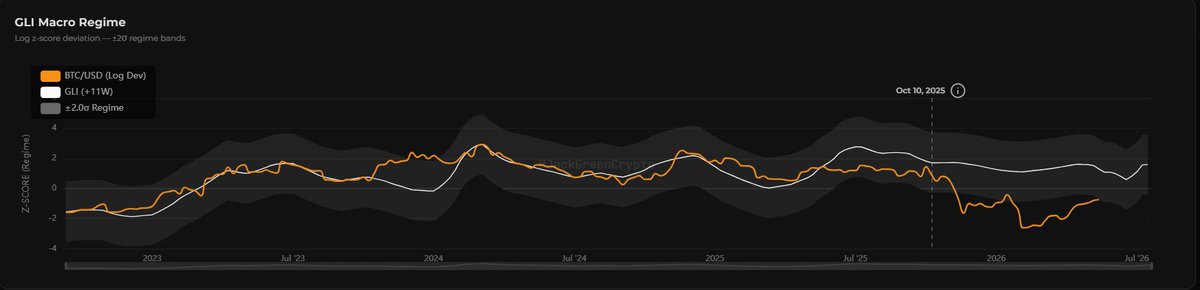
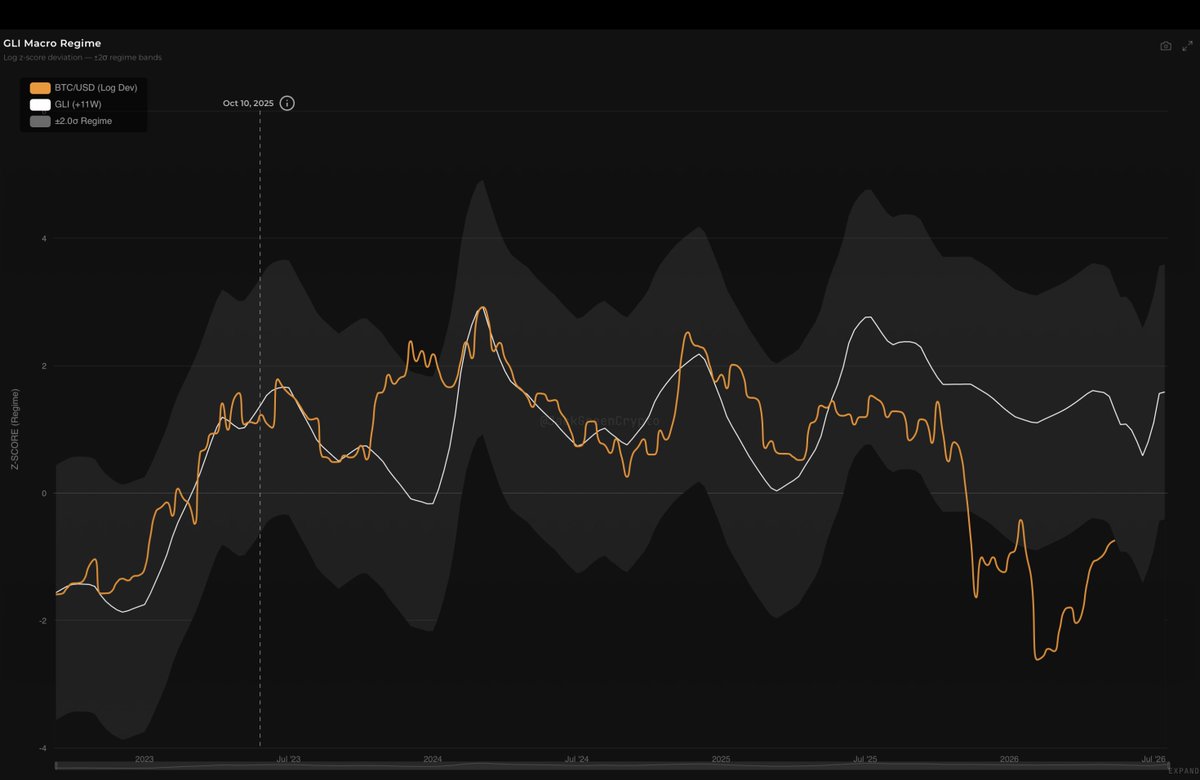
Confluence layer: the GLI Macro Regime model from @JackGreenCrypto has BTC's log-deviation pressing the lower -2σ band since October 2025, while global liquidity itself remains elevated in regime terms. Liquidity never rolled over with price.
The dislocation is real, but so is the setup. Liquidity has held its ground, and price is beginning the walk back toward it.
Looking at the GLI Macro Regime chart from @JackGreenCrypto
The GLI Macro Regime chart reveals a massive structural divergence that is currently resolving in favor of the bulls.
Strategic Outlook: Bitcoin is currently in an undervalued phase, rapidly climbing to "catch up" with the leading liquidity signal. This confirms that the recent lows were a significant macro deviation, heavily reinforcing our current RISK-ON thesis
Two independent regime signals now aligned:
→BTC/USD vs Inverted DXY from @JackGreenCrypto : risk-off regime flagged from around May 18th to June 28th, 2026 before expecting some bullish pressure in the markets according to the 90 day lag posted.
→ Macro Quarterly RoC Dashboard: Global Liquidity RoC expected to turn negative after peaking on May 18th, 2026, then flipps to a risk-off regime on June 10th according to a similar 90 day lag.
What this means is that we can expect some down pressure in second half of May before the risk-off threshold is breached.
Negative RoC was the early tell. The threshold breach was the confirmation. Both clocks now pointing the same direction.
Good question. On our post-2022 sample the CCF peak sits cleanly at 11 weeks, with 13 weeks still inside the significance band.
Howell's original work points to ~13 weeks, which lines up with a longer historical sample where pre-2020 data carries more weight.
Our hypothesis for the 2-week compression is structural: spot ETFs, regulated custody, and deeper prime-broker plumbing have shortened the path from central bank reserves to BTC.
We re-run the CCF on rolling windows when we update the model, so any further drift toward 9-10 weeks would show up there before it shows up in the headline coefficient. For the current regime, 11W remains the optimal fit.
The lag is expected to keep shortening as institutional depth grows.
Tactical Liquidity Shift: Entering the Negative Regime
Looking ahead to May 19, 2026, our liquidity models indicate a transition into a negative state, with the Global Liquidity Index (GLI) projected at -0.44%.
Using the liquidity regime chart from @BlockPhiCapital to define this macro state, here is what a negative liquidity regime implies for Bitcoin's performance:
Negative Median Returns: Historically, when liquidity enters a withdrawal phase, Bitcoin's median returns scale negatively.
Moderate vs. Massive Withdrawal: Data shows a Moderate Withdrawal results in a median return of -2.3%, while a Massive Withdrawal sees that drop to -5.7%.
Asymmetric Volatility: While Bitcoin rallies hard during liquidity injections, the "Negative" box plot confirms it is prone to sharp drawdowns during contraction regimes.
Distribution Shift: The horizontal median line in the red "Negative" box sits below the 0.0% axis, indicating a statistically higher probability of downward price action compared to neutral or positive regimes.
The Takeaway: As we approach May 19, the shift from a "Strong Positive" to a "Negative" liquidity state suggests a tactical cooling-off period where the probability of a drawdown significantly outweighs the potential for expansion.
@Antho_mehdi@0xFinish Ça va dump imo. Les gens qui sont dedans veulent vendre et quitter crypto. Ils ont investi dans un autre régime macro. Ça dépend à quelle valuation ça va commencer, mais je n’achèterais pas. Le produit est bien, donc si ça forme une base, tu achètes cet été
The Kelp DAO hack could have been DeFi's 2026 black swan. 116k unbacked rsETH dumped into Aave caused a massive liquidity crunch, but an onchain recapitalization prevented collapse.
The Defi United coalition secured 137,215 ETH to plug the ~$290M hole with Arbitrum, Consensys, and Mantle carrying most of the load.
No forced liquidations. Just DAOs and founders coordinating to cover the bad debt. Crucially, zero user funds were lost, the only ones taking a haircut were the attackers themselves.
@therealchaseeb Vitalik openly talked about this, L2s are becoming more inefficient than the mainnet. The problem they are trying to fix is slowly going away.
@Flowslikeosmo Banks did everything in their power to make sure that stablecoin yield would not be passed on to the user.
It would simply be too large of a threat for them and with their strong lobbying power, they won.