These are all the (public) educational videos I’ve made so far. 📽️👇
If you’re serious about improving, they’re worth your time:
• May 24, 2025 — How I chart from scratch (ETH)
https://t.co/Y03xjZVH8k
• July 31, 2025 — The Art of Refining https://t.co/WmytgyOTwe
• Sept 8, 2025 — How to execute your trades
https://t.co/0K9wQDv1TV
• Nov 10, 2025 — 1-month collab update w/ @IamZeroIka (trade walkthroughs) https://t.co/HuWXei3FHn
• Dec 9, 2025 — 2-month update w/ @IamZeroIka (ETH breakdowns)
https://t.co/1HJ5cTBgHH
If it helps you, a like or share is appreciated (small payback 🙂)
Study → apply → refine.
In the next instalment of my past notes on @Moneytaur_ we will be covering FVGs.
I am here to learn, and grateful for anyone pointing out mistakes or flaws in my interpretations. 🙏
- MTM - FAIR VALUE GAPS -
- Definition & Basics
An FVG (fair value gap) is the area left behind by aggressive PA. The FVG is the part of the candle’s body that’s not wicked by the prior or subsequent candle. These gaps, also known as “inefficiencies,” “displacements,” or “air,” indicate zones of minimal resistance or support due to the lack of trading volume within them.
While supply & demand and order blocks are areas of significant buy/sell action, FVGs represent zones where minimal price action occurred. They are voids left by rapid, aggressive moves that typically get revisited, not to capture liquidity but to fill the vacuum left behind.
-------------
- FVGs are PA Magnets
For a bullish/bearish FVG to form, buyers/sellers must dominate, creating an imbalance. The tendency for FVGs to get filled is explained by Liquidity Rebalancing.
However, considering what we know about market manipulation, there’s an additional layer: FVGs hold little liquidity and can be substantial in size, making them prime zones for market makers to exploit. Manipulating PA in these zones is cheaper and can lead to large price swings, which cause emotional reactions from retail.
“Find imbalance such as the CME gap on BTC @ $9,750. That’s what 🧲 PA.”
https://t.co/W61U1NHlkX
If our level aligns with the base or top of an FVG, it can offer us +1 confluence as to where PA is likely headed. Since FVGs offer minimal resistance and tend to get filled, a move to the EQ or a complete fill of the gap is probable.
“That weekly imbalance on AAVE though.”
https://t.co/CQpNfuoFSQ
-------------
- FVGs & Order Blocks
Combining the concepts of order blocks and FVGs creates a potent setup. The concept of hidden liquidity is foundational to MT’s whole strategy.
While OBs draw PA due to liquidity concentration, FVGs attract PA due to voids. When these zones align, the gravitational pull on PA intensifies.
FVGs: Easy to rebalance/manipulate, obscure OBs from retail’s eyes, act as a liquidity draw.
OBs: Hold liquidity, attract PA, likely to cause reactions.
📝The more FVGs obscure an OB, the more “hidden” and powerful it becomes.
“FVGs in itself mean nothing. It’s what they hide.”
https://t.co/rqTon1LkZY
🔺Ideally, we want to find hidden liquidity at or beyond the EQ, for two reasons:
1. The FVGs draw on liquidity is reduced, increasing the likelihood of the desired reaction from our level.
2. SL placement will be tighter if we use the end of the FVG.
-------------
- Fibs/Equilibrium & FVGs
- Fibs
When we have double hidden levels, we can consider the Fibonacci level to be fresh as PA showed no prior reactions. This also applies to single hidden levels, but the reason we focus on double hidden levels is that the level will then be back in discount/premium when it returns to its origin point.
A prime example is MT’s classic ATOM trade:
https://t.co/eWxbDTfbA6
- Equilibrium
The EQ of an FVG functions similarly to the EQ of an OB. Once the EQ is taken, the FVG should be considered taken. This is the only FIB level MT draws for FVGs.
“From FVGs I only look @ 0.5”
https://t.co/R2Ai0m3F1r
-------------
- Gaps > FVGs
“CME gap is levels above ‘empty’ FVG.”
https://t.co/AsxTKjW2Tp
MT’s statement made me dig as to why this may be.
FVGs form during active trading sessions, while gaps occur during market closures, overnight, weekends, or even holidays. These gaps can carry more weight than standard FVGs due to prolonged inactivity and potential market shifts.
When PA “gaps” from one trading session to another there will be very few or no executed trades in that range (depending on the asset). There may however be resting orders. This makes these levels possibly even more illiquid than an FVG, potentially increasing its draw on PA and ease to manipulate.
“This entire range, where two ‘Air’ FVGs are located, is structurally weak due to the lack of liquidity. It’s a prime setup for bearish news to be released, driving the price down aggressively through this range.”
https://t.co/5rrF4rq64U
-------------
- FVGs and Entries
MT will sometimes use the end of an FVG as an entry point. In this scenario, he anticipated a full fill of the FVG and opted for a tight SL at the top of the gap. This wasn’t just an empty FVG, there was liquidity behind it, and it was a prior demand zone.
“My following trade is a short at the top of the FVG, and again on high leverage because this specific idea is for an entry when fully closing this FVG, so there’s no need to get into a large SL as the LTF/MTF ‘wall’ has been found.”
https://t.co/S041PzKZq3
🔺The EQ of the FVG can also serve as an entry confluence. Hidden levels found at the EQ or beyond can reinforce the strength of the level.
-------------
- FVGs and Stop Losses
FVGs influence how MT manages stops. Here’s how:
Trailing
When PA takes a level, leaving behind an FVG, and no liquidity levels can be found to target, MT shifts to trailing the position based on the FVG.
The lack of liquidity makes PA more susceptible to rapid moves in either direction. Trailing ensures that gains are locked in while maintaining exposure to potential continuation moves.
“FVGs… Insta-trailing.”
https://t.co/RDnByccFL2
“You’ll start making money when you accept what the market offers rather than demanding it meet your expectations.”
https://t.co/BphLYrEWhy
-------------
- Cover the FVG
MT may use the top or bottom of the FVG to place stops, but this is not a hard rule. The chosen level often varies depending on the specific play and timeframe alignment. Tight spaces between OB ends and FVGs provide more precise SL placements.
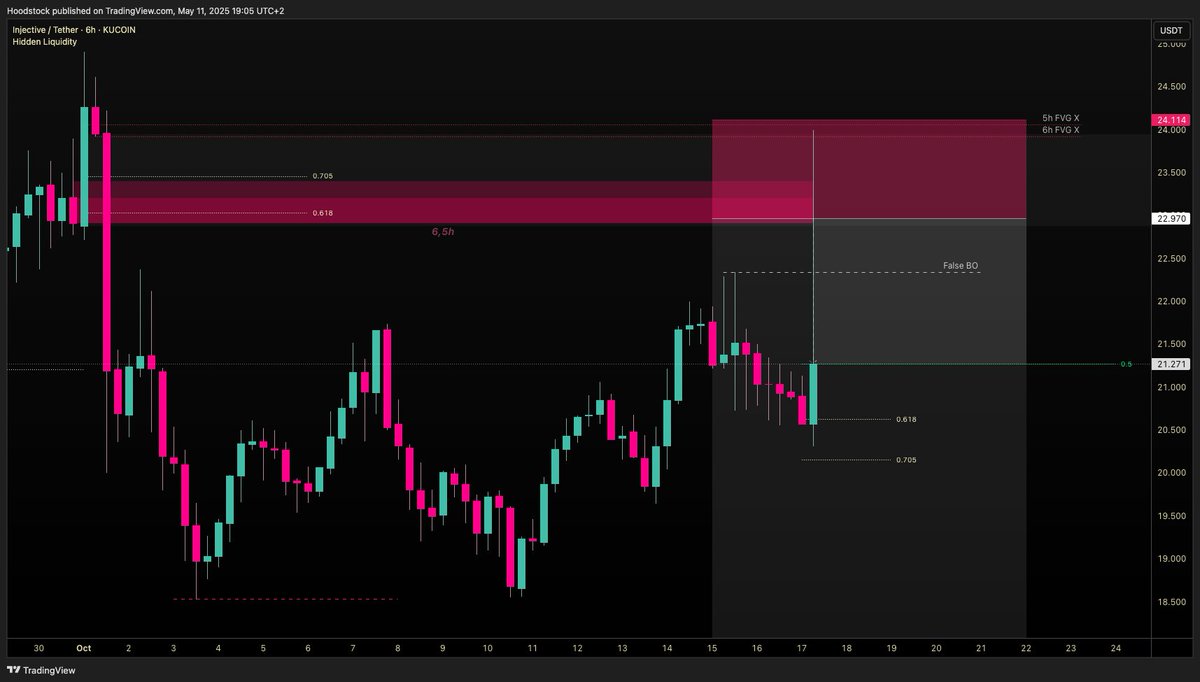
For this INJ trade, MT opted to use the 5H FVG (wider) for cover despite there also being a 6H FVG. This allowed for a marginally increased SL while still covering both zones.
https://t.co/7mV9XHkfe4
“PEPE PA is above the bottom of DBB so stops shouldn’t hit until below it or below FVG.”
https://t.co/dbBNDFh7kz
“FYI on FTM for the ones wondering what they should do with the SL. The tighter the FVG on the BB level, the better.”
https://t.co/6CzlOq9WQe
-------------
- FVGs, Wicks & Opposite Poles
MT often marks wicks from prior candles that pass through an FVG. These can serve as TP, SL levels, or even entry points for opposite pole trades. Their significance increases once the pole lies beyond the EQ of the FVG.
“This chart shows clearly what an FVG means for PA.”
https://t.co/KZsZIkkaR2
This week my past notes on @Moneytaur_ will be focusing on fibs.
- FIBONACCI RETRACEMENT -
- Introduction & Basics
Fibonacci levels are derived from the Fibonacci sequence, which is widely found in nature.
The levels used in trading are: 0.236, 0.382, 0.5, 0.618, 0.705, 0.786, 0.886
Technically, 0.5 is not a Fibonacci number, but in practice, it’s one of the most powerful levels.
In trading, fibs define Premium & Discount of a range and help gauge possible targets within range, or beyond, using extensions and negative fibs.
“ALWAYS start your analysis from HTF’s. Find the range, high and low. Set Fibs from Range high to Range low. Above 0.5 = Premium. Below 0.5 = Discount.
Find Key-levels. Bottom of range low: Find longs. Top of range high: Find shorts.
Trade on that range. Not ‘to the mooon!’”
-------
- Fibonacci in Practice
We always draw fibs from SL to SH or vice versa.
• SL to SH will give us “support” levels we can look for long entries from.
• SH to SL will give us “resistance” levels we can look for short entries from.
(see charts in comments)
- What we look for
Based on the rules of supply and demand we look for longs in discount and shorts in premium of the range. This is why we only use the fib levels that correspond to equilibrium and P&D. These levels are 0.5, 0.618, 0.705, 0.786, 0.886.
We are only interested in untouched levels from previous swings. Once touched the level is no longer actionable.
- Wicks can lie
When wicks hold next to no liquidity and can be considered a scam or flash wicks, we should not use them for drawing fibs from. A good example of this is MT’s INJ trade.
https://t.co/7mV9XHkfe4
- Timeframes & Swings
Timeframes and ranges are key when drawing fibs. The higher the TF and the larger the swing, the more significant the untouched fib level becomes. Within a larger swing, internal structure forms, creating smaller swings with their own fib levels.
🔺Remember, we trade the range, but fib levels from higher TF swings can still align within the current range. Always zoom out to spot these confluences.
- Resetting after the 0.5
When drawing fibs it is good practice to reset the fib after PA closed beyond the 0.5, using the newly printed SL or SH to draw the next fib from.
(See chart in comments)
- The Hierarchy of Fibs
The higher the TF of the swing the more significant the fib level becomes. But the levels themselves are also significant.
0.236, 0.382, 0.5, 0.618, 0.705, 0.786, 0.886
- Sub Optimal
The numbers 0.236 and 0.382 are fibs that MT uses less often. This is because they are not in premium or discount.
They can however still be used to gauge the strength or weakness of a move. A bullish move that finds continuation at the 0.236 shows more strength than one which reverses at the 0.786 and can give us insight as to how strong the current program is.
- Optimal
The levels 0.5, 0.618, 0.705 are the fib levels that we pay the closest attention to. These are the fibs that consistently show the best reactions.
- Semi Optimal
The levels 0.786 and 0.886, if reached, can signal the move is potentially showing signs of weakness. Sudden wicks to these levels can be fine, but slow price action grinding its way to this level can be a red flag.
- The 0.705
The 0.705 is significant because it marks the middle of the OTE, Optimal Trade Entry. MT states this is also what algos are programmed with.
“0.705 is what trading bots are programmed with.”
- The 0.5
As mentioned before, 0.5 is not a number found in the Fibonacci sequence. It does however mark the midpoint of any move, OB or FVG, and thus is extremely powerful.
You can look at it like the line in the sand, a declaration of intent. Moving past the 0.5 signals continuation is likely.
(See charts in comments)
The 0.5 is also a key level used by algos.
“I have seen you using 0.5 of OB or FVG as a support.”
“Just how algos work. Backtest on it or gain experience and you might notice it.”
https://t.co/qb8nP73JFB
-------
- Fibs, an Integral Part of MT’s Trading System
- The power of confluence
The most powerful use of fibs in MT’s trading style is in confluence with key liquidity levels. Finding key levels that line up with fibs adds confidence in our level.
When we find “pocket fibs” lining up with refined levels, confidence grows stronger.
The higher the TF of the fib level the stronger our conviction. If we find an optimal level as outlined in order blocks, and this aligns with an HTF untested fib, we have a strong plus one on an already key level.
- Seeing is believing
This example from Moneytaur is based purely on untested fib levels. Even without the support of liquidity levels you can see the power of Fibonacci.
When paired with untouched, hidden liquidity, we have a powerful recipe to base our trades off, as highlighted in this SUI chart from MT.
https://t.co/Aa6C4Byunl
-------
- Negative Fibs & Extensions
- Projected Levels
Fibonacci levels can also be used with extensions (eg: 1.5) or negative numbers (eg −0.5). These can act as predictive levels. MT uses these as another tool in his arsenal to gauge where PA will likely head to and once reached how to adjust his risk.
An example is this BTC chart, where he references his “best case scenario.”
https://t.co/PglUbzqmW5
“If breaking above, I’ll be trailing all bullish positions.”
The BCS level was likely found with extensions or negative fibs, combined with his market knowledge and experience. If this level would be exceeded, it would prompt him to trail, adjusting his risk based on projected levels.
- Negative Fib Trades
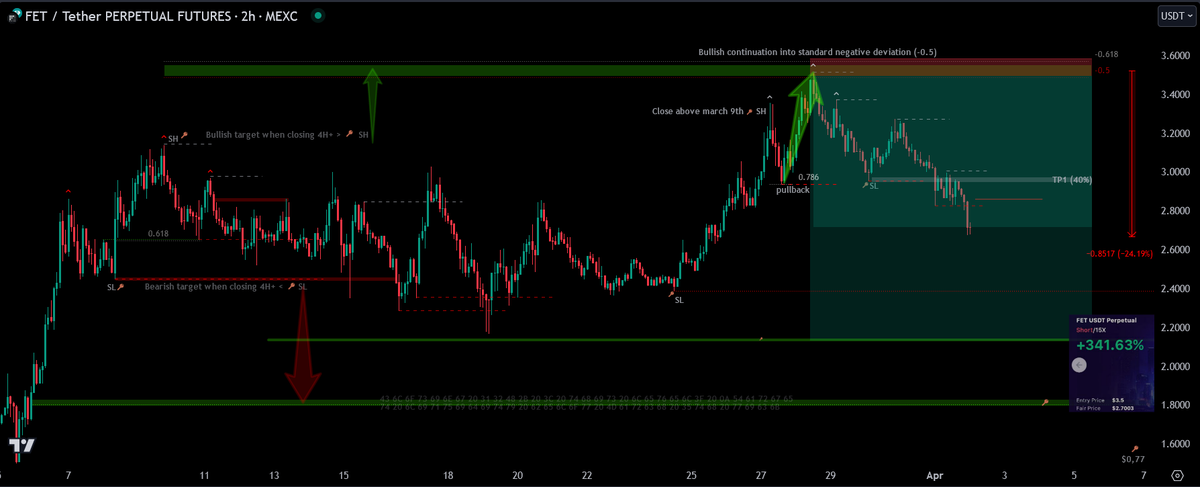
There are even examples of MT taking trades purely off negative fibs.
One using negative fibs is this FET setup. This trade was not based on prior PA, purely negative fibs and his read of PA on micro TFs once the level was reached.
https://t.co/20IM2XZU8d
Another example is this Popcat trade.
https://t.co/OUwlspfATy
This highlights not only his elite trading ability, but also his confidence in negative fibs. Maybe it has something to do with the quote below.
“Algo’s are programmed with fibs, and negative fibs as well. It’s a must tool and it’s not a lagging indicator.” https://t.co/ReTTAgAskO
-------
- Using Fibs for Entries
Fibs provide precise entry points, unlike broader OB zones. Targeting key fib levels within a refined zone can significantly improve RR.
MT often enters on MO, based on micro timeframe reactions. Combining fibs with techniques like VSA can refine entry accuracy. Knowing what reaction you are looking for, paired with a precise spot where you expect the reaction, can offer greater clarity.
“I enter at fibs and 👁️ reaction on micro TFs. I take 0.2 or 0.3% size on such plays. If it’s a good hit into aggressive drop I can add 1 or even 2% to my account from this trade alone, which here I’ve guaranteed already at least +0.5%.” https://t.co/Ooi1XJbqNH
-------
- Stop Loss and Take Profit Strategy Using Fibs
- Stop Loss
When a fib level falls just below or above our marked area we can use this as a potential stop for our trade. Even better if these levels align with other stop levels like the end of an FVG or an OB.
The 0.5 is sometimes also the spot where MT chooses to move his stop loss to break even, SL2BE.
- Take Profit
It is often the case that MT will take profit at the midpoint of a swing. Using the 0.5 as a TP level is especially useful when no other liquidity levels are near.
Crossing the EQ of the swing signals intent from market makers. It is best to take some profit off the table before this decision is made.
In other instances MT chooses to trail his stop loss above or below the 0.5 once it has been passed.
🔺Often fibs will be front run by a hair. When placing entries or TPs it is good practice to front run these levels.
- Take Profit in Price Discovery
We can use negative fibs or extensions to mark areas to take profit when an asset is in price discovery.
"If an asset is in price discovery what’s the best way to identify key levels to sell at?"
“Apart from negative fibs I just trail my positions along with ‘price discovery’.” https://t.co/ZE1yUphIn2
-------
- Algos & Fibs
Algos are predictive and target key liquidity. Any lagging indicator is useless to an algorithm. Market makers seek liquidity. Supply and demand levels and OBs offer this liquidity. Fibs add confluence and are respected by bots.
“it’s as simple as this: HIDDEN LIQUIDITY, and fibs do matter because billion dollar trading bots are programmed with them, and respect them. Most of what whales need to focus on is in ⛽️💡 retail investors while extracting profits 24/7.”
-------
- Using Fibs to Predict PA
In this post about picking coins that could recover after the next bear market, MT says the following.
https://t.co/woarYizqQj
“Coins leaving HTF BBs behind, toward supply zones, above 0.5 fib of macro range. These coins are likely to recover, it’s just how the game is programmed.”
This underscores the significance of the 0.5 level, especially when aligned with key liquidity zones and the intent revealed when these levels are crossed. A valuable reminder for when the next bear market lows emerge.
⚠️ ORDER BLOCKS ⚠️
OBs represent a specific area or zone on a chart where 🐳's have placed buy or sell orders and these zones act as areas of support or resistance. Rely on OBs and not trendlines as it will help you to become more accurate in the markets.
https://t.co/rrmr5a4MGO
OBs represent volume/liquidity. The HTF OBs have more liquidity than the MTF/LTF OBs. Therefore, the HTF OBs have more reversal pressure than the MTF/LTF OBs. An OB can become much stronger if hidden by a FVG. The more hidden an OB is (covered by multiple FVGs), the more likely the price will reverse in that area. OBs can be ignored and left behind by a FVG. Now the previous OB becomes a powerful HOB as it is more hidden.
OBs can also be used to help you figure out the overall trend of the market and understand the current MS. I talk about this in my MS educational post here 👉 https://t.co/X7T8tC5jLG
Some OBs may be partially tested meaning some liquidity has already been taken from that area. This doesn't mean you should ignore but understand that the area is weaker or less likely to hold which means you either risk less or ignore the trade. I try to look for HOBs within pHOBs and If I can't find any, then I risk less or ignore them.
Untested OBs > Partial tested OBs
HTF OBs > MTF OBs > LTF OBs
Personal preference: I like to concentrate on only the bodies or the OB as this is where true liquidity lies but I know some people take the wicks into account. With a strong OB, I like to focus on the equilibrium of the OB, for example setting a LO at the equilibrium of a HTF OB or at an untested fib level which lines up with my identified level. Depending on the size of the OB I may just set the LO at the start of the OB where it will be initially touched.
Price doesn't normally spend a long time below the equilibrium of the OB and you don't want PA to close below the OB as this will tell you that the setup was invalidated. The reaction of PA as it touches the OB will tell you how bullish or bearish the setup is (Typically goes with the overall trend).
I tend to look for the HTF OBs that are followed by engulfing candlesticks (Bullish OB followed by bearish engulfing candlesticks and vice-versa) or at a supply/demand area and refine them when reasonable.
Remember, look for short setups in PREMIUM zones and long setups in DISCOUNT zones. This is very important as it will help you invalidate setups 👉 https://t.co/oLzM0aoqJS
Also, HTF OBs can be hit multiple times before a true reversal, however after each hit the level becomes weaker so keep that in mind. LTFs might only be able to handle one. So being on high alert with a reasonable SL is crucial. You can read about TFs here 👉 https://t.co/11KUquuEQ9
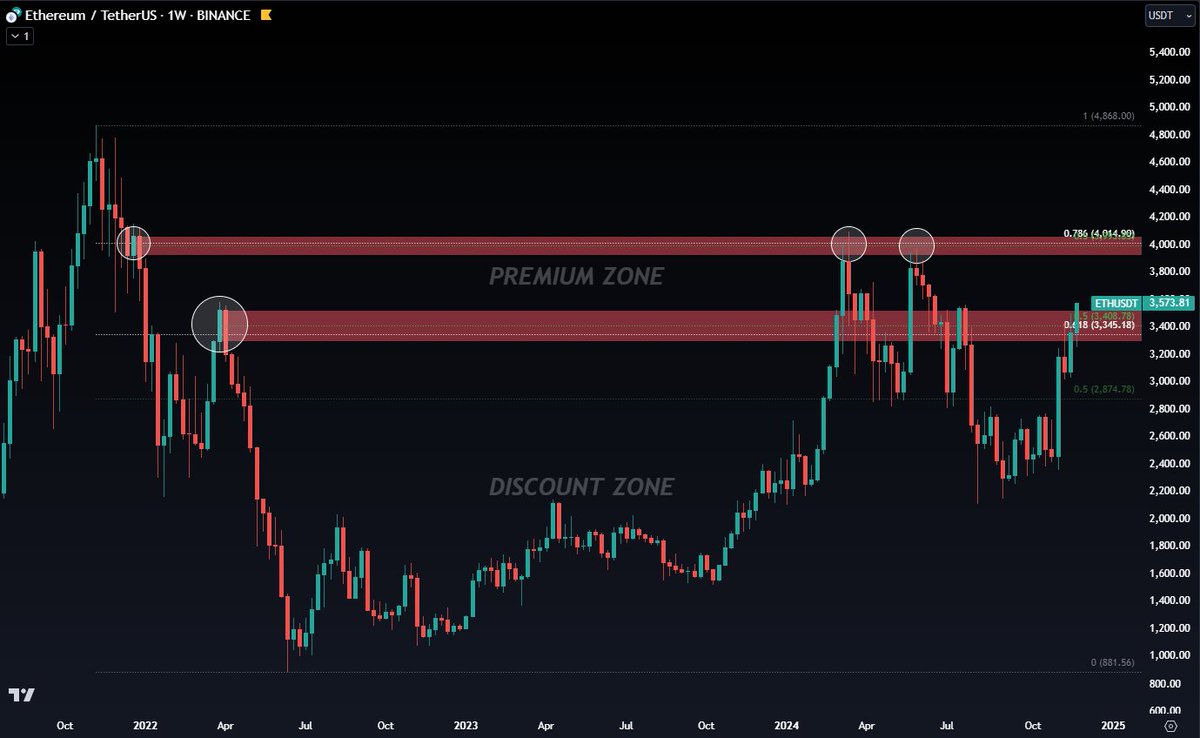
ETH Example:
So in the ETH chart below we can see 2 weekly OBs in the premium zone that line up with our Fibonacci levels.
The 1st 1W OB didn't hold out strong and had a pretty terrible reaction as the weekly PA closed above the equilibrium of the weekly OB and nearly above the whole area highlighted.
I most likely would've taken a short at this level and then got stopped or manually exited my position on a partial loss. You will lose sometimes in this market but you can still be massively profitable with a terrible win rate.
Remember, the reaction of the PA will tell you how bullish or bearish the market is.
The 2nd 1W OB held out pretty strongly as the reaction of the PA was much more violent. PA didn't close above the highlighted area. This setup is being respected way better than the first and you can expect your short to go in your favour.
Remember, HTFs can be hit multiple times before a true reversal. However, after each hit the level becomes weaker so keep that in mind.
This example shows where you can either set up a short or take profit alongside the 🐳's.
Here is a MT example 👉 https://t.co/9WOk9eWKSv
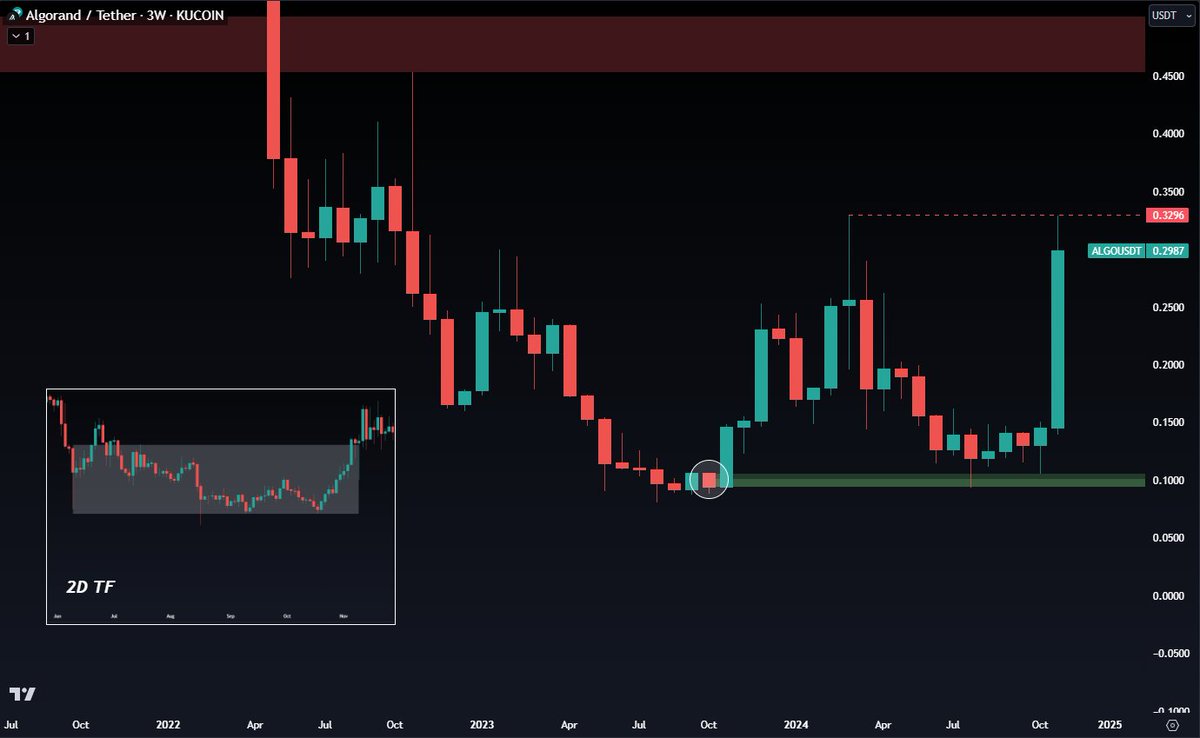
ALGO (Supply and Demand) Example:
Here we have a 3W OB which can be refined down to a 2W or a 7D. Looking at the 2D TF you can see this is a supply and demand area. Whales bought 4 times at the bottom of the channel showing high interest at this price (Discount zone). Whales left behind huge buy orders inside that OB that will be filled in the future. PA hit the 3W OB twice before moving towards the upside.
Remember, HTFs can be hit multiple times before a true reversal. However, after each hit the level becomes weaker so keep that in mind.
Now we know this is a demand zone, you can choose to buy with spot at these prices or try to find a long setup inside the 3W OB with a reasonable SL.
I would recommend filling up your spot bags in these scenarios instead of trying to find a long entry as the SL is higher than 5% but if you can do both, even better.
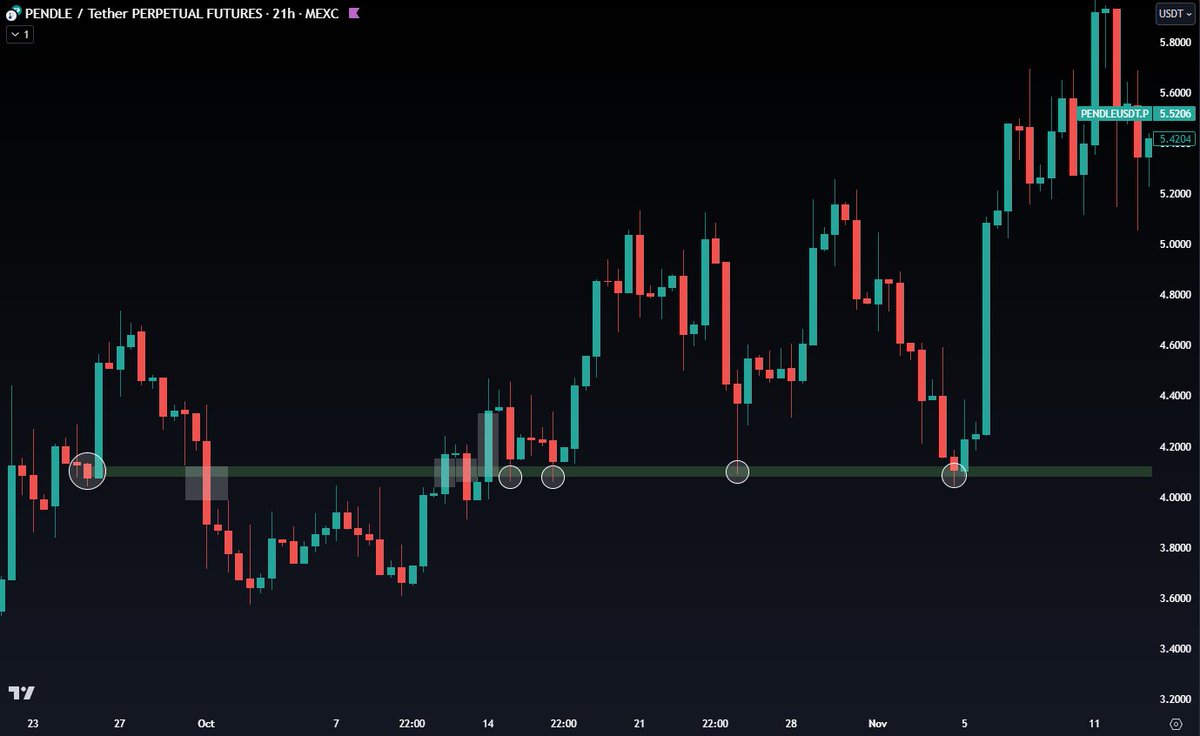
PENDLE (Hidden Order Block) Example:
Pretty simple one here. We have a 21H OB hidden by 4 FVGs. The more hidden the more powerful. PA reacted from this area pretty well as it never closed below the highlighted area.
Remember, as it reacted multiple times you may want to risk less on the 2nd,3rd and 4th try or risk nothing at all. There are many setups out there that will be more optimal.
If you want to look at more hidden order block examples then check out my refinement post. It will probably go down as my best educational post ever. It will level up your game massively as you will start to 👁️ what market makers leave behind 👉 https://t.co/Ix5ZPtKFoq
Here's what @Moneytaur_ had to say when it comes to identifying a setup 👉 https://t.co/Y2adqHzC2Z
I try to make these topics as friendly as possible and it does take some time of my day so if you want me to carry on, please like and repost so it can reach more people 🙏 (If you don't mind that is).
If you have any questions then put them in the comments below 👇