NFLDer in the UK. Lecturer in GIS and Spatial Analysis - U. Sheffield @USPSheffield. Urban econ, big data, spatial stats & open science 🌎 (he/him)🇨🇦🇵🇹🇬🇧
🗺️ DAY 16: CHOROPLETH - What does the UK look like when coloured in by #PremierLeague@premierleague football club colours? That’s today’s #30DayMapChallenge! Obviously the polygon sizes aren’t proportionate to importance - LFC hidden away in their NW corner! ⚽️
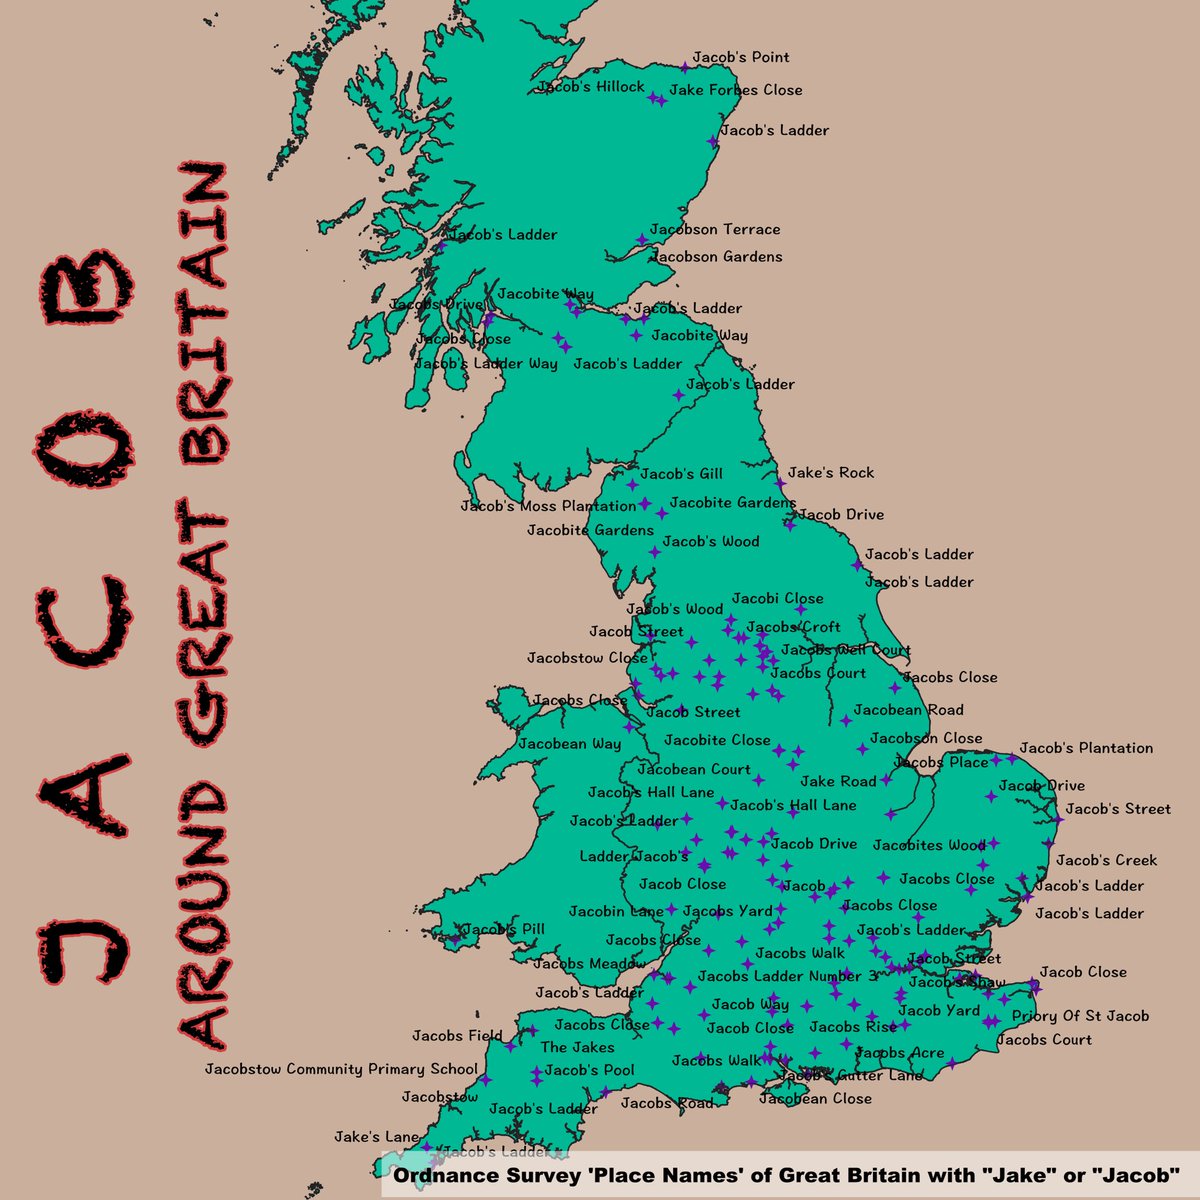
🗺️ DAY 15: MY DATA - “Map something personal”… What’s the distribution of Jacob-based places around Great Britain? Using @OrdnanceSurvey place names for today’s #30DayMapChallenge. Lots of Jacob’s ladders about.
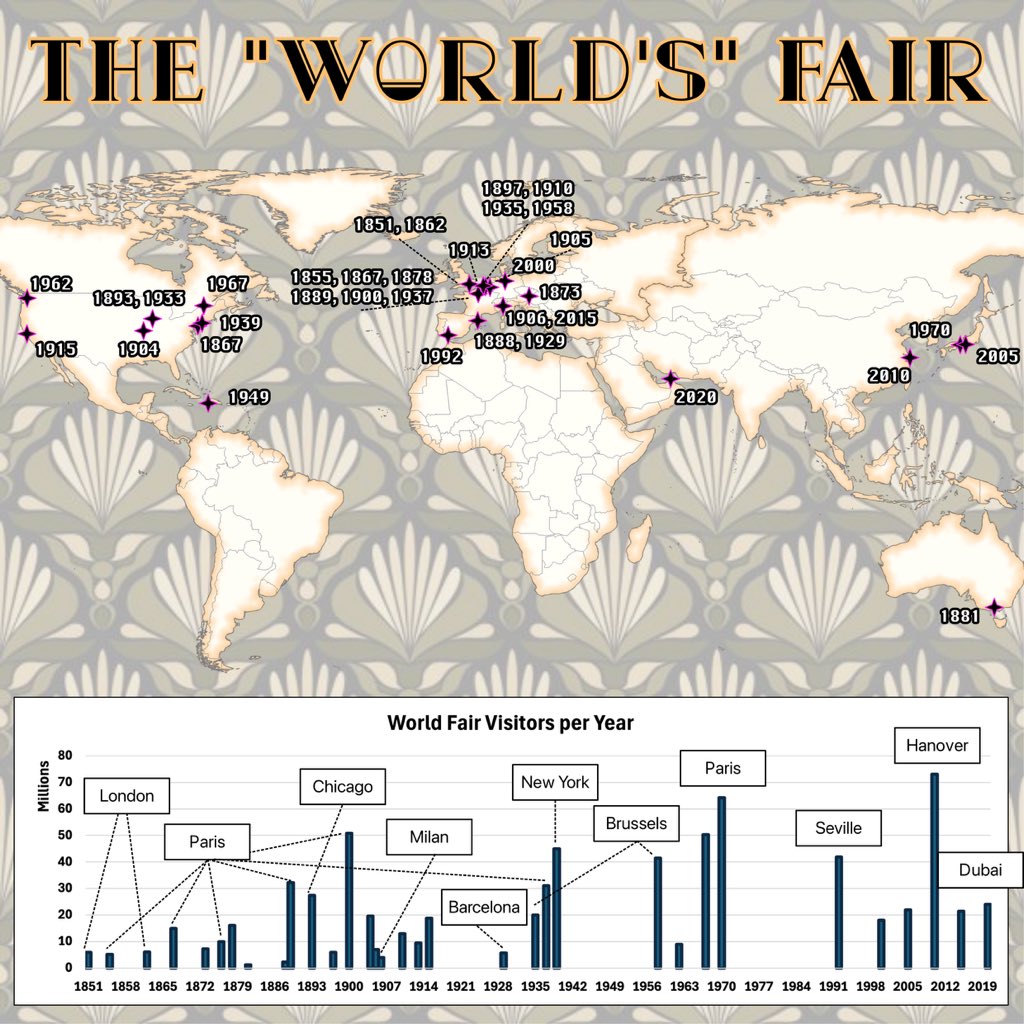
🗺️ DAY 14: WORLD - How Worldly is the distribution of the history of world fairs? Not much it seems according to today’s #30DayMapChallenge. If you’re into planning, architecture, the world fair and serial killers couldn’t recommend “Devil in the White City” enough!
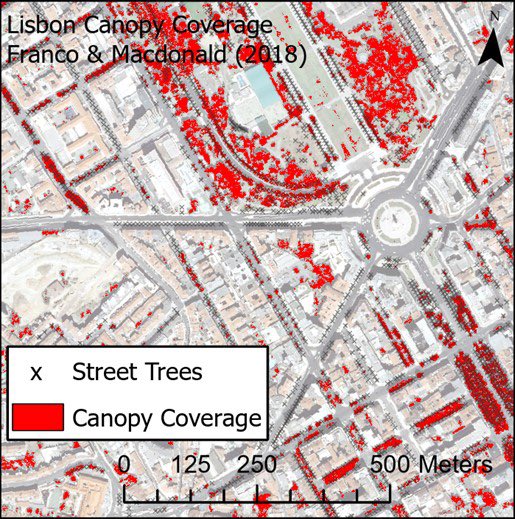
🗺️ DAY 13: NEW TOOL - Not exactly new, but relatively. ArcGIS Pro! I’m so used to QGIS and the former ArcMap, that Pro is still pretty new to me. Learning all along the way! #ESRI#ArcGIS#30DayMapChallenge
Redoing some maps from my PhD tree canopy identification.
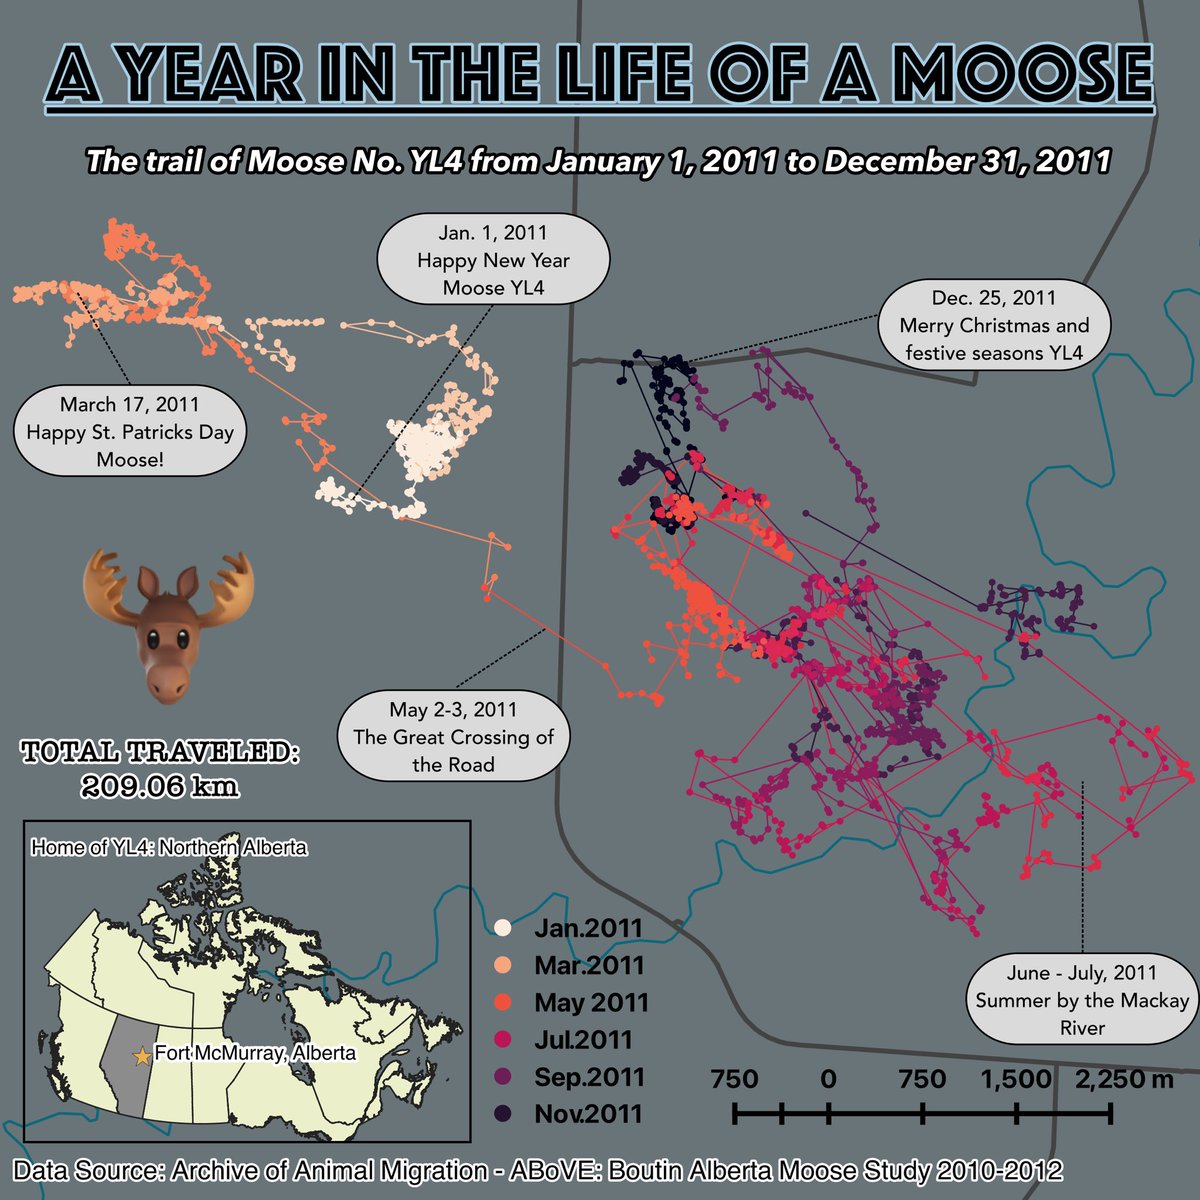
🗺️ DAY 12: SPACE & TIME - Spatio-temporal patterns for a random moose in Northern Alberta today for the #30DayMapChallenge 🫎 Here’s to Moose number YL4 🫡
https://t.co/zIyKwsIFRY
🗺️ DAY 11: ARCTIC - The @ArcticMonkeys have never been to the Arctic for today's #30DayMapChallenge Of course working in @USPSheffield #Sheffield I had to go Sheffield-centric for the theme today.
Some rough data work taken from https://t.co/opNbqK4Yaa
🗺️ DAY 9/ 10: AI/ Pen and Paper - The UK as interpreted by ChatGPT, and Pangaea as interpreted by my hand for these two #30DayMapChallenge Been a while since I’ve gotten to do some arts and crafts! AI-UK just gets stranger the more you look
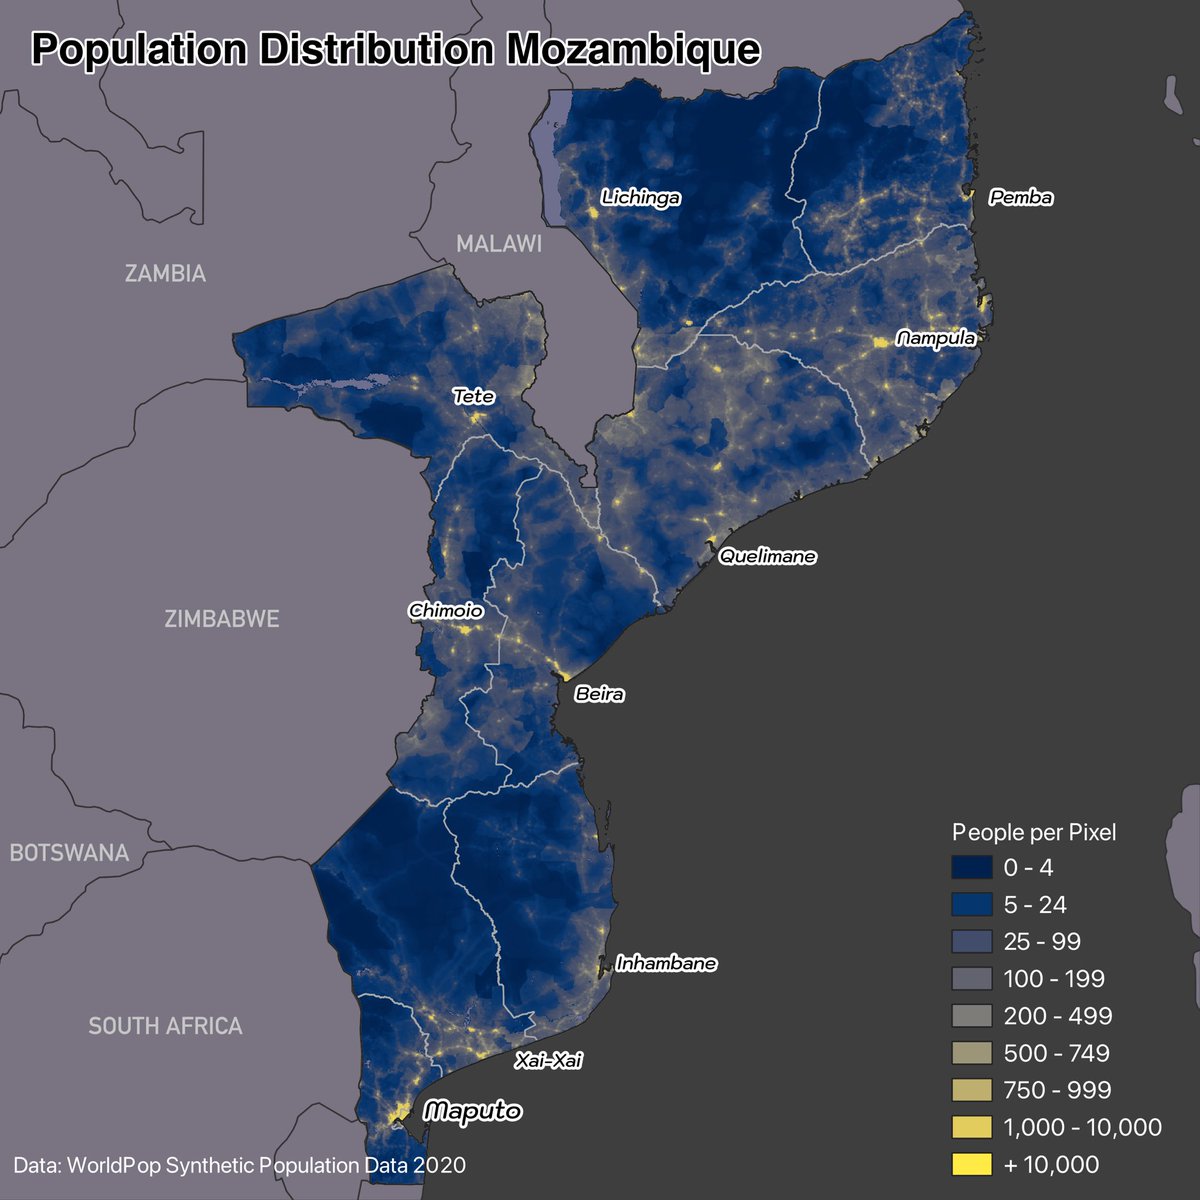
🗺️ DAY 8: HDX Data - Some great datasets on Humanitarian Data Exchange for the #30DayMapChallenge Here’s a map of population density in Mozambique using the WorldPop 2020 synthetic gridded data
🗺️ DAY 7: VINTAGE - Catch up time for the #30DayMapChallenge A pretty basic map playing with some QGIS coastal styles from @awoodruff to capture that vintage hand drawn effect.
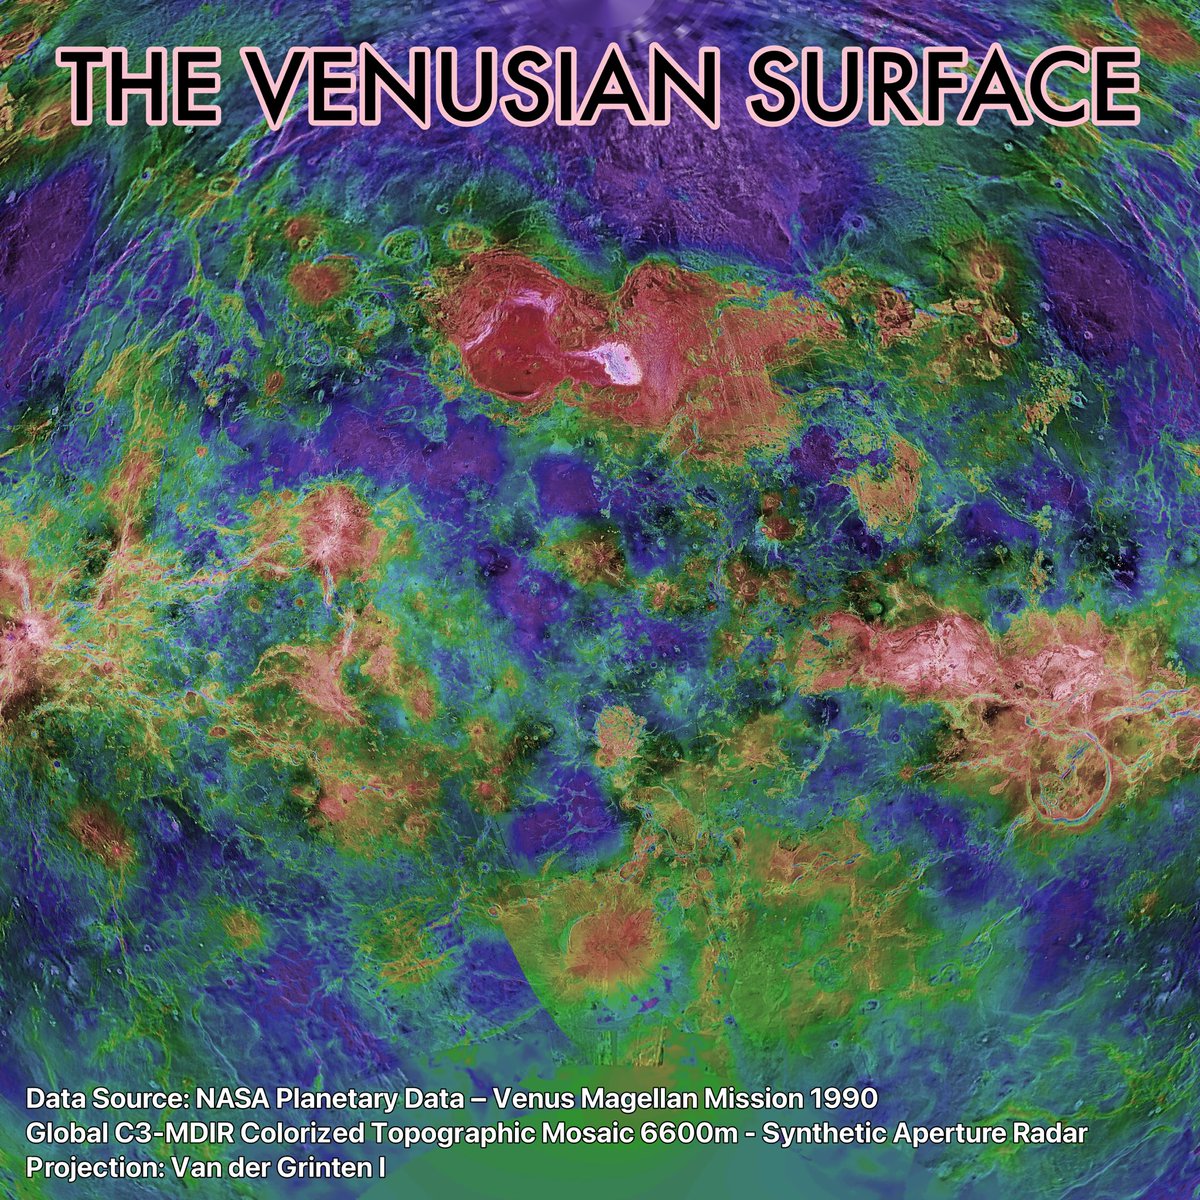
Started on the deep dive of Venus, Magellan, radar rasters, and translating earth coordinates into the Venusian CRS… time to start using QGIS for some more SPACE-ial analysis 😉
🗺️ DAY 6: RASTER - I think we could use a little break from earth for todays #30DayMapChallenge. I’ve been deep into planetary sci-fi books lately so today we have a raster of the surface of Venus from NASA’s Magellan mission 🪐🔭🚀
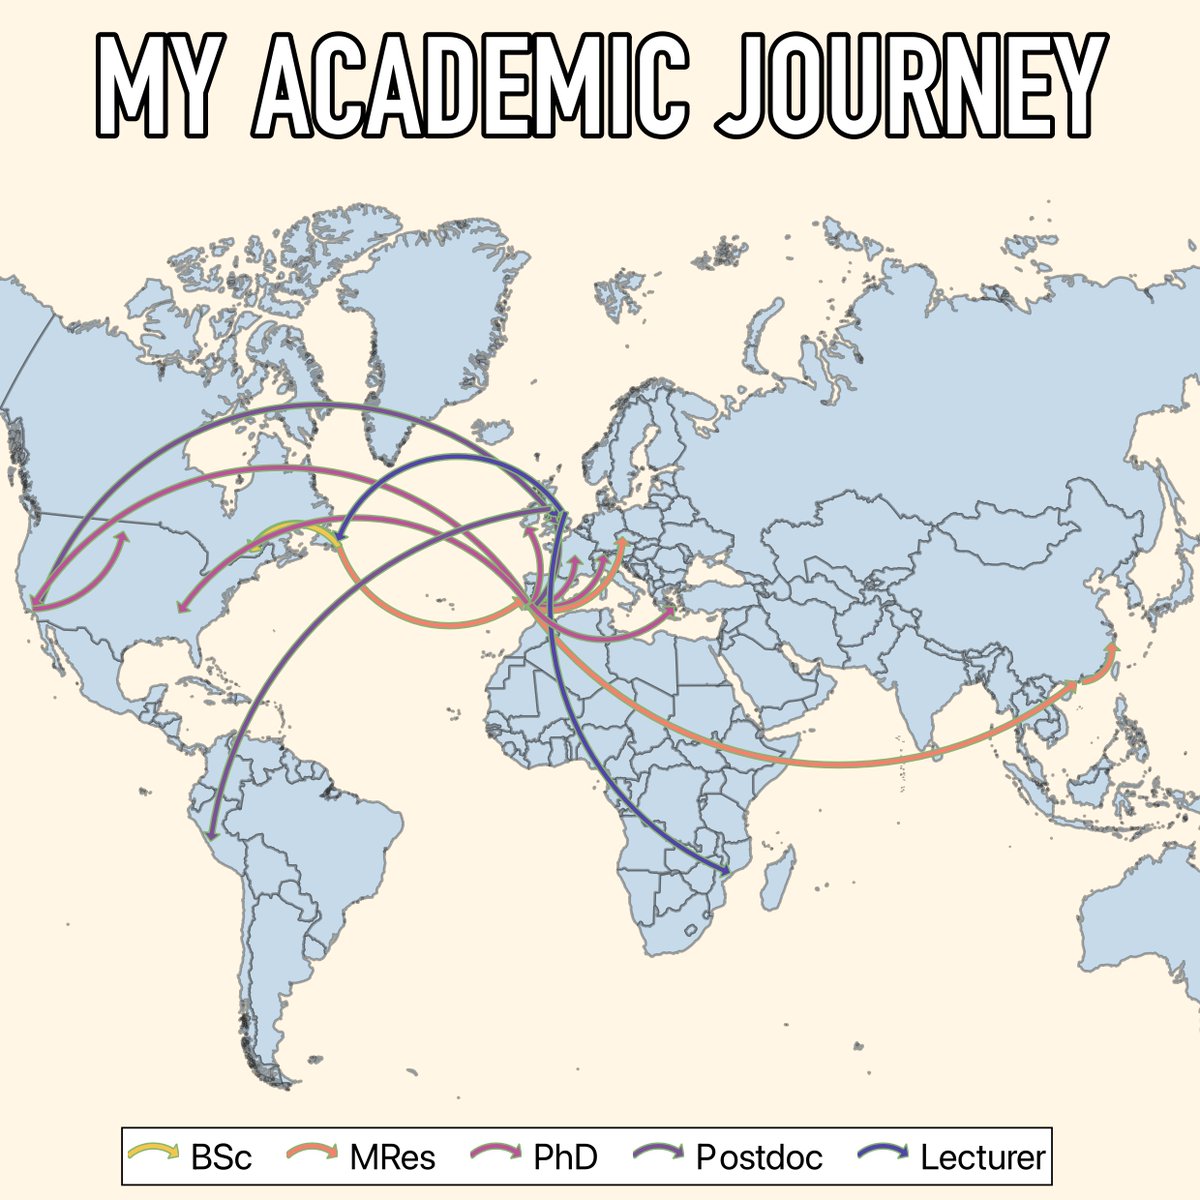
🗺️ DAY 5: JOURNEY - Going personal for todays #30DayMapChallenge on the theme of Journey. Here's a rough mapping out of my academic journey from bachelors to lecturer. 👶👨🎓👨🏫
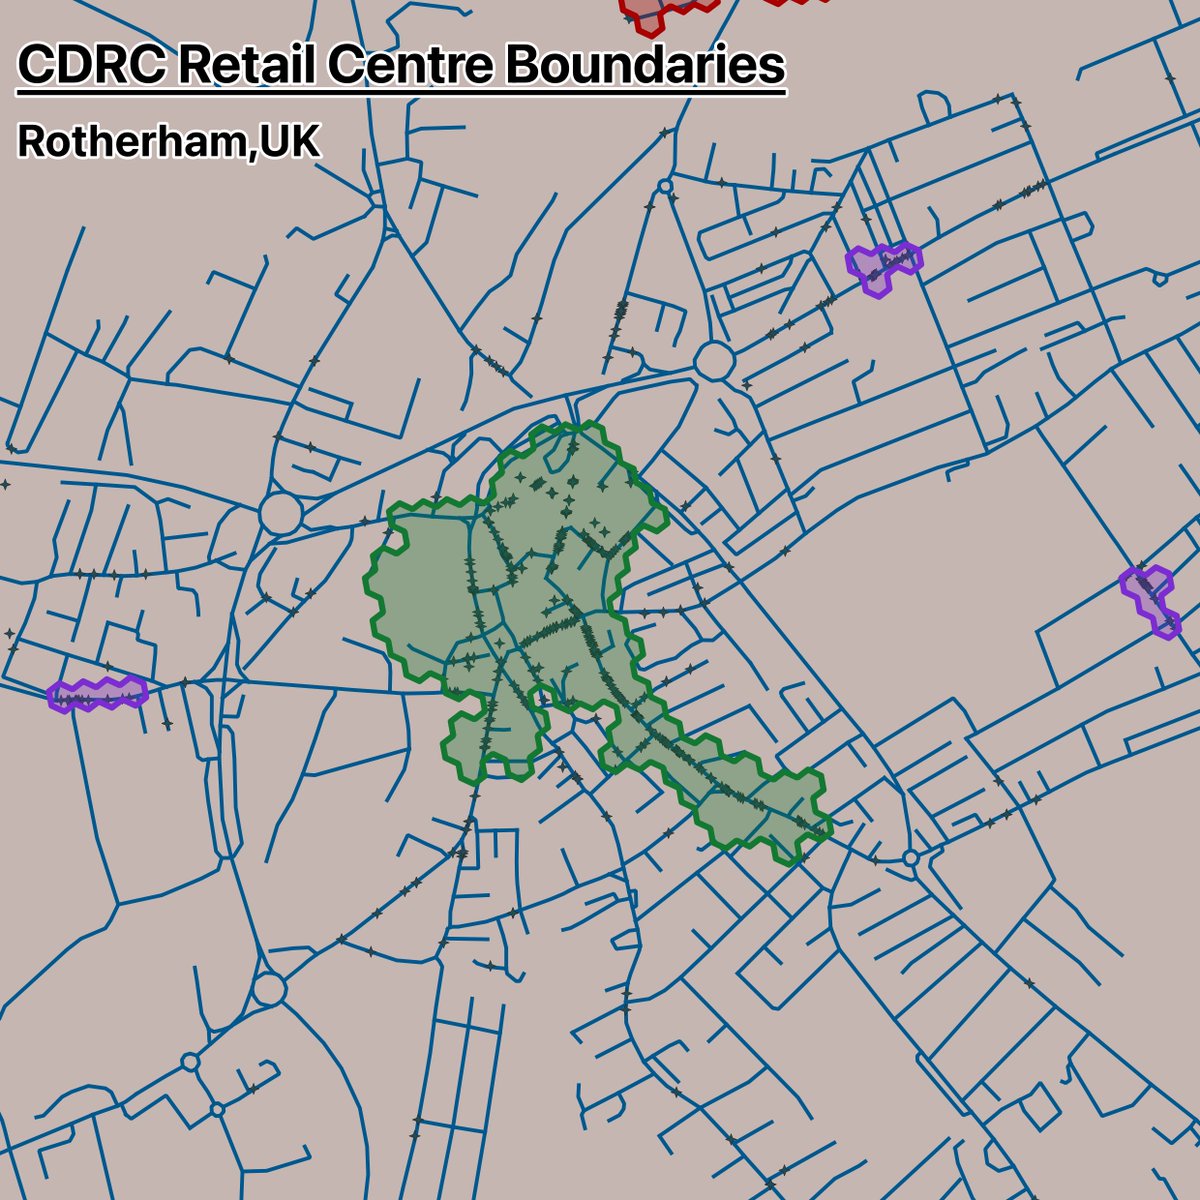
🗺️ DAY 4: HEXAGONS - I had a lot of fun working on this @CDRC_UK retail data product. Lots of retail points and hexagons involved. Here we have the retail centres around Rotherham - but we've got full UK coverage! Explore the data in #OpenAccess linked below #30DayMapChallenge
Great detail on the colour the city here:
https://t.co/oVREwK2bRG
https://t.co/xEljU3cnzh
Would love to see a digitised version of the colours to the houses!
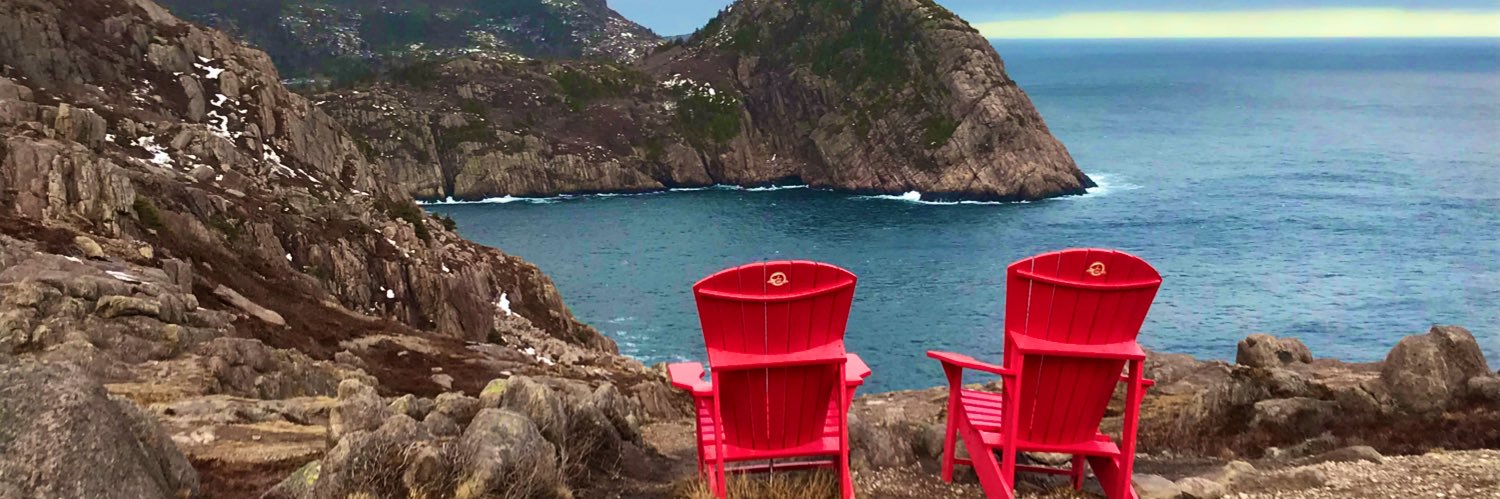
🗺️ DAY 3: POLYGONS - A simple random palette on the houses of St. John's to represent just how colourful the city is with our Jellybean Rowhouses! Considered manually trying to recreate the colour palettes from @hfnlca historic paints, but too many! #30DayMapChallenge
🗺️ DAY 2: LINES - Todays map is looking at the elevation of regional roads across Ireland. Making use of some global elevation data and @GovDataIE road networks #30DayMapChallenge
🗺️ DAY 1: POINTS - Decided to throw my hat in the ring again this year for the #30DayMapChallenge. Told myself I wasn't going to do this, but couldn't stand in front of the GIS design workshops and tell students to make some maps while NOT making maps myself. So here we are!