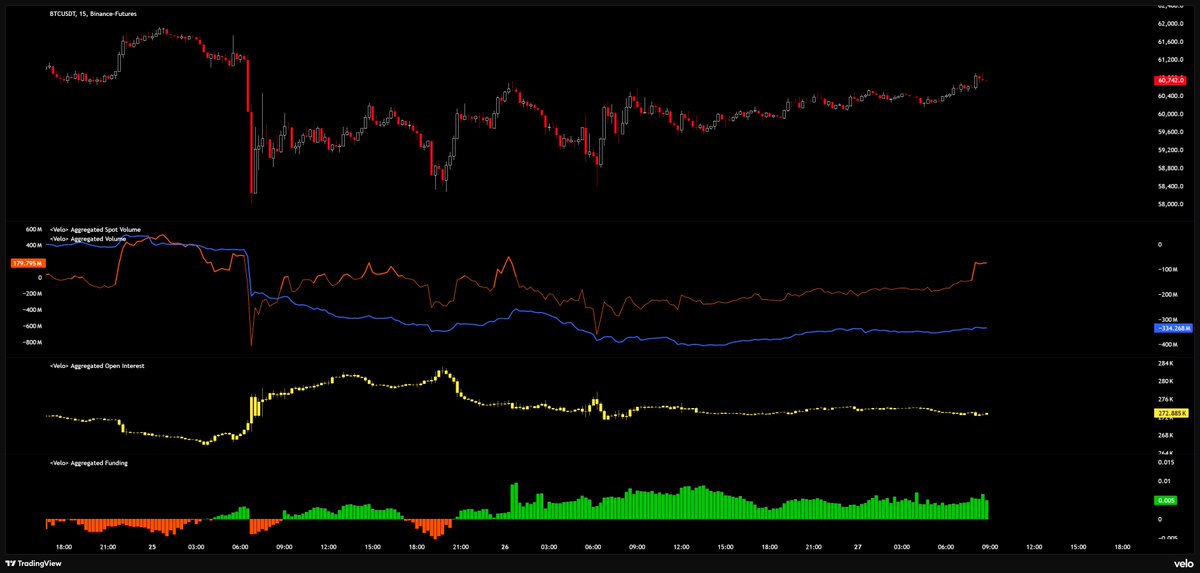
$BTC False Breakout
Careful trading the break into 61k, it's perp driven.
While this is typical PA for a weekend...
Open Interest is Flat
Funding Rates are Positive, &
Spot volume is Low
These are hidden bearish signs.
A lot of the quality altcoins are sitting at a generational bottom.
This is exactly what happened with AI and memory stocks a few years ago.
And look at them today.
NVIDIA went up 20x in the last 3.5 years.
AMD pulled a 10x since the 2022 bottom.
Micron has pumped 20x since last year, while SanDisk has rallied almost 85x.
I think this is exactly what's going to happen with crypto projects that are focused on trending narratives like RWA and stablecoins.
Projects like $LINK , $HYPE and $SOL that are consistently leading in tokenized equities and payment rails while creating value will be the biggest winners.
A lot of large cap alts sitting on $30B or $50B MCap are going to be $500 Billion companies in the coming years.
Weekend Market Outlook | $BTC 📊
Yesterday's relief rally played out exactly as expected after the liquidity sweep. Now the focus shifts to whether buyers can build on that momentum.
Order flow has improved noticeably. Spot selling has slowed, buyers continue defending the daily VWAP and BTC is attempting to reclaim the RVAL (Range Value Area Low) If we see acceptance back inside the value area, a weekend squeeze into the weekly open becomes a high-probability scenario.
I'm also seeing Spot CVD stabilize, suggesting selling pressure is fading while liquidity resting above price becomes increasingly attractive.
Key levels I'm watching:
📍 60.3k– Acceptance above the Value Area Low keeps the short-term bullish case alive.
📍 61.9k–62k– First upside objective.
📍 63.2k (Weekly Open) – If buyers reclaim and hold above the Point of Control, this becomes the next major liquidity target.
That said, nothing has changed on the higher timeframe
The market may squeeze higher this weekend, but I'm still watching the 58k liquidity pool which I believe eventually gets filled. The only question is whether BTC rallies first before making that move.
For now, the books look much healthier than they did after yesterday's flush. The game plan is simple:
• Acceptance inside value → Weekend pump remains likely.
• Sweep the daily high → Watch the reaction, not the breakout.
• Monday's open should provide the next directional confirmation.
#BTC #Bitcoin #OrderFlow #Liquidity #Trading
#BTCUSDT
The most amazing tool someone can use (I use it my own way)
No indicators not bullshit
Find the trend, drag the fixed volume profile from day to day not session to session and POC VAL VAH of previous profiles is your confluence for day trade executions.
Pair this confluence with liquidation clusters and fibs and bingo.
Type of shit nobody tells you here
$BTC Short Traders Check List
Reasons not to long RN...
Perp volume High ☑️
Spot volume Low ☑️
Open Interest Dropping ☑️
Funding Rates Positive ☑️
Downside potential still remains high
Using this strategy, I was able to catch a $1,000 move on $BTC
No indicators.
No signals.
No guessing.
All I did was:
• Wait for the retest
• Enter above the Monday Low
• Let price do the work
Simple trading still works.
Now the big question...
Was this just a bounce?
Or the beginning of a bigger move higher?
Personally, I think $BTC visits higher prices before this move is over.
What do you think?
Bullish or bearish from here?
$btc
Last defence of our 60k zone and how to manage emotions during excess
While I am not here to inject hopium that my high timeframe silver channel (green on the chart) (+other confluences) will hold "guaranteed" and while it's more important to wait for a 7.12% bounce first before buying the retest there-after,
for educational purposes, I do want to share the journey of getting (close to) last defence and going through that process, how it "feels" and how to manage it. "feels" because anything you feel in markets is meant to mislead you so that must be managed at all times and especially during last defence and in excess periods.
Last defense and excess is exactly where we are now, we are still in the range of holding the silver zone and the lower end of my purple zone, but by "a thread" so managing emotions here is key.
Because it's that exact point zones look like they are "lost", htf indicators off lesser quality start to point towards bearish (yet they can still fake-out), and candles look at its worst. I ask you, why does that happen so often, whilst they still play out, and why is it so effective for markets to do that?
With this post, I just wanted to highlight exactly that here quickly of why this happens in markets fundamentally, a quick "hack" on how not to fall for it, as well as what to do about it.
This will help you prevent making mistakes or even reshape your approach/framework to make less mistakes at the exact times most mistakes are usually made. Especially as we are in high timeframe excess, where it can take a while.
Again, not to say I am "right" and it holds guaranteed, I am confident, yes, momentum is strong, also yes.
But disclaimers aside, and assuming it "will have worked" months down the line, and I am going to try my best to sail through all the other nuances, because after my bots scanned X for a while, I could not find a single post on the entire platform taking you through this exact process, most are only after it played out or not going in depth as to why htf zones that look like they are lost, aren't in reality. Especially true with the silver zone for instance.
Some of you may already have been through this exact process. If you were around when I brought up the silver zone at 123k (when it tapped), I was getting an extensive amount of backlash when price went to 125k (2k in excess), where I closed all leverage on my last bull market long, how I was "wrong" doing that, yet it still ended up working.
Same exact situation now, (again, not saying it will play out the exact same way, but I am confident, ...).
So realizing this mechanic, comes with valuable fundamental insights and understanding in the market, something I always aim to improve and push towards my close followers, as it gives you more confidence in trading and directly improves results, since your framework is supposed to be built around your logic.
So how come? What is the origin of this mechanic of excess?
Excess
It's all about timeframes and understand precision-power dynamics and trade-offs and how markets take advantage of that to explain "analysts/traders". Long explanations are possible. But in short: high timeframe are more powerful, but less precise and sensitive to price, low timeframe are less powerful, but more sensitive to price, therefore more precise.
That is why we use high timeframes to make a plan (as it stands, this area holding and confidently not seeing sub 50k), and use low timeframes to enter.
So regarding of monitoring a plan, and understanding that dynamic, it looks like the zone is lost, it looks like it's clearly going below it, and it looks like it's breaking down. But locally, it holds because all positions are in excess and institutions are extracting the exact excess liquidity at large amounts.
It's the same liquidity we saw at 15k, for people expecting 12k, now for 50/45k (reverse excess, not liquidations, but aggressive positions).
So, in the same way the market "looked like" it was doing that at the top of the channel, above 125k in live time, the same way it looks like it's doing that right now below it.
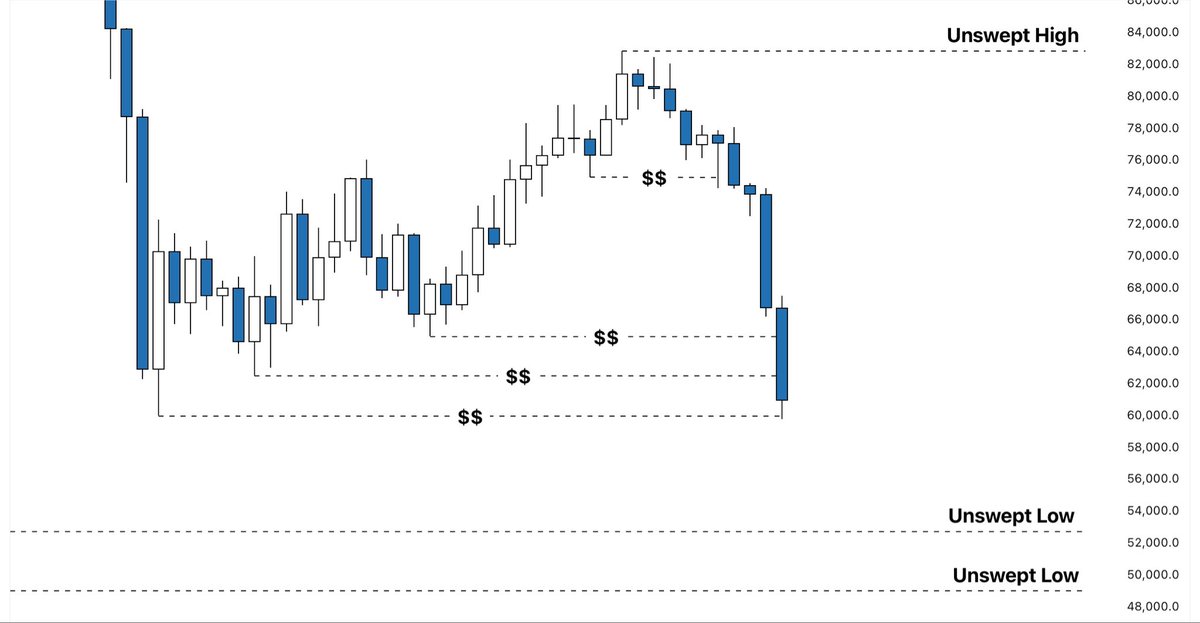
Quantifying excess
Important step, now that we are aware of it, as it helps you to know exactly when the move below is no longer excess. Before moving on, quantifying is useful, but monitoring is better because that shows the real time information. But say you don't have access to that, the back testing all bottoms/tops and notice how far excess went off key zones (learn from success i.e. the bottoms/tops for future success).
Without going too deep and just looking back one instance: excess at the top was just over 3%, excess so far now is just over 5%, still both in the same realm so this could very well be classified as excess.
So, it's not that the zone "doesn't work" or the 60k call "failed" (yet). The same way many said my silver channel at the top of 125k "failed", the same concerns occur now.
It's because of the local view and mixing up timeframes. All it takes is waiting for the monthly close, and suddenly it looks less bad.
That is why we always execute on a lower timeframe, and use the high timeframes as plans, unless you use a broader invalidation, accomodating for excess of course. Either way, being able to imagine excess, how moving beyond and reaching that moment where it looks like it's breaking down (but it hasn't), imagining what it will look like (future projecting) will save you more than it hurts you, therefore increasing your performance.
And this is exactly why I still prepare mentally for a bounce, imagining how it will play out followed by expecting a retest to buy, in the midst of excess and when most have already given up.
That's the elegance of separating execution with plan, and linking both together during the ever so often occurring edge cases.
I present to you this very occurrence taking place now potentially (if successful), a crucial snapshot, one to come back to (if successful), for your future reference.
$BTC
Price is still trading around the recent local low.
If this weekly candle closes below that level, downside continuation towards $52.500 becomes highly likely.
However, a weekly close back above it could indicate a possible liquidity sweep, in which case low risk long scalps may become worth trying.
Overall we will most likely break these range lows to the downside and target the support at $52.500 next.
I’ve been waiting fucking MONTHS
for this EXACT moment
generational entries are coming
$BTC below $50k
$ETH below $1000
$SOL below $60
$HYPE below $50
it’s finally time
in one year exactly
we’ll look back and laugh at all of this
same as the bottom in 2018
2020 and 2022
just like those periods
this time won’t be different
trust me
I’ve done it before and will do it before
Time to shut the haters up.
I’m here to change the real ones life’s.
Simple.
bitcoin:native
Based on the weekly close
1. Close above 65.5k, this was a stop run of the range low and the bottom before a run towards 90k
2. Close below 65.5k, and this down move can still be a deviation, but not a bottom.
I am assuming scenario 1 and buying all the coins.
$BTC
We finally swept 60k.
After waiting months for exactly this, it finally happened.
Now it’s crucial to see how today’s and the upcoming daily candles close.
If we get a strong close below the 60k mark, attention will shift to the lows at 52k and 49k.
If, on the other hand, we get at least three daily closes back above 60k, with a longer wick on the first candle, I’m convinced we will see some upside afterward, likely bringing price back toward the 68k area.
This is a very interesting phase of the market, and I’ll be watching the developments closely.
For who's asking if this is still valid.. Yes
As long as we hold 70 420 on a daily candle close we should still have a local bounce.
If we displace the 70.4k level and close below then most likely it will be followed by a dump towards 65k.
Level by level.